What are the Core Web Vitals? Why it is Important

What are the Core Web Vitals? Why it is Important

Free Complete Site Audit

Access a full website audit with over 300 technical insights.

Something went wrong. Please, try again later.
Trusted by
Sitechecker trusted company

Free Website SEO Checker & Audit Tool

  • Scan the site for 300+ technical issues
  • Monitor your site health 24/7
  • Track website rankings in any geo

What Are The Core Web Vitals?

Core Web Vitals are a set of metrics defined by Google to help website owners, developers, and designers understand the performance and user experience of their websites. Introduced as an essential part of Google’s page experience signals, these metrics focus on three fundamental aspects of user experience: loading performance, interactivity, and visual stability. Their significance stems from their direct impact on how users perceive the speed and responsiveness of a web page, which in turn affects user engagement, satisfaction, and search rankings.

1. Largest Contentful Paint (LCP)

Largest Contentful Paint, commonly referred to as LCP, measures the time it takes for the largest content element on a webpage to become visible in the viewport from the time the page starts loading. This could be an image, video, or even a text block, depending on the layout of the page.

The importance of LCP lies in its ability to gauge perceived load speed. When a user visits a website, they often seek immediate visual feedback, ensuring that the page is loading. If the primary content, like a key image or a headline, takes too long to appear, the user may perceive the page as slow, leading to potential abandonment or dissatisfaction. Google suggests that for an optimal user experience, LCP should occur within 2.5 seconds of when the page starts loading.

2. First Input Delay (FID)

First Input Delay, or FID, quantifies the time from when a user first interacts with a webpage (like clicking a link or tapping a button) to the time the browser responds to that interaction. In simpler terms, it’s a measure of a page’s responsiveness.

FID is crucial because it directly impacts a user’s first impression of a website’s interactivity and responsiveness. A high FID indicates delays in response, which can frustrate users, especially if they’re trying to complete specific actions like filling out a form or accessing a link. For a smooth user experience, Google recommends an FID of less than 100 milliseconds.

3. Cumulative Layout Shift (CLS)

Cumulative Layout Shift, abbreviated as CLS, assesses the unexpected movement of content on a webpage while it’s still loading. Have you ever tried to click on a link, only to have it shift down because an image loaded or an ad appeared? That’s a layout shift, and it’s not only annoying but can also disrupt tasks and lead to errors, like clicking the wrong button.

CLS scores the amount of unexpected layout shifts, with lower scores indicating stable pages and higher scores signifying more shifting. For an ideal user experience, pages should maintain a CLS score of less than 0.1.

Google About Core Web Vitals Metrics

John Mueller, a Webmaster Trends Analyst at Google, has tweeted about Core Web Vitals on a number of occasions. Here are some of his key takeaways:

  • Core Web Vitals are a ranking factor. Mueller has confirmed that Core Web Vitals are one of the many factors that Google considers when ranking websites.
  • Core Web Vitals are not the only ranking factor. Mueller has also emphasized that Core Web Vitals are not the only thing that matters when it comes to ranking. Other factors, such as content quality and backlinks, are also important.
  • Core Web Vitals are not a pass/fail test. There is no single threshold that you need to meet for all three Core Web Vitals metrics in order to rank well. Instead, Google looks at your overall page experience, which includes Core Web Vitals as well as other factors such as mobile-friendliness and intrusive interstitials.
  • Improving your Core Web Vitals can have a positive impact on your rankings. However, it’s important to note that it may take some time to see results. Google has said that it can take several weeks or even months for changes to your Core Web Vitals to be reflected in your rankings.

Here are some specific tweets from John Mueller about Core Web Vitals:

  • On the importance of Core Web Vitals: “Core Web Vitals are important because they measure how users experience your website. When your website loads quickly and is easy to interact with, users are more likely to stay on your site and have a positive experience.”
  • On how to improve your Core Web Vitals: “There are a number of things you can do to improve your Core Web Vitals, such as optimizing your images, reducing your JavaScript, and using a caching plugin.”
  • On the impact of Core Web Vitals on rankings: “Core Web Vitals are a ranking factor, but they’re not the only ranking factor. Other factors, such as content quality and backlinks, are also important.”

Overall, John Mueller’s tweets about Core Web Vitals emphasize the importance of user experience and the need to optimize your website for both speed and usability.

Here is a short video where John Mueller shares 3 top Google SEO updates including core web vitals metrics:

Why Are Core Web Vitals Important?

Core Web Vitals represent a significant advancement in how we understand and measure the quality of user experiences on the web. Their importance can be distilled into two primary domains: user experience and search rankings.

User Experience:

  1. Perceived Performance: While several metrics can gauge a website’s speed, Core Web Vitals focus on how quickly users perceive a page as useful (LCP), how responsive it feels (FID), and how stable the content appears (CLS). These perceptions significantly influence whether a user continues to engage with a site or abandons it out of frustration.
  2. User Retention: Websites that consistently provide smooth and responsive experiences are more likely to retain visitors. In contrast, sites with erratic behaviors, such as unexpected layout shifts or unresponsive actions, are prone to higher bounce rates.
  3. Conversions & Revenue: User experience directly impacts business metrics. A page that loads swiftly and reacts promptly to user interactions is more likely to facilitate conversions, whether it’s e-commerce sales, newsletter sign-ups, or any other action a site desires its users to take.

Search Rankings:

  1. Google’s Emphasis: Google has made it clear that user experience metrics, including Core Web Vitals, influence search rankings. Given Google’s dominant role in directing web traffic, it’s imperative for site owners and developers to prioritize these metrics if they want to maintain or improve their visibility in search results.
  2. Page Experience Signal: In 2020, Google announced the inclusion of Core Web Vitals in its ‘page experience’ signal, which combines these metrics with other user experience aspects like mobile-friendliness, HTTPS, and intrusive interstitial guidelines. This consolidated signal amplifies the importance of Core Web Vitals in determining a page’s ranking.
  3. Competitive Advantage: As more businesses become aware of and optimize for Core Web Vitals, sites that neglect these metrics risk falling behind in search rankings. Optimizing for these vitals can offer a competitive advantage, especially in sectors where many players are yet to adopt best practices.

In conclusion, Core Web Vitals are not just another set of performance metrics; they are a reflection of the quality of user experiences a website offers. Their importance in shaping user perceptions and behaviors, combined with their influence on search rankings, make them indispensable for anyone serious about their online presence.

Lab Versus RUM

In the realm of website performance measurement, two predominant methodologies stand out: lab testing and Real User Monitoring (RUM). While both aim to assess the efficiency and responsiveness of a site, they approach this task from different angles and environments. Let’s delve into the distinctions between these two methodologies.

Lab Testing:

  1. Controlled Environment: Lab tests are conducted in a controlled setting. This means variables like network conditions, device type, and browser version are standardized. This controlled approach provides consistent results, making it easier to reproduce and isolate specific issues.
  2. Synthetic Traffic: Instead of real users, lab testing relies on automated processes or scripts to simulate user behavior. These scripts navigate the website, mimicking actions like clicking links, filling out forms, or scrolling through pages.
  3. Immediate Feedback: One of the primary benefits of lab testing is its ability to offer immediate feedback. Developers can make changes and instantly see the effects, facilitating faster optimization cycles.
  4. Limitations: Despite its benefits, lab testing cannot capture the vast diversity of real-world scenarios. It can’t account for all device variations, network conditions, or user behaviors, making it less representative of actual user experiences.

Real User Monitoring (RUM):

  1. Real-world Data: As the name suggests, RUM captures data from real users in real-time as they interact with the website. This means it takes into account the myriad of devices, browsers, locations, and network conditions that actual users have.
  2. Comprehensive Insights: RUM provides a holistic view of a site’s performance, capturing bottlenecks and issues that might not appear in lab tests due to the unpredictability of real-world conditions.
  3. User-centric Metrics: With RUM, you can segment performance data based on user demographics, behavior, or other criteria. This segmentation can offer insights into how specific user groups experience the site, enabling more targeted optimizations.
  4. Less Control: The primary drawback of RUM is the lack of control. Since data is gathered from real users in diverse conditions, it can sometimes be challenging to isolate specific variables or reproduce issues consistently.

Previous Web Performance Metrics

Website performance has always been paramount for delivering optimal user experiences. Over the years, various metrics have been developed to measure and improve web performance. Before the introduction of Core Web Vitals, several metrics were prominent in capturing different aspects of performance. Let’s delve into these metrics and see how Core Web Vitals have evolved from them.

Page Load Time:

  • Definition: This is one of the earliest and most straightforward metrics. It measures the time it takes for a webpage to fully load all its elements, including images, stylesheets, and scripts.
  • Limitations: As web applications became more dynamic, simply measuring the time to load everything became less representative of the actual user experience. Some essential elements might load quickly, while others took longer, making the overall load time not always indicative of usability.

First Paint (FP) and First Contentful Paint (FCP):

  • Definition: FP marks the time when any rendering begins, signaling the end of a blank screen. FCP, on the other hand, measures the time when the browser starts rendering the first bit of content from the DOM, like text or images.
  • Evolution: These metrics began the shift towards understanding user perception of performance. Core Web Vitals’ LCP (Largest Contentful Paint) is a more refined metric, focusing on the loading of the largest, usually most significant, piece of content on the page.

Time to Interactive (TTI):

  • Definition: TTI measures the time it takes for a webpage to become fully interactive, meaning most elements are usable, and background tasks won’t block user interactions.
  • Transition: While TTI focuses on full page interactivity, Core Web Vitals’ FID (First Input Delay) narrows the scope to measure the delay in responsiveness to a user’s first interaction, capturing initial user experience more effectively.

Total Blocking Time (TBT):

  • Definition: TBT quantifies the total amount of time between FCP and TTI where the main thread was blocked for long enough to prevent input responsiveness.
  • Relation: TBT serves as a lab metric that correlates with FID. While FID captures real-world interactivity delays, TBT helps developers identify and rectify potential bottlenecks in a controlled setting.

Visual Stability:

  • Historical Struggle: Unstable content has long been a pain point for users. Earlier metrics struggled to quantify this experience effectively.
  • Evolution: The introduction of CLS (Cumulative Layout Shift) in Core Web Vitals directly addresses visual stability by measuring unexpected layout shifts, effectively capturing this aspect of user experience.

Viewing The Core Web Vitals For Your Site

Understanding and optimizing for Core Web Vitals is crucial for any website owner or developer aiming for a user-friendly and search-optimized website. Fortunately, Google and other entities have provided tools that allow you to access and interpret these metrics for your site. Here’s a step-by-step guide to help you view the Core Web Vitals for your website:

  1. Google Search Console (GSC):
    • Step 1: Navigate to Google Search Console.
    • Step 2: Log in and select your property (website).
    • Step 3: On the left-hand sidebar, click on ‘Experience,’ then select ‘Core Web Vitals.’ Here, you’ll find a report showcasing the performance of your URLs against LCP, FID, and CLS metrics.
    • core web vitals
  2. PageSpeed Insights:
    • Step 1: Visit PageSpeed Insights.
    • Step 2: Enter your website URL and click ‘Analyze.’
    • Step 3: You’ll receive a detailed report, including a section on Core Web Vitals. This tool offers both lab data (from Lighthouse) and, if available, field data (RUM) for your website.
    • core web vitals assessment
  3. Chrome DevTools:
    • Step 1: Open your website in the Google Chrome browser.
    • Step 2: Right-click anywhere on your page, then select ‘Inspect’ to open Chrome DevTools.
    • Step 3: Navigate to the ‘Performance’ tab and click on the ‘Reload’ icon to capture a page load profile.
    • Step 4: Once the recording is complete, you’ll see a detailed breakdown of various metrics, including those related to Core Web Vitals. Hovering over the metric markers will give you insights into LCP, CLS, and more.
    • chrome devtools
  4. Web Vitals Chrome Extension:
    • Step 1: Install the Web Vitals Chrome Extension from the Chrome Web Store.
    • Step 2: Once installed, navigate to your website in Chrome.
    • Step 3: Click on the Web Vitals icon in your browser’s extension tray. This will give you real-time data for LCP, FID, and CLS as you browse.
    • web vitals metrics
  5. GTmetrix:
    • Step 1: Go to GTmetrix.
    • Step 2: Enter your website URL and initiate the test.
    • Step 3: Once the analysis completes, you’ll get a performance report that includes insights into your Core Web Vitals.
    • gtmetrix report

The Chrome User Experience Report (CrUX)

The Chrome User Experience Report, often abbreviated as CrUX, is a public dataset provided by Google that encapsulates user experiences across millions of websites. Derived from users who have opted-in to syncing their browsing history and have not set up a Sync passphrase, it offers a comprehensive look into real-world user experiences, especially in the context of Core Web Vitals.

Relevance to Core Web Vitals:

  1. Real-World Data: Unlike lab tests that simulate user interactions in controlled environments, CrUX provides insights based on actual user experiences. This makes the data particularly valuable for understanding how real users perceive the performance of a site.
  2. Diverse Metrics: While CrUX covers a broad spectrum of metrics, it prominently features Core Web Vitals – LCP, FID, and CLS – allowing webmasters to gauge their site’s performance against these crucial benchmarks.
  3. Benchmarking: One of the standout features of CrUX is its ability to compare your website’s performance against the broader web ecosystem. This benchmarking can offer a clear perspective on where your site stands.
  4. Continuous Updates: CrUX is updated monthly, ensuring that webmasters have access to fresh data reflecting the most recent user experiences.

Delving Into The CrUX Data In More Detail

CrUX offers a goldmine of data. Knowing how to navigate and interpret this data is pivotal to making the most of its insights.

  1. Origin vs. URL Data: CrUX provides data at two levels – origin-level and URL-level. While origin-level data aggregates user experiences across an entire web property, URL-level data provides insights for individual pages. Depending on your analysis needs, you might pivot between these two.
  2. Histograms: The dataset represents metrics in histogram format. For instance, for LCP, you might see how many users experienced a load time of 0-1s, 1-2s, etc. This granular breakdown helps identify the most common user experiences and areas that need improvement.
  3. Percentiles: CrUX also showcases data in percentiles (like the 75th percentile). This can help identify what proportion of users might be having suboptimal experiences. For example, if your LCP at the 75th percentile is above 4s, it means 25% of your users experience an LCP longer than that.
  4. Segmentation: You can segment CrUX data by various dimensions, including device type (desktop vs. mobile), country, and connection type. This can provide nuanced insights, such as performance disparities between desktop and mobile users.
  5. Integration with BigQuery: Advanced users can delve even deeper by accessing CrUX data through BigQuery, Google’s multi-cloud data warehouse. This allows for intricate queries, joining with other datasets, and custom, in-depth analyses.

Other Information About The CrUX Data

While we’ve already covered the basics and delved deeper into CrUX’s offerings, there are still a few additional aspects worth considering:

  1. Data Collection: It’s important to reiterate that the CrUX dataset only includes experiences from users who have opted-in to Chrome’s syncing feature without a passphrase. As such, it may not represent the entire spectrum of users but offers a substantial sample size.
  2. Limitations on Smaller Sites: CrUX might not have comprehensive data for smaller websites or those with limited traffic. If you’re running a niche or new website, you might need to rely more on lab data and direct user feedback until your traffic grows.
  3. Historical Context: The CrUX dataset allows you to see historical data, giving you a perspective on how your site’s performance metrics have evolved over time. This can be particularly useful for assessing the impact of changes made to your site.

Getting Faster Feedback

Improving your site’s performance is an ongoing journey. To ensure you’re on the right path, obtaining rapid feedback can be invaluable. Here are some strategies and tools for this purpose:

  1. Local Testing with Lighthouse: Before pushing changes live, use Google’s Lighthouse tool to perform local audits. This gives instant feedback on potential performance improvements or regressions.
  2. Real-time Monitoring with Google Analytics: Integrate Google Analytics and set up real-time monitoring. While it doesn’t offer Core Web Vitals directly, you can track user behavior and page load times as an indirect measure of user experience.
  3. Web Vitals JavaScript Library: Implement the Web Vitals library to measure Core Web Vitals in the field for real users. This can be integrated with your analytics solution to capture real-time data.
  4. Feedback Widgets: Use feedback widgets or pop-ups to solicit direct user feedback about site performance or usability issues they encounter.
  5. Continuous Integration (CI) Tools: Tools like Travis CI or Jenkins can be set up with performance thresholds. This ensures any code changes that degrade performance are flagged during the development cycle.

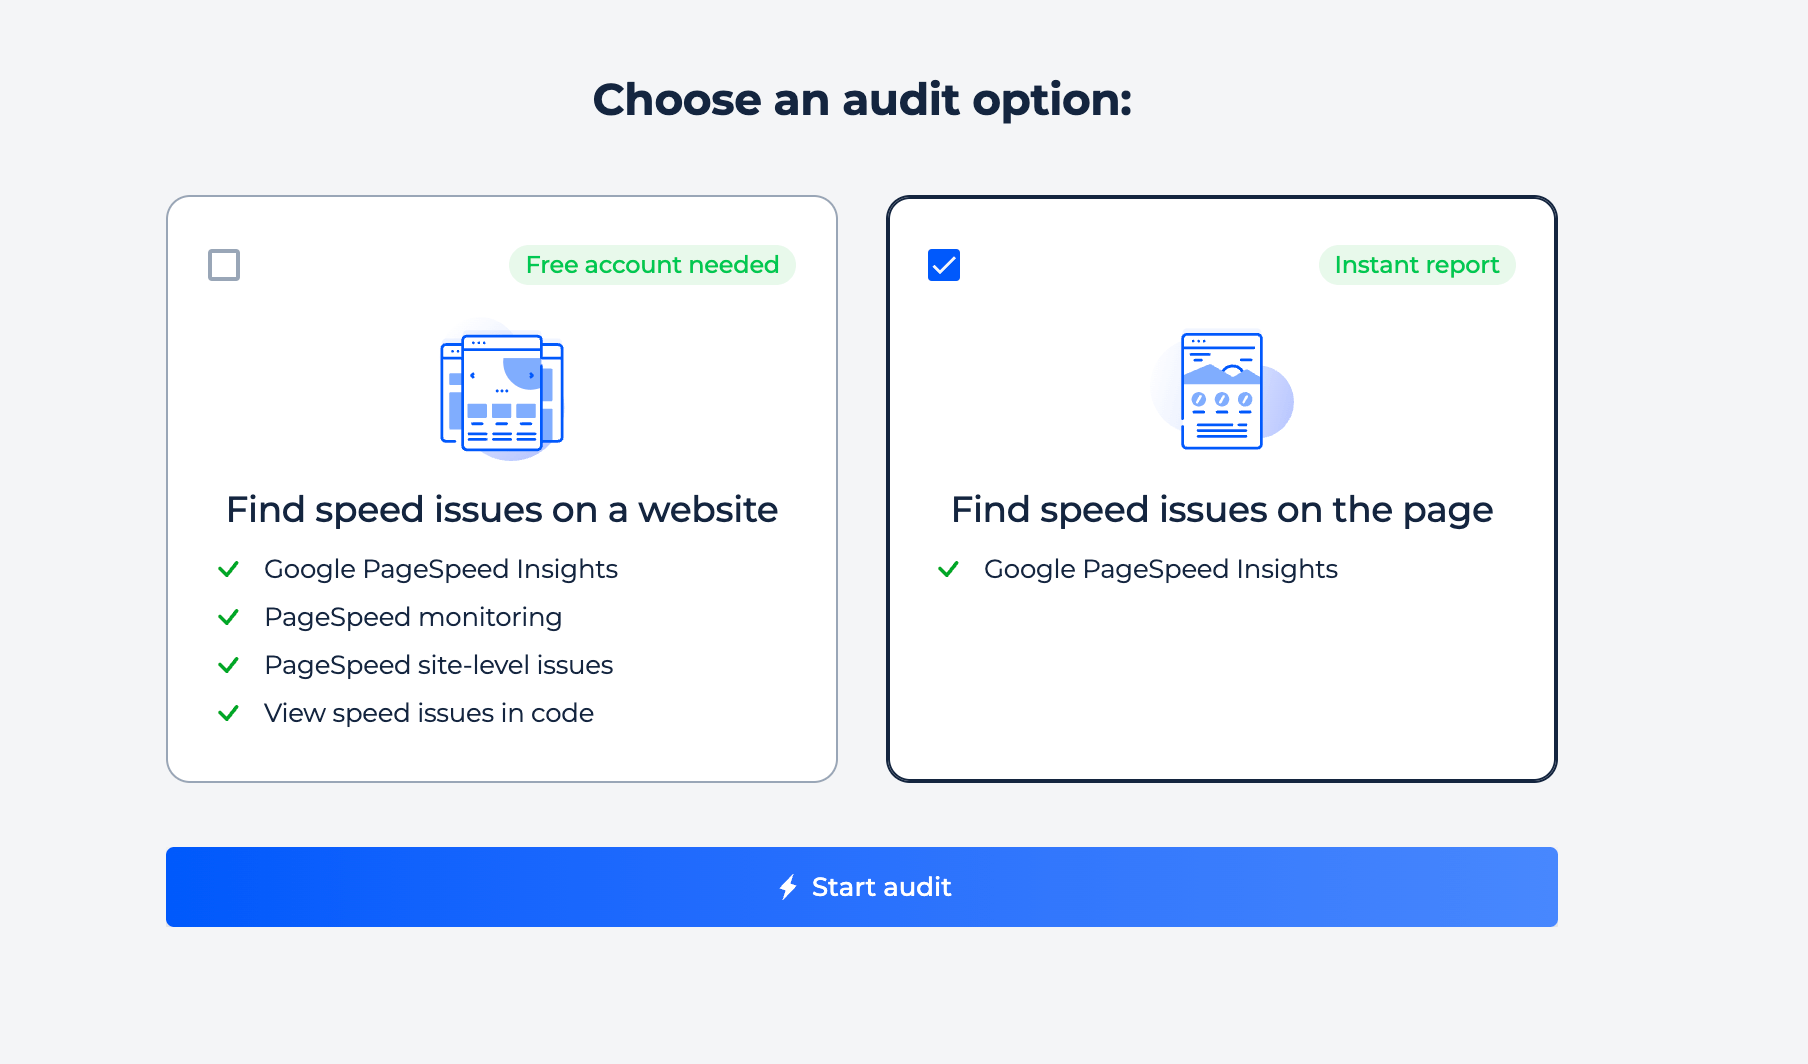
Boost Your Speed Performance With the Website Speed Test Tool

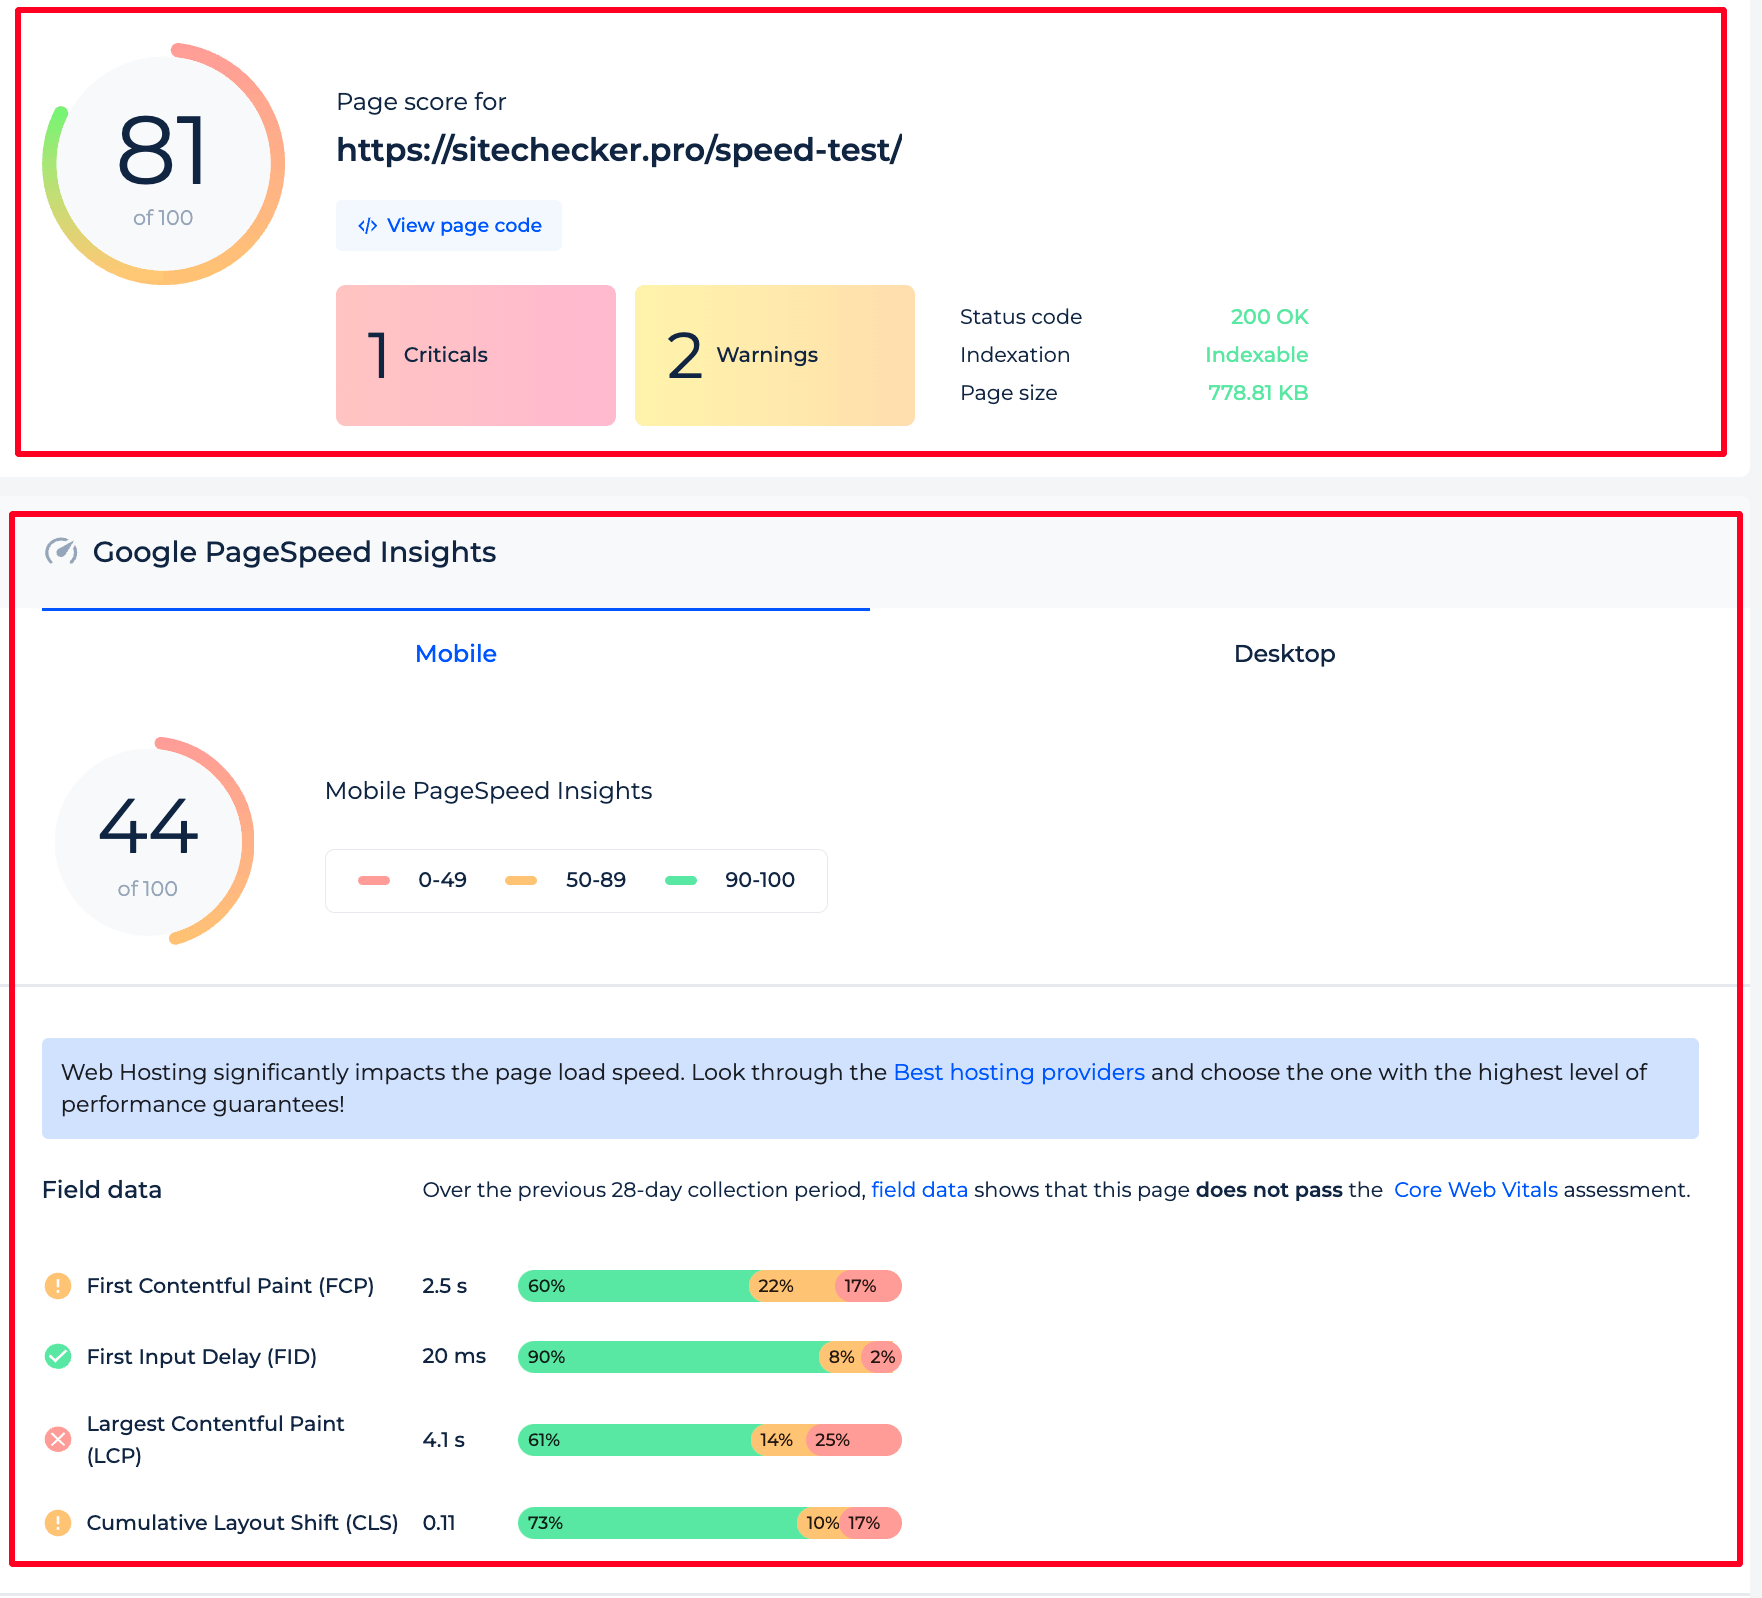
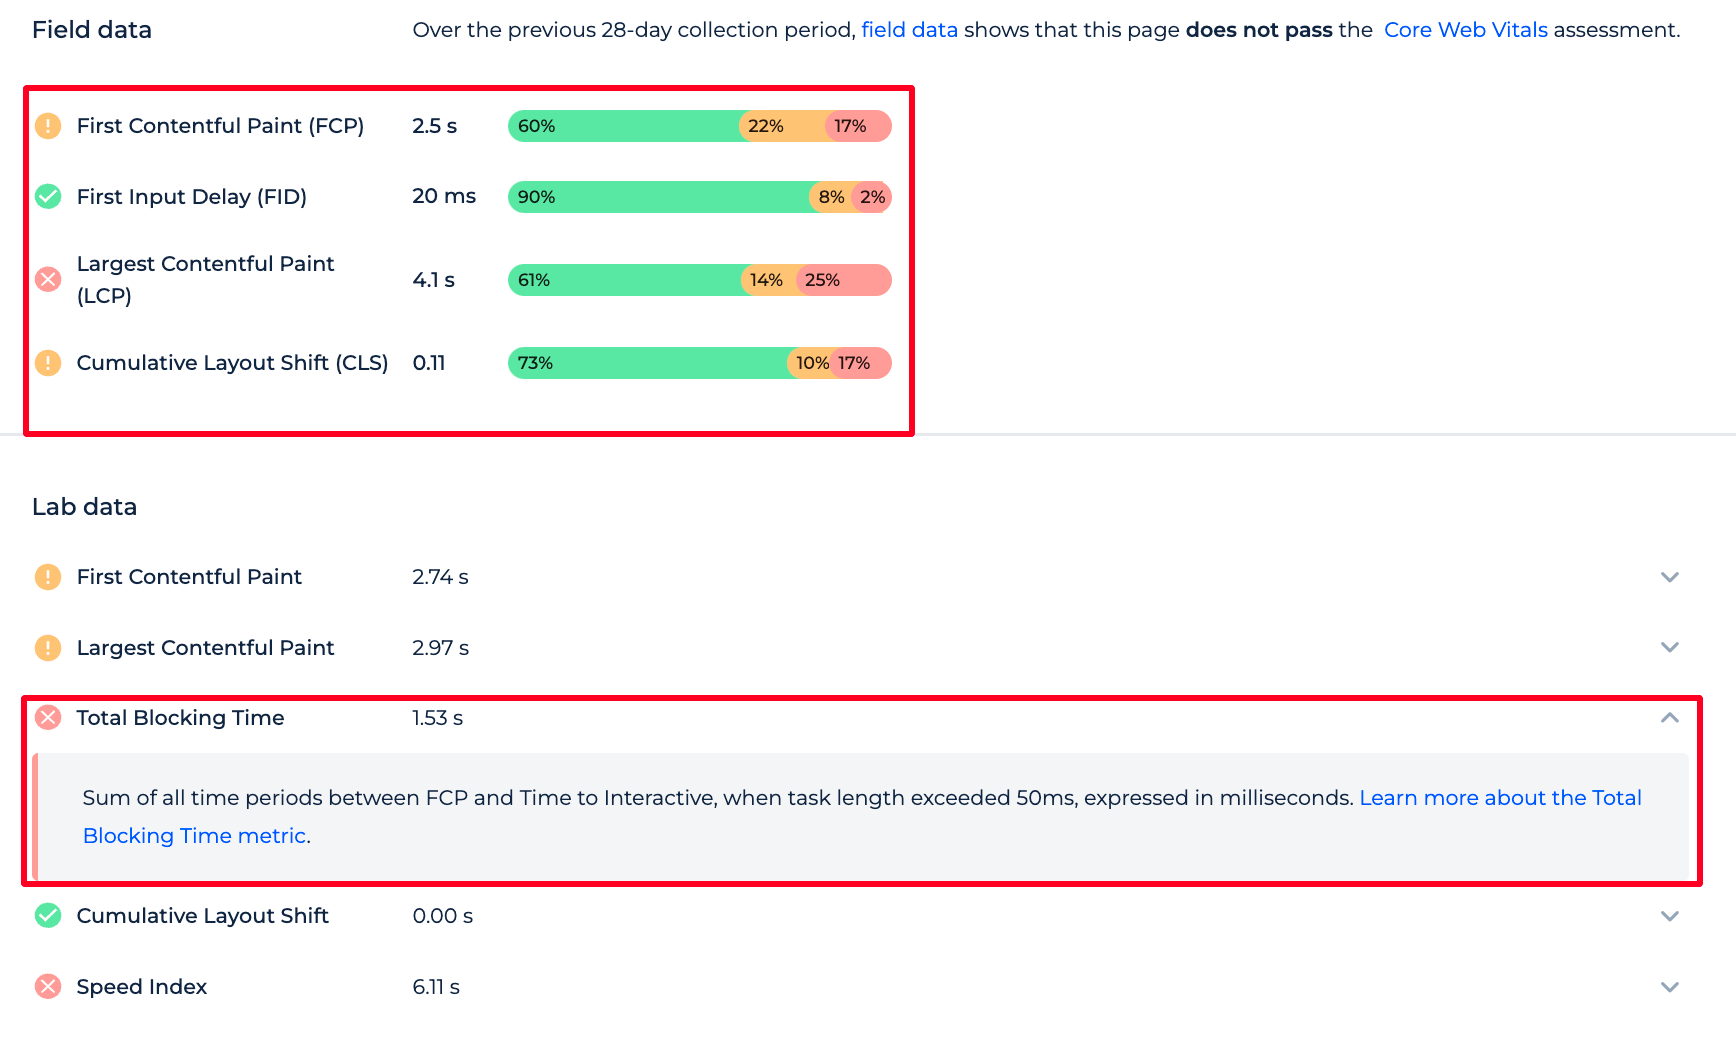
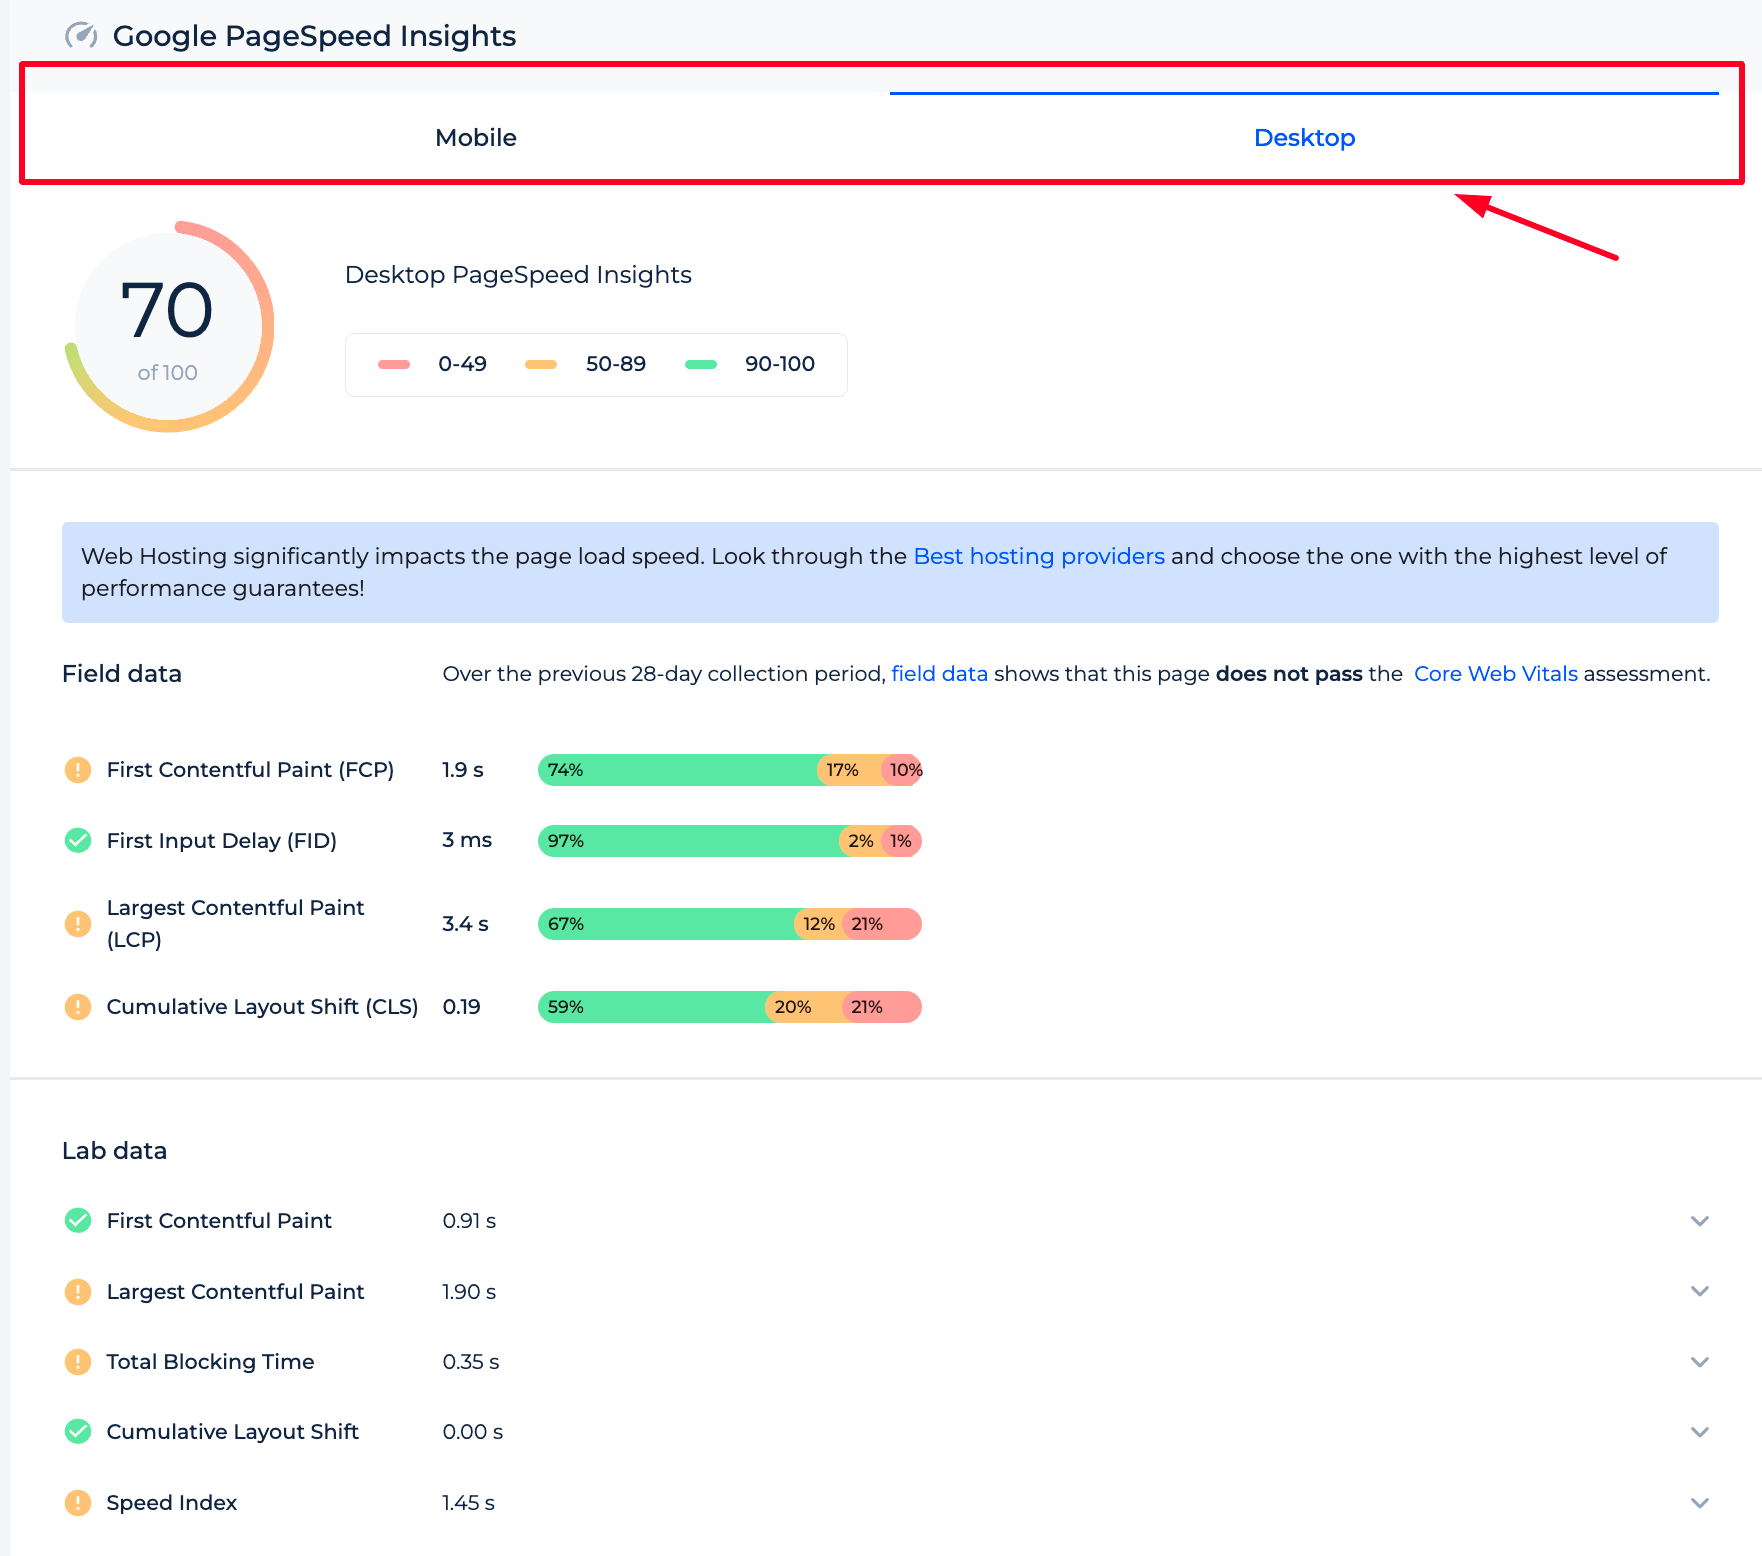
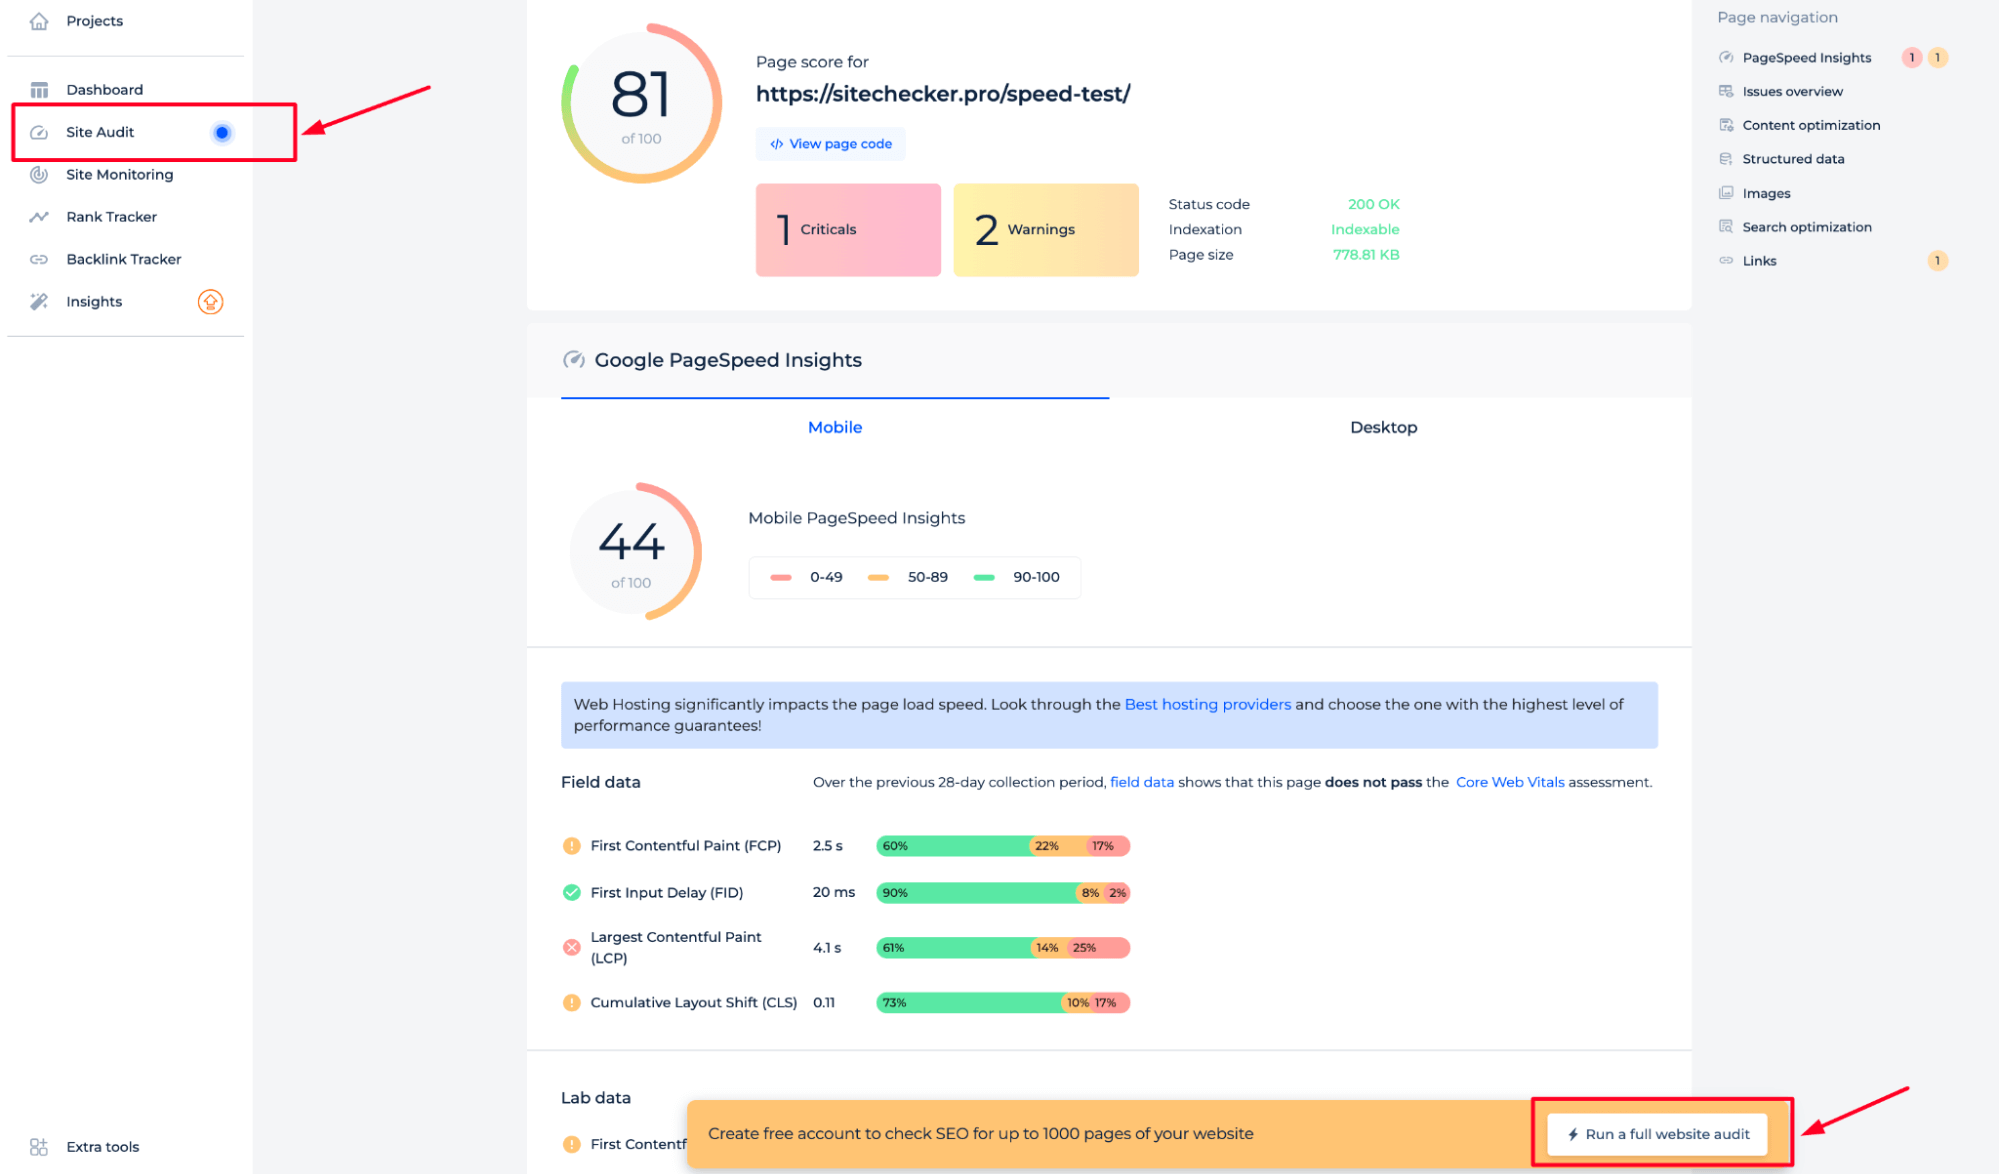
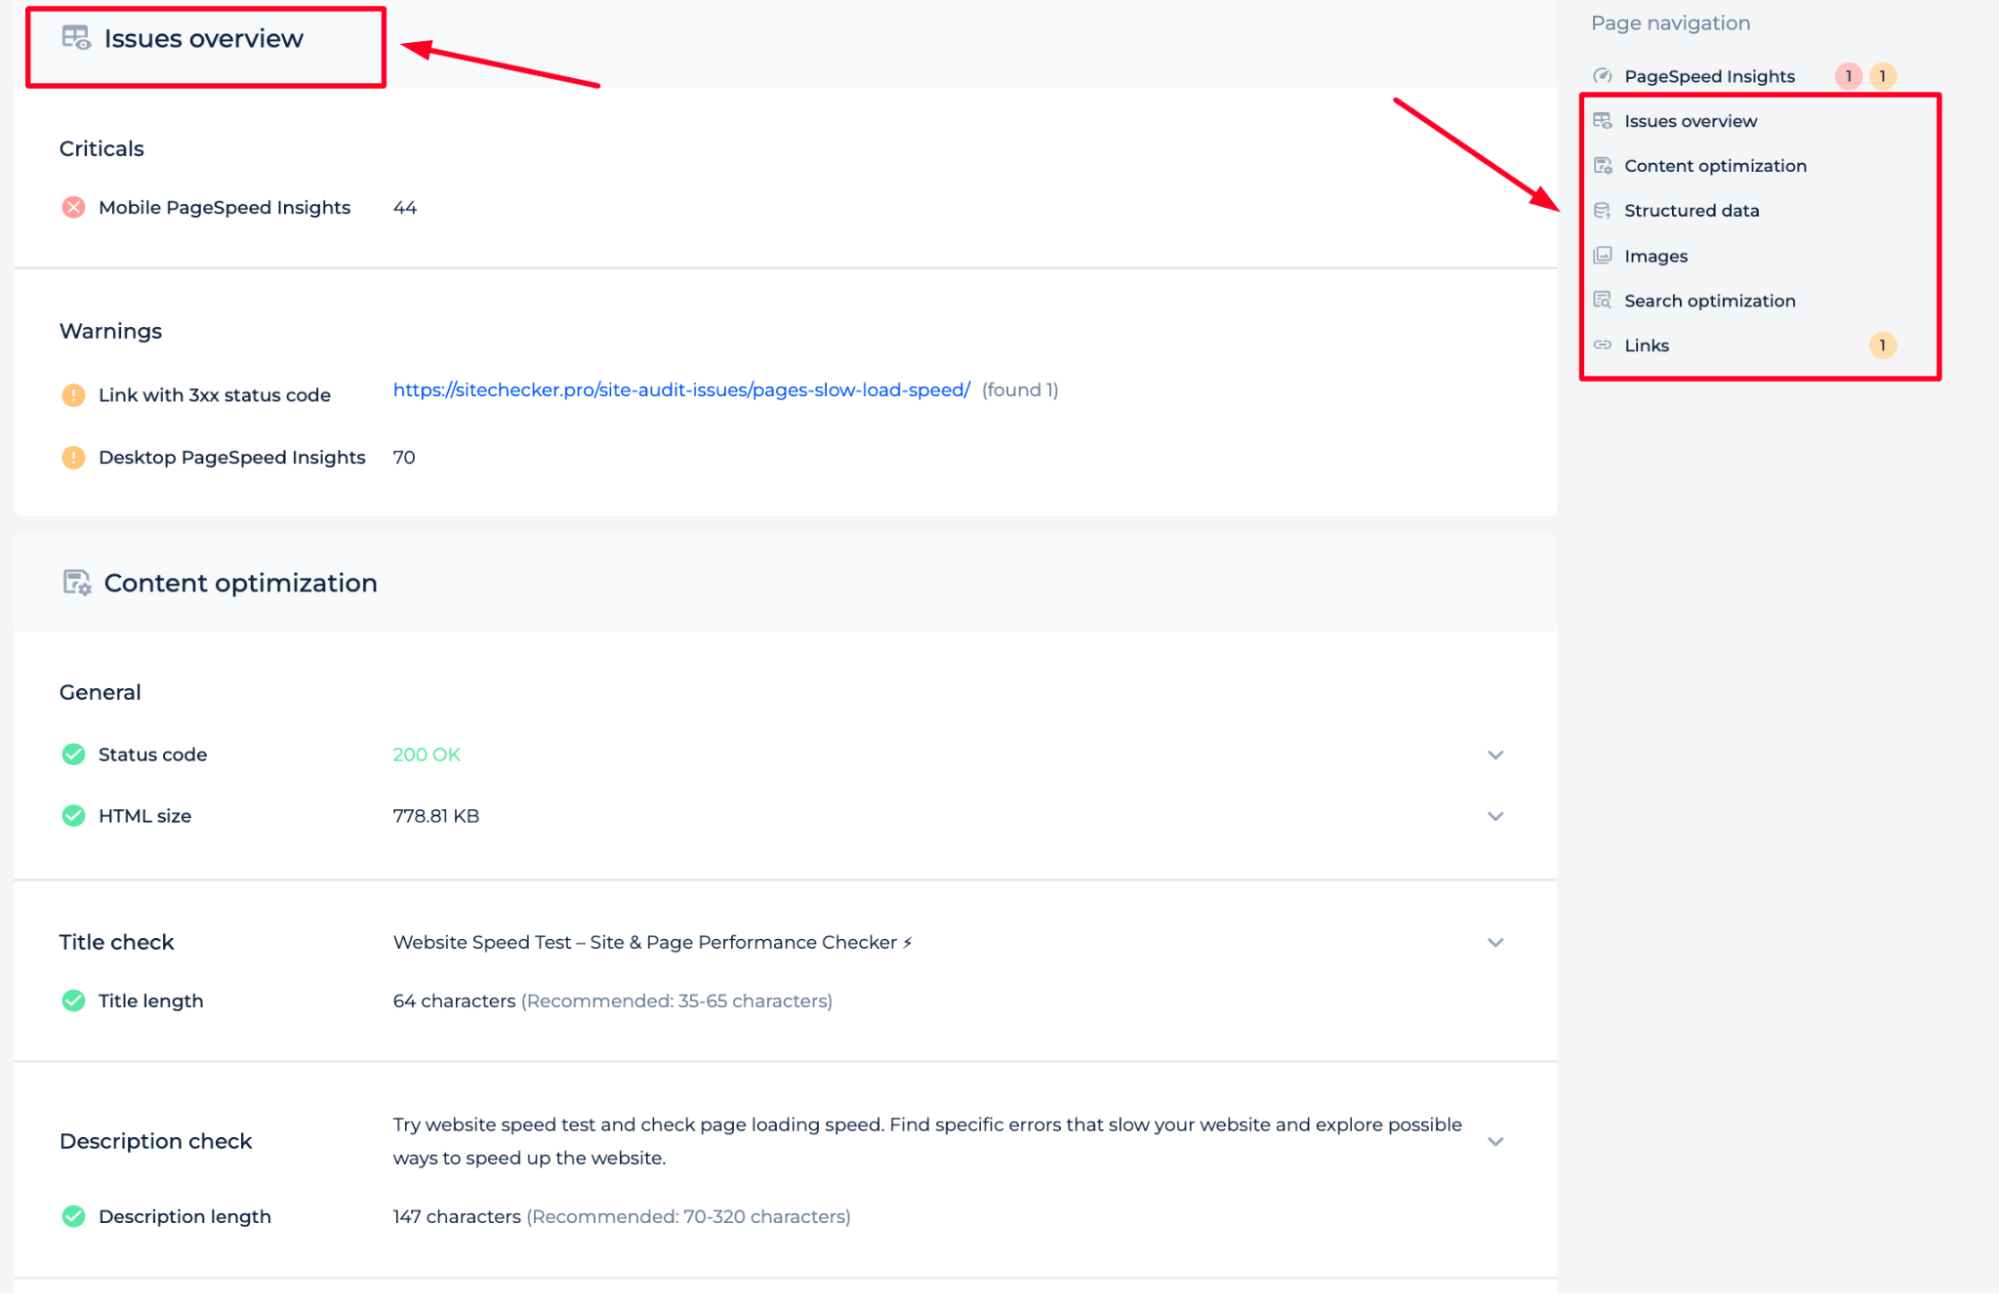
The Website Speed Test tool offers an invaluable deep dive into your website’s performance metrics, ensuring optimal user experience and SEO ranking. A site’s load time can significantly impact user retention and conversion rates; this tool seamlessly evaluates that, giving you a comprehensive view of what’s working and where improvements are needed.

website speed test tool

Beyond basic speed diagnostics, the tool provides insights into server response time, content optimization opportunities, and ways to enhance render times. Its ability to break down the data into actionable insights—like offering image compression solutions or identifying scripts slowing down a page—truly sets it apart, making it a must-have for website owners aiming for digital excellence.

Unlock Peak Website Performance!

Discover what's holding you back and optimize for the best user experience.

Something went wrong. Please, try again later.

Conclusion

Web performance, especially as encapsulated by Core Web Vitals, is at the forefront of providing users with a seamless and enjoyable browsing experience. As the web grows and evolves, tools like the Chrome User Experience Report (CrUX) become indispensable for webmasters aiming to keep a finger on the pulse of real-world user experiences.

But beyond tools and data, the commitment to understanding and prioritizing user experience is what will truly make a website stand out. As technologies and metrics evolve, this core principle remains unchanged: a fast, responsive, and stable site is key to user satisfaction.

FAQ
CrUX provides real-world user experience data from Chrome users, while lab testing tools simulate website performance in controlled environments.
CrUX only includes data from users who have opted-in to Chrome's syncing feature without a passphrase, ensuring user consent.
No, Lighthouse offers lab data, simulating website performance under predefined conditions.
Smaller sites might find limited data in CrUX due to their traffic. They might need to rely more on lab data and direct user feedback initially.
Implement the Web Vitals JavaScript library. It can be integrated with your analytics solution to capture real-time data from actual users.
Websites with limited traffic or newer domains might not have comprehensive data in CrUX until they accumulate more user interactions.
Employ feedback widgets or pop-ups on your site to solicit direct comments from users regarding performance or usability issues.
Fast Links

You may also like

View More Posts
What Does HTML Stand for? How Does It Work?
SEO Basics
What Does HTML Stand for? How Does It Work?
Ivan Palii
Oct 31, 2023
What are Sponsored Links?
SEO Basics
What are Sponsored Links?
Ivan Palii
Jul 25, 2023
How to Conduct SEO Content Analysis Properly?
SEO Basics
How to Conduct SEO Content Analysis Properly?
Ivan Palii
Jan 31, 2024
close