

This guide provides step-by-step instructions on how to use my free Google Search Console Looker Studio template, which includes two pages:
- Scattered charts for search queries (keywords);
- Scattered charts for landing pages.
Scattered charts allow you to segment keywords or landing pages effectively, providing a clear visual representation that simplifies analysis and decision-making.
Here is the link to the template >>
How to use this free Search Console template for keyword research
All scattered charts in this template are organized into four key sections.
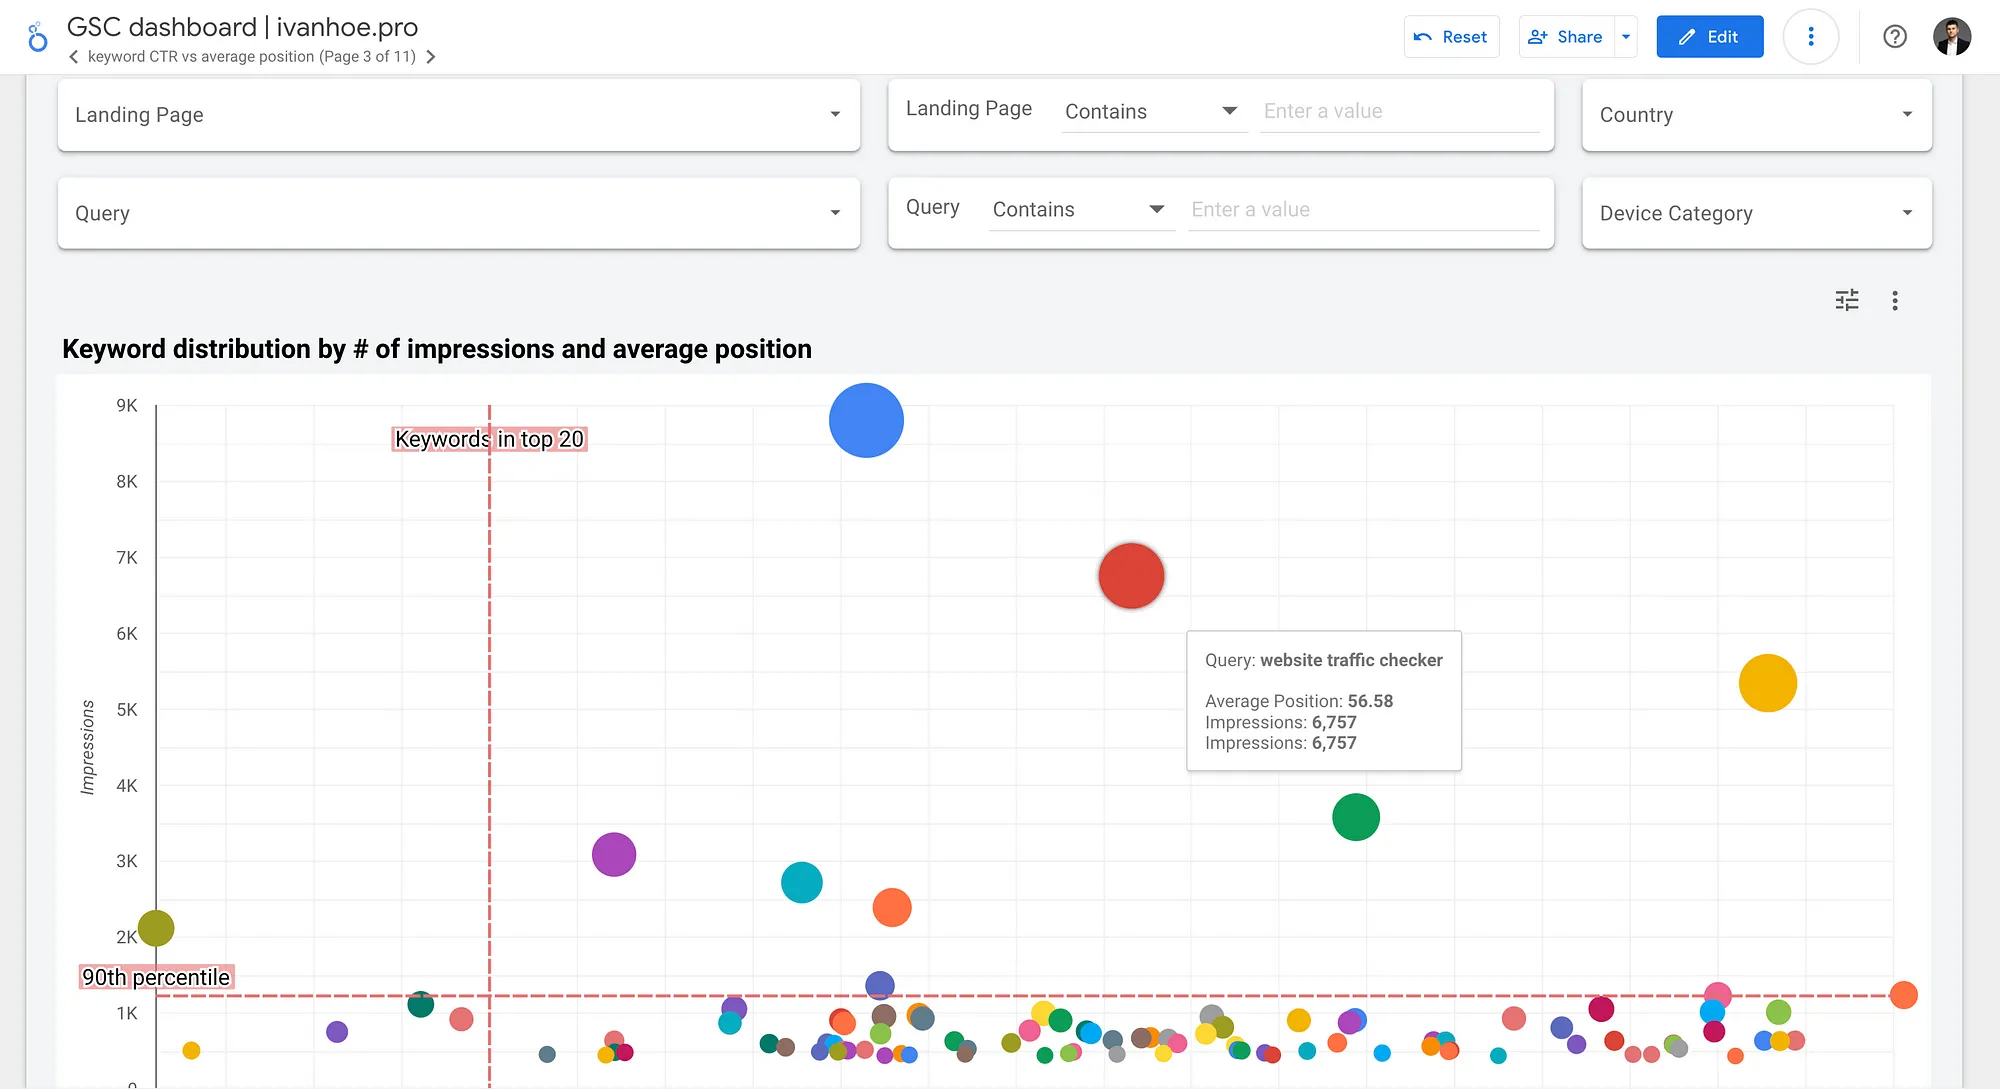
1. Prioritize keywords by value (Impressions) and ranking potential (Average Position)
Focusing on keywords with high impressions and strong rankings has the greatest impact on your search traffic. By improving positions for these high-visibility keywords, you can maximize organic reach and clicks.
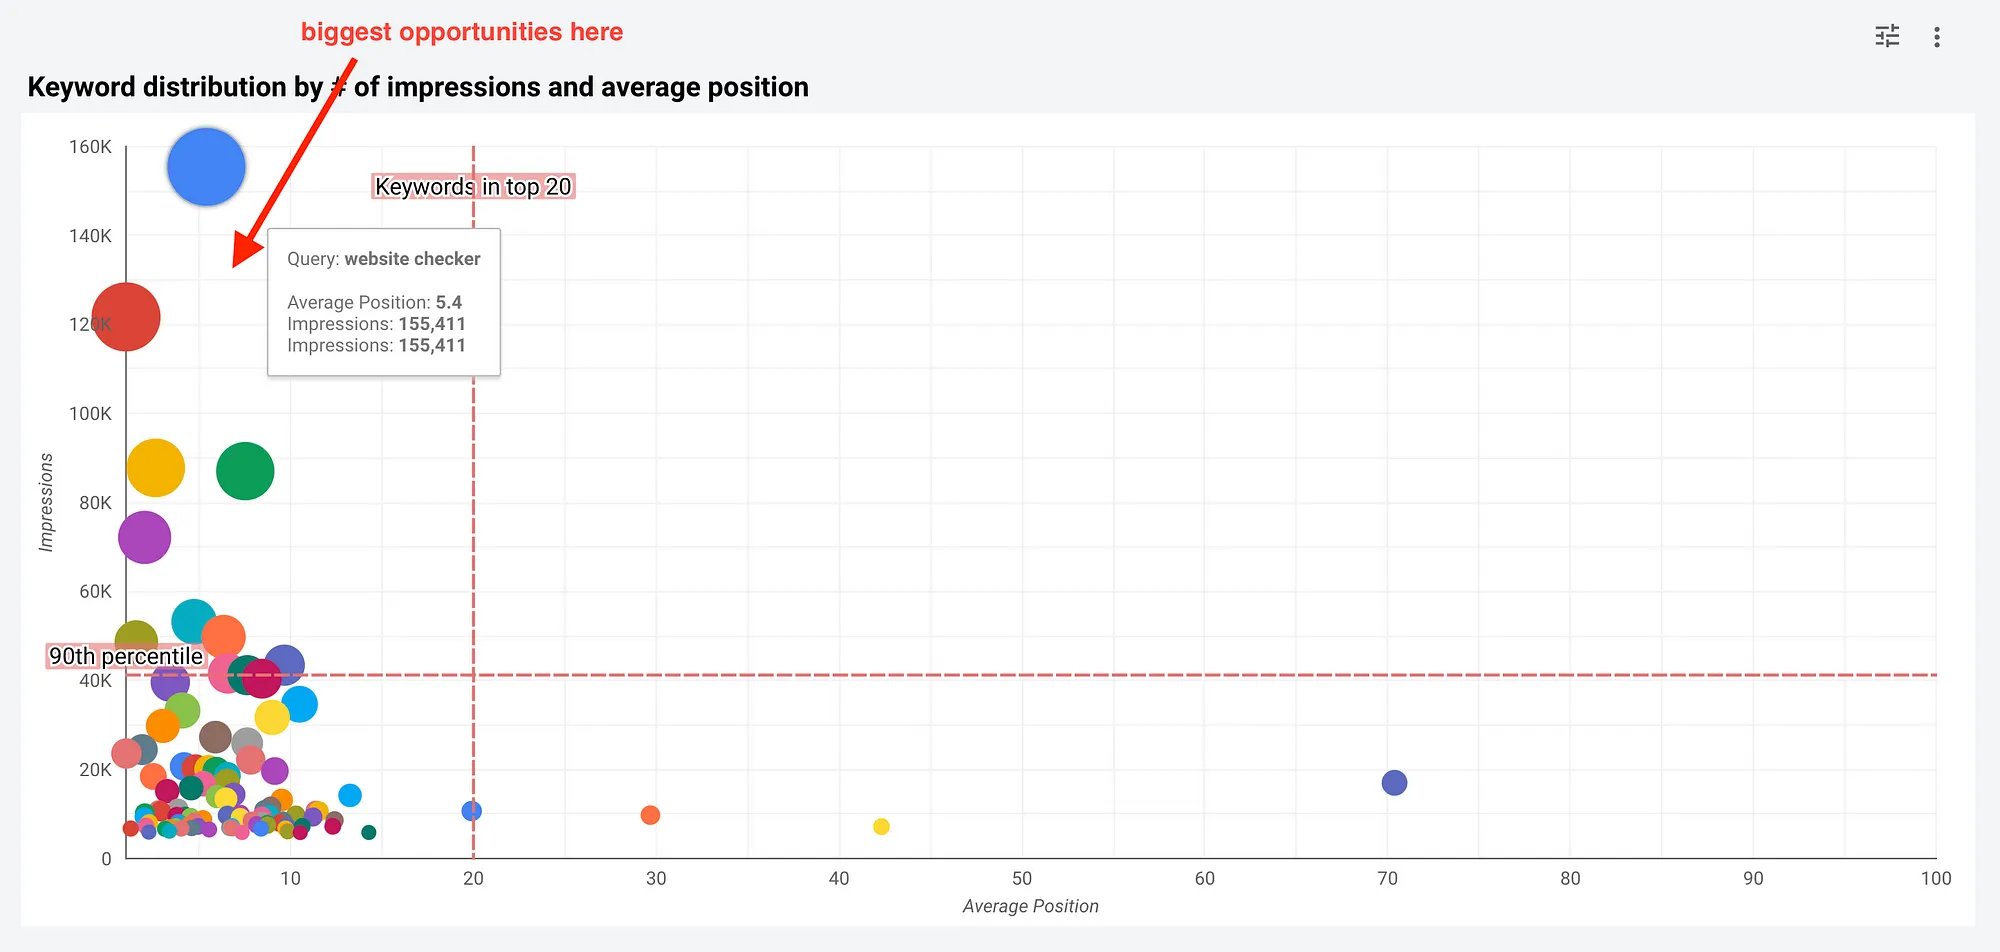
However, keep in mind that the keywords with the highest opportunity often include informational queries or broad topics with low conversion potential.
For this reason, these keywords are best used to generate long-tail search suggestions for new landing pages that can drive more targeted traffic.
2. Prioritize keywords based on landing page snippet performance (URL CTR) and difficulty level of getting clicks (Average Position)
This section categorizes keywords into four groups based on their click-through rate (CTR) and ranking position. Two of these groups are straightforward:
- Keywords with a high average position and high CTR – These are performing well and require minimal optimization.
- Keywords with a low average position and low CTR – These may need improvements in ranking and snippet optimization.
However, the remaining two groups are less obvious and require closer attention.
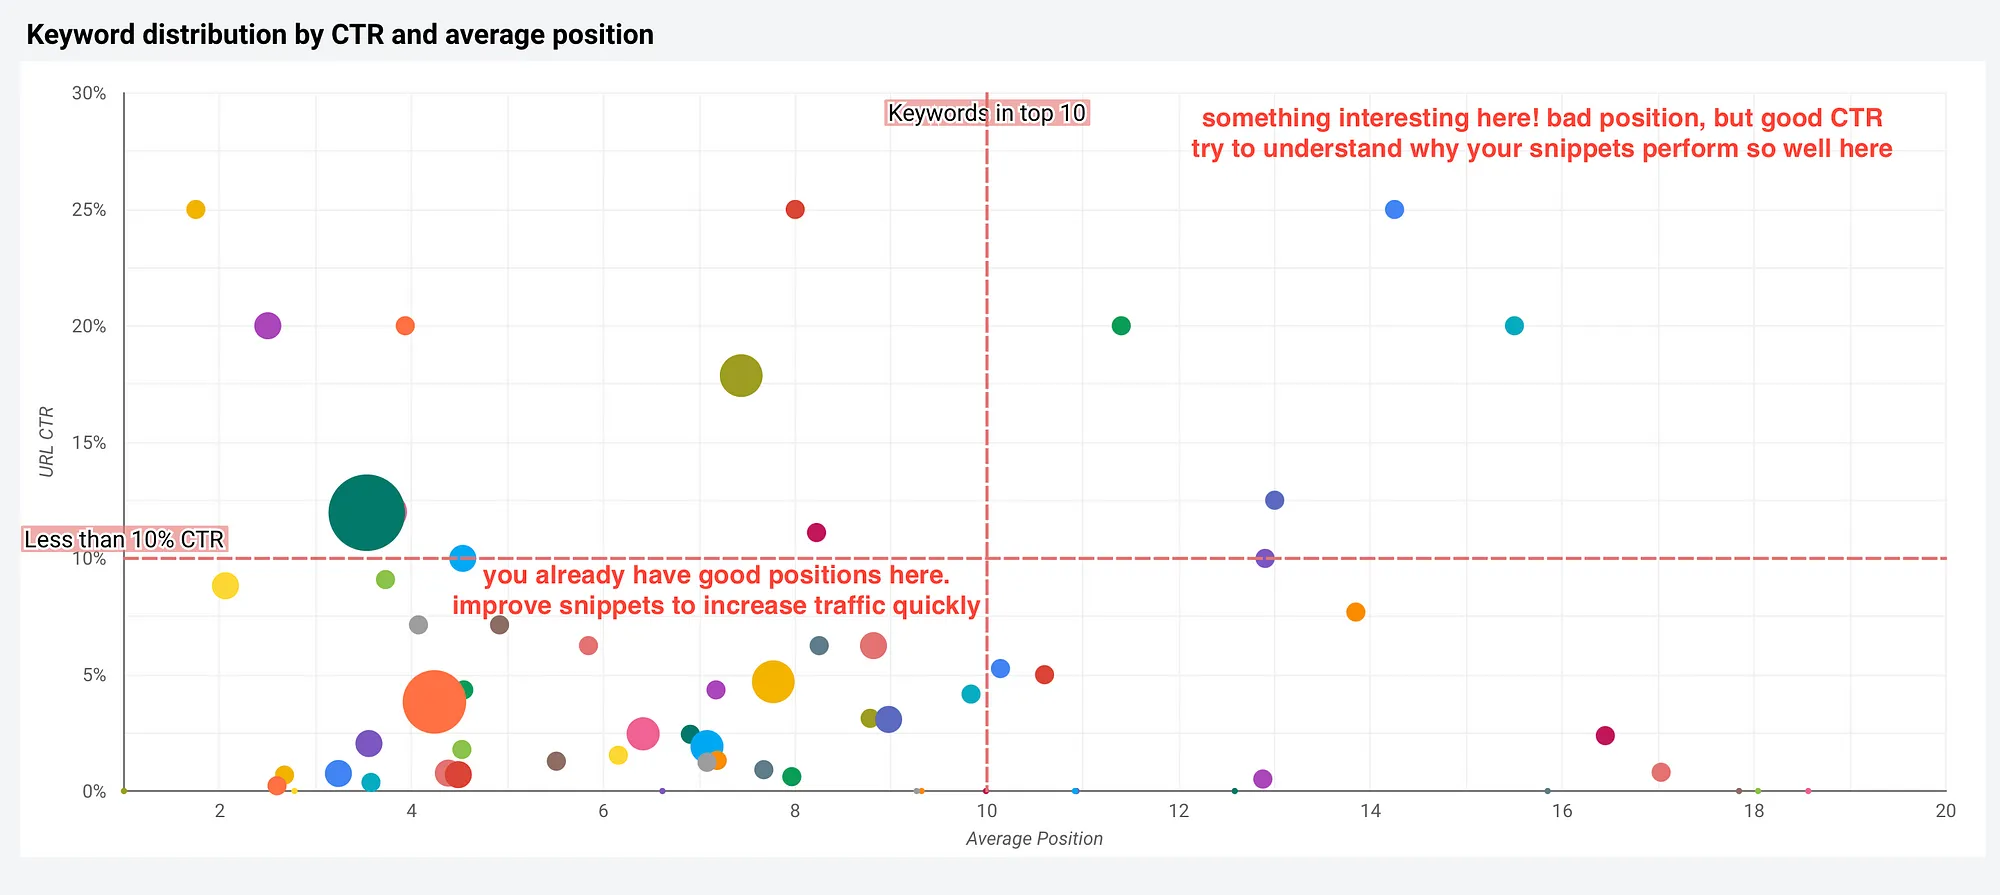
If a keyword has a high CTR but ranks poorly, it indicates that the page snippet is performing exceptionally well. Analyzing this can help uncover what makes it compelling and apply those insights to other pages.
On the other hand, if a keyword has a strong ranking but a low CTR, valuable opportunities are being missed.
Sometimes, this happens due to a high number of featured snippets or Google Ads in the search results. However, in many cases, optimizing the page’s snippet—such as refining title tags, meta descriptions, or structured data—can significantly improve CTR.
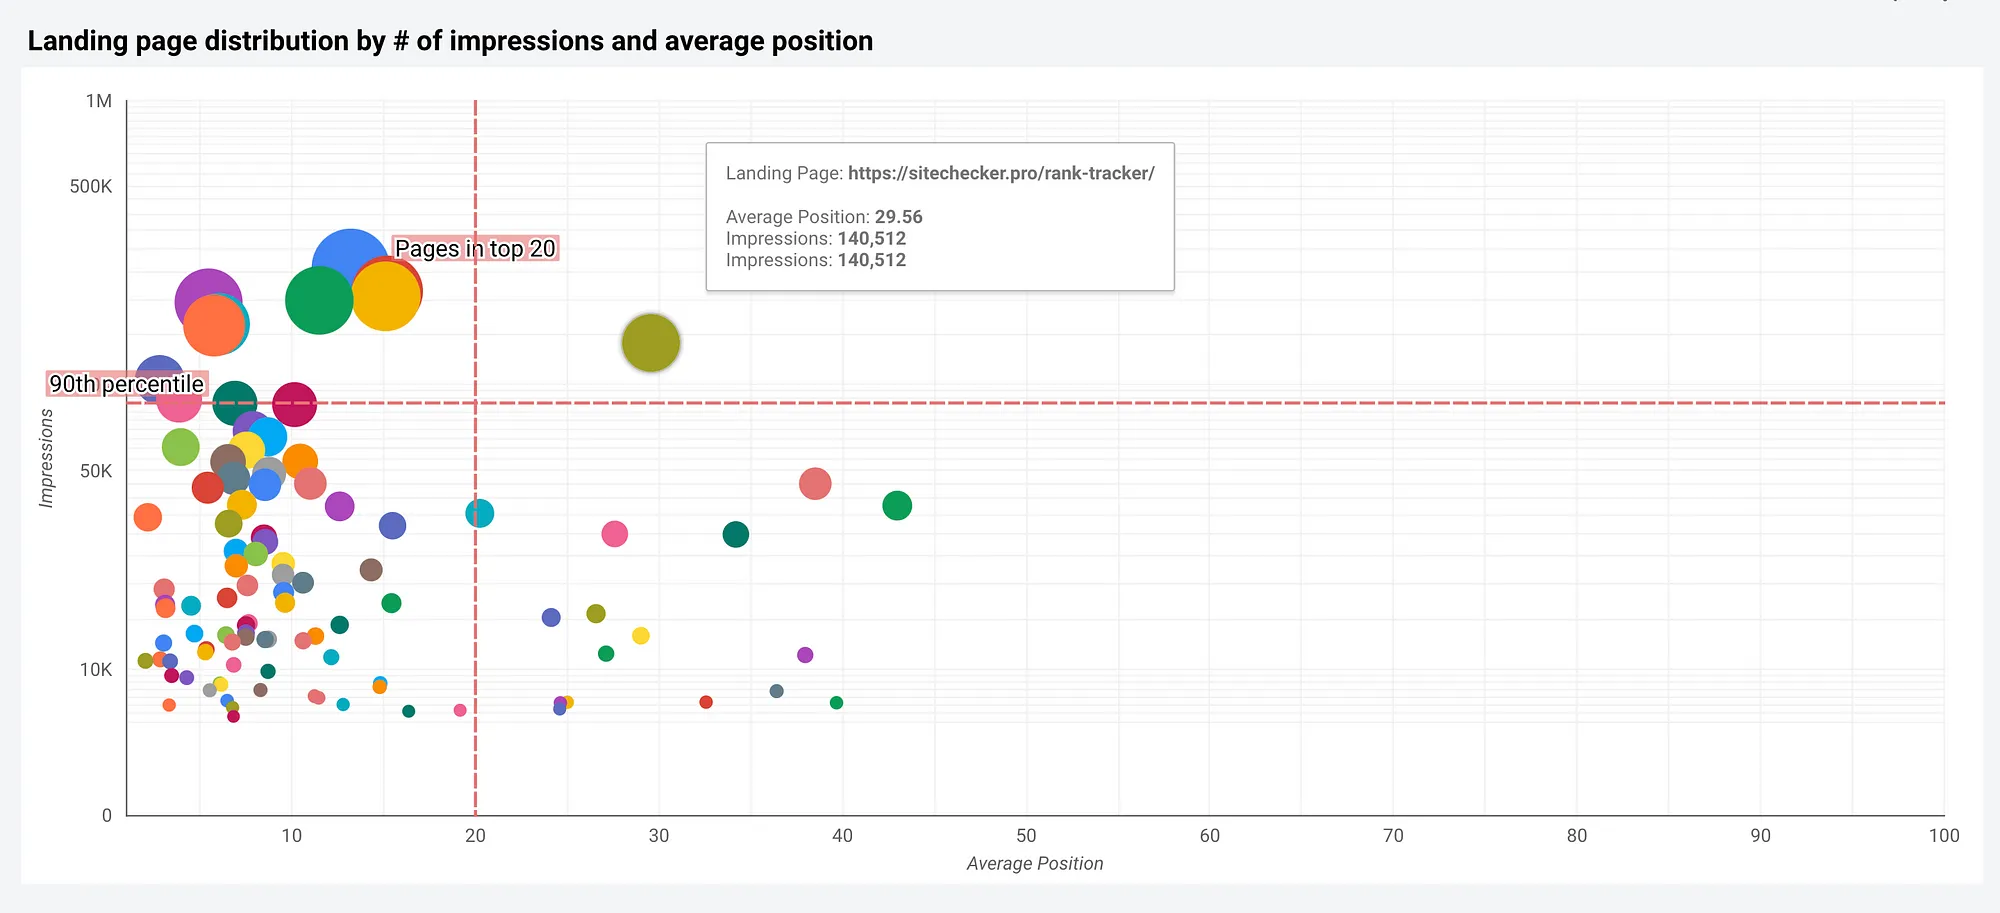
3. Prioritize landing pages by value (Impressions) and ranking potential (Average Position)
This section follows the same approach as keyword prioritization but focuses on landing pages. By identifying high-impression pages with ranking potential, you can optimize them to drive more traffic.
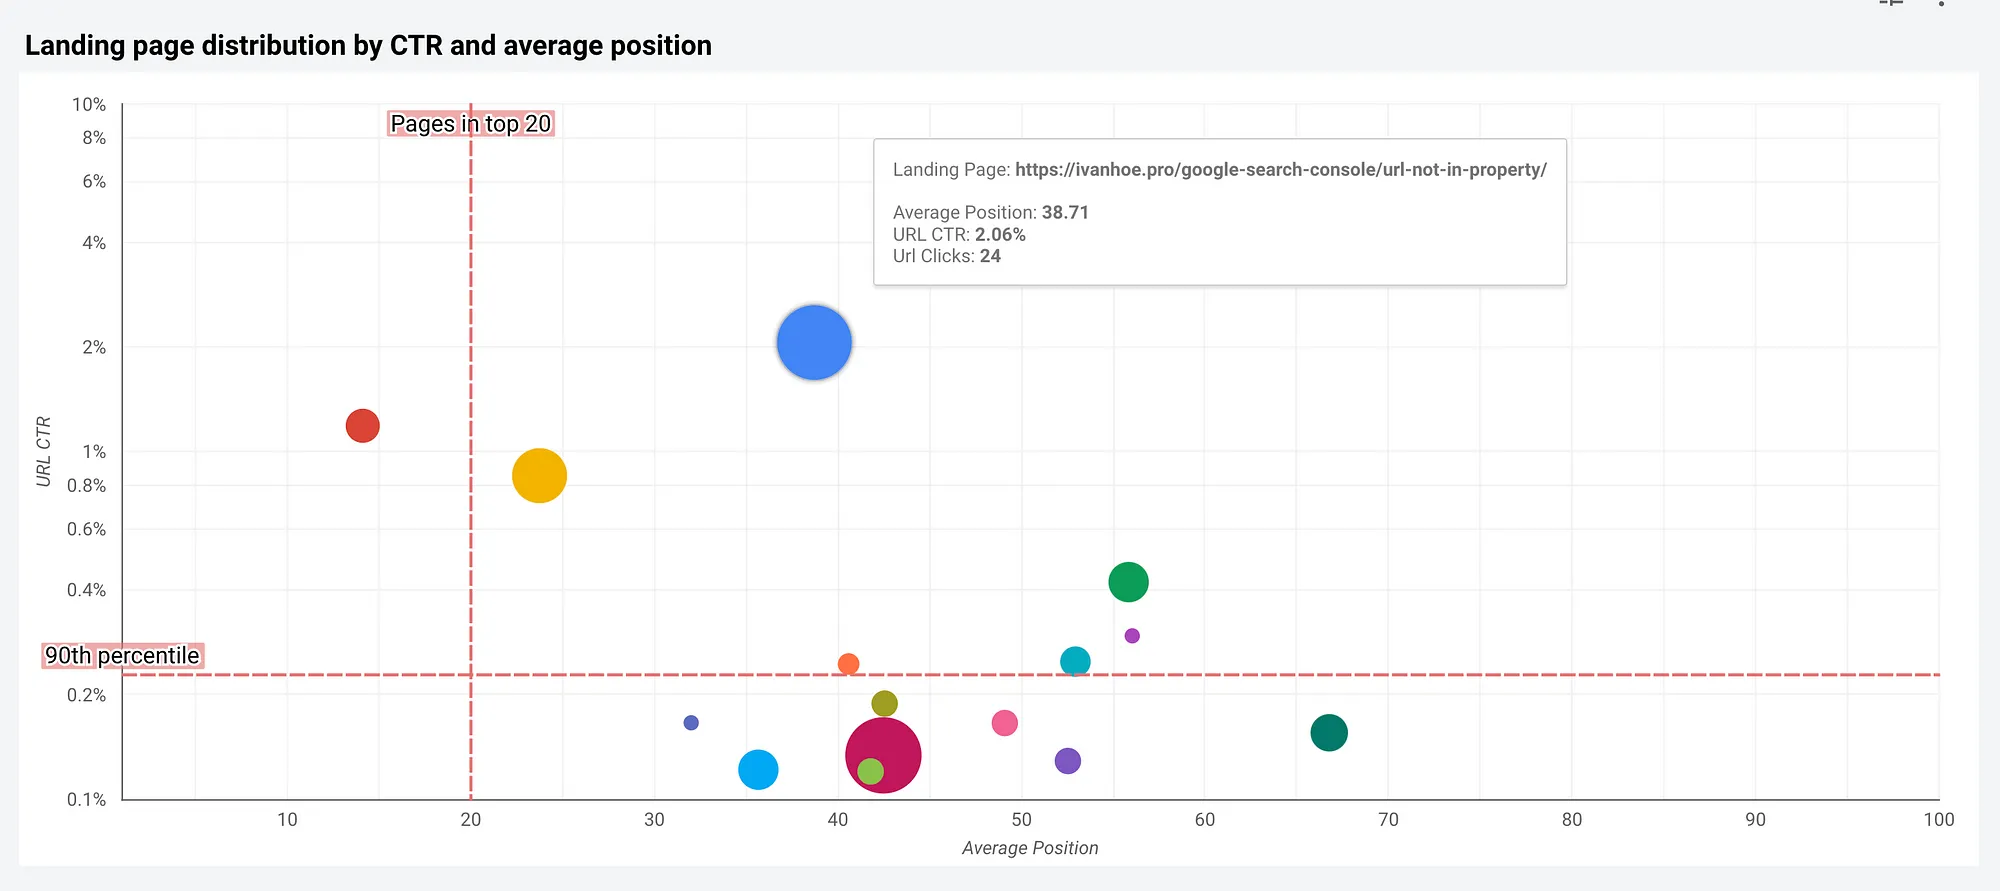
4. Prioritize landing pages based on snippet performance (URL CTR) and difficulty level of getting clicks (Average Position)
This section mirrors the keyword analysis but applies it to landing pages.
Remember, that you can use filters by landing page and query.
How to copy the template?
Click “Make a Copy” to duplicate the template.
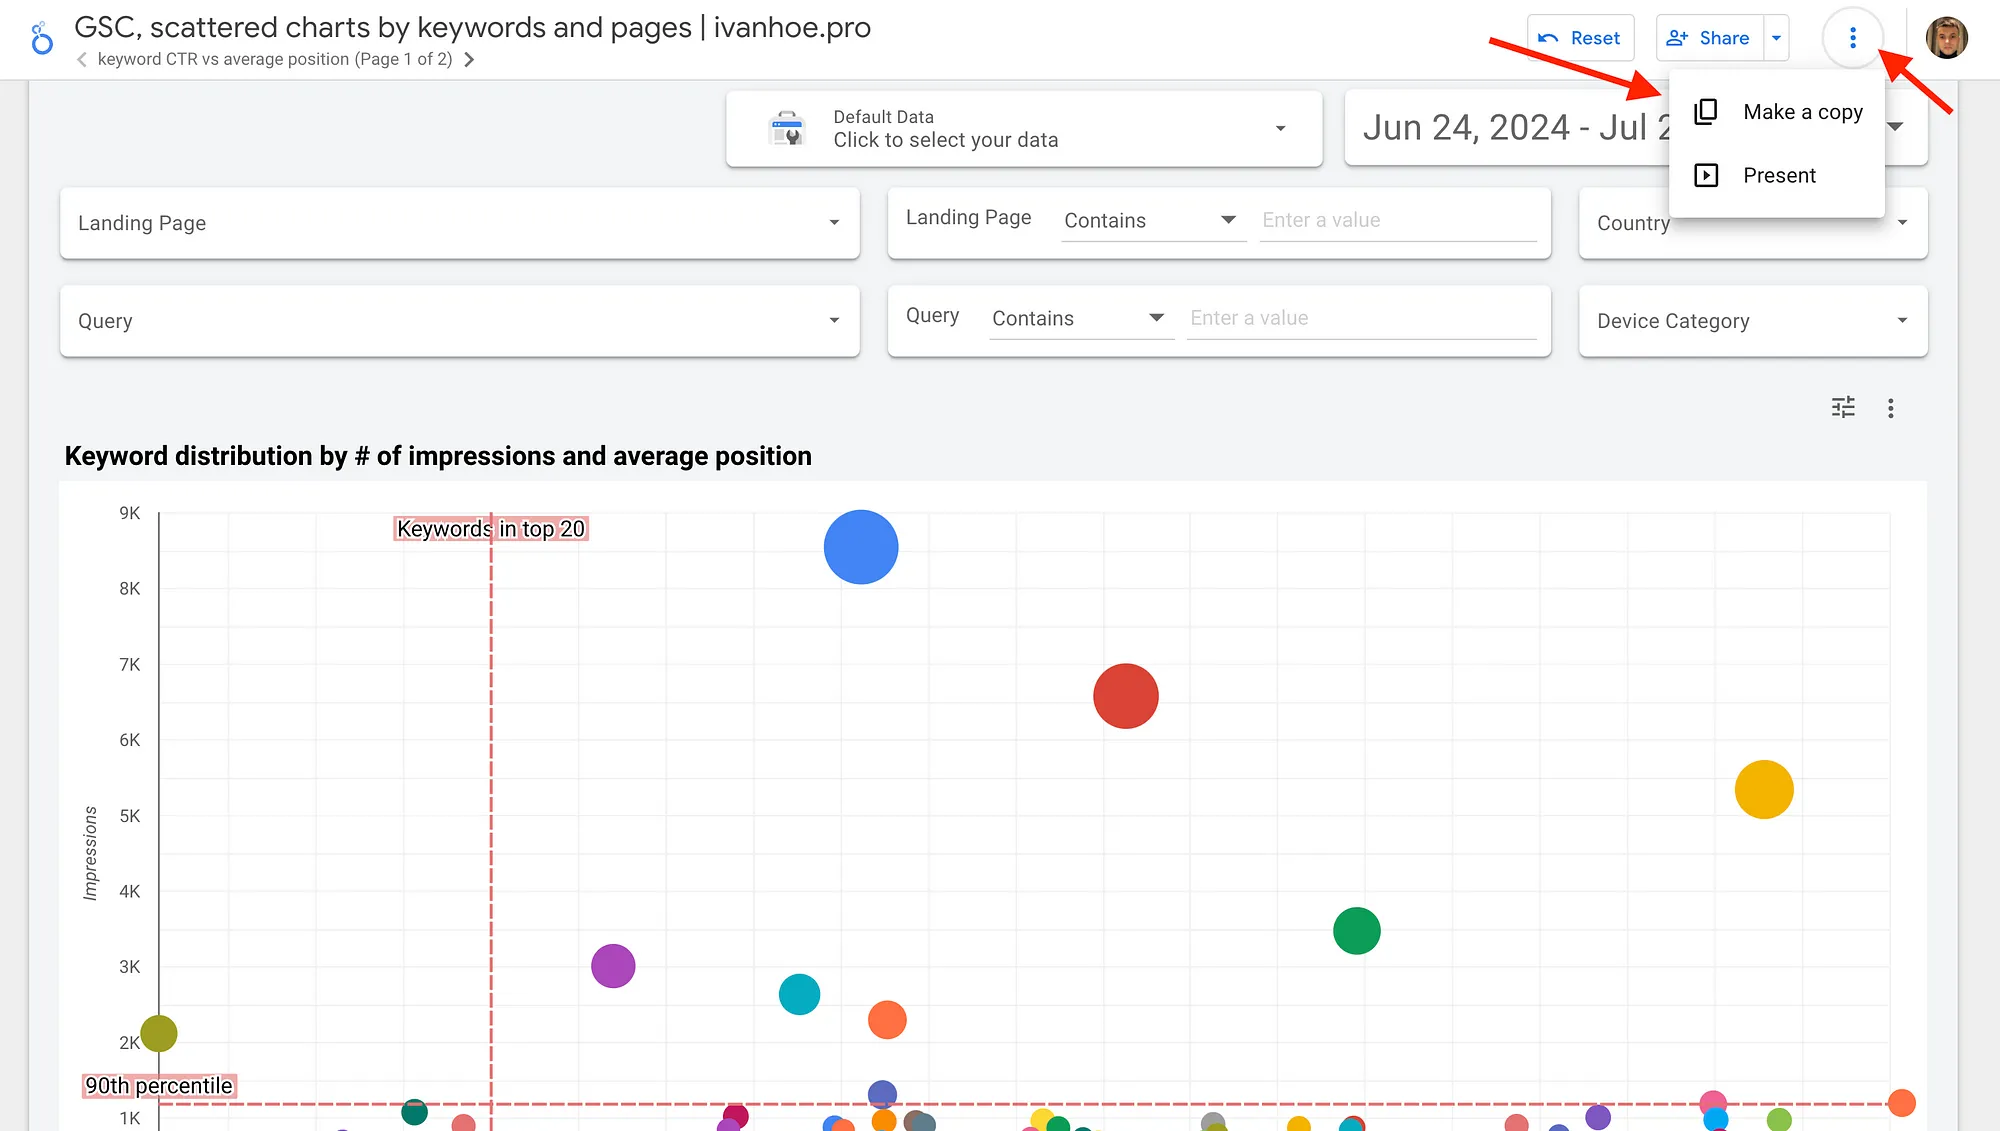
When prompted, add two Google Search Console datasets in the exact order shown in the screenshot:
- Site Impressions dataset
- URL Impressions dataset
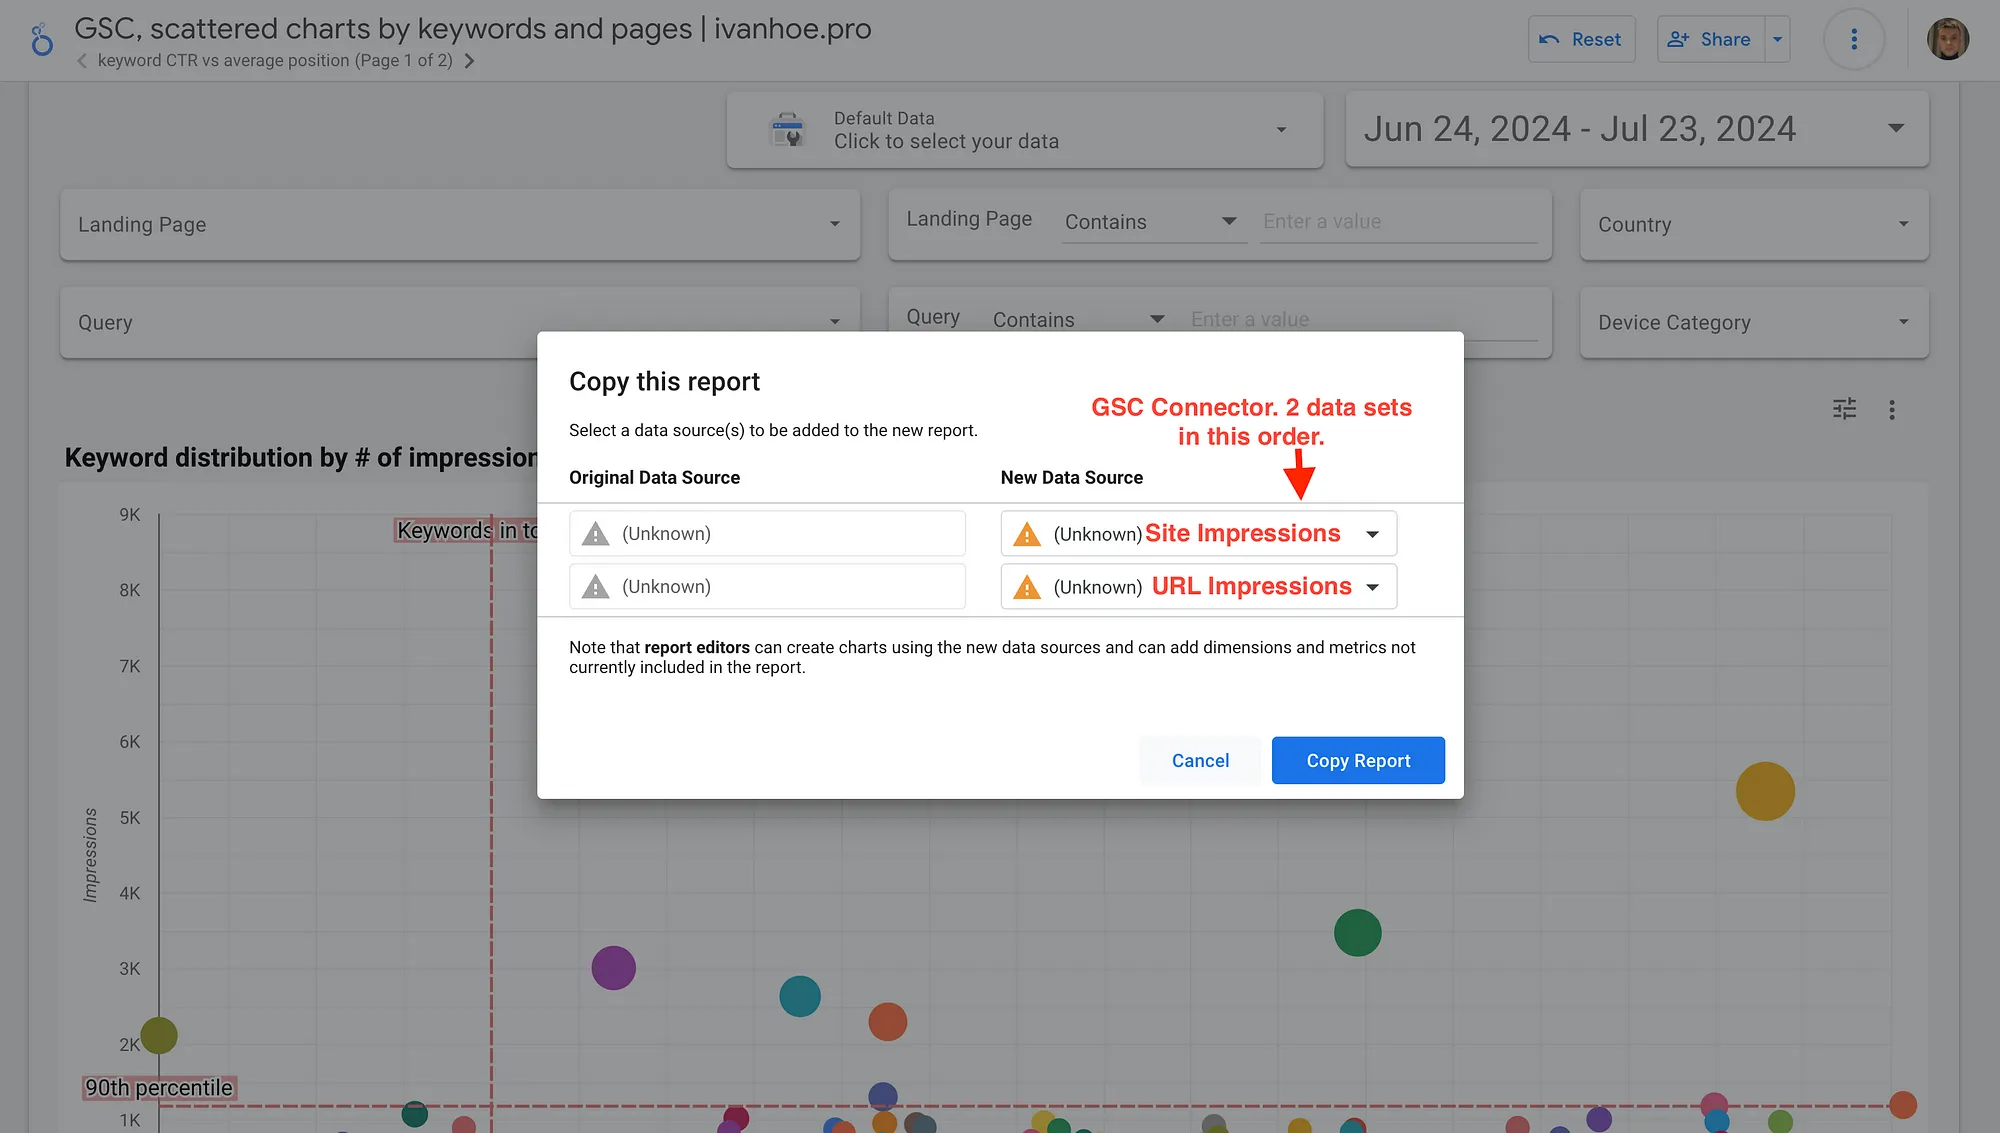
Following this order ensures that the data is displayed correctly within the dashboard.
How to customize the template for your needs?
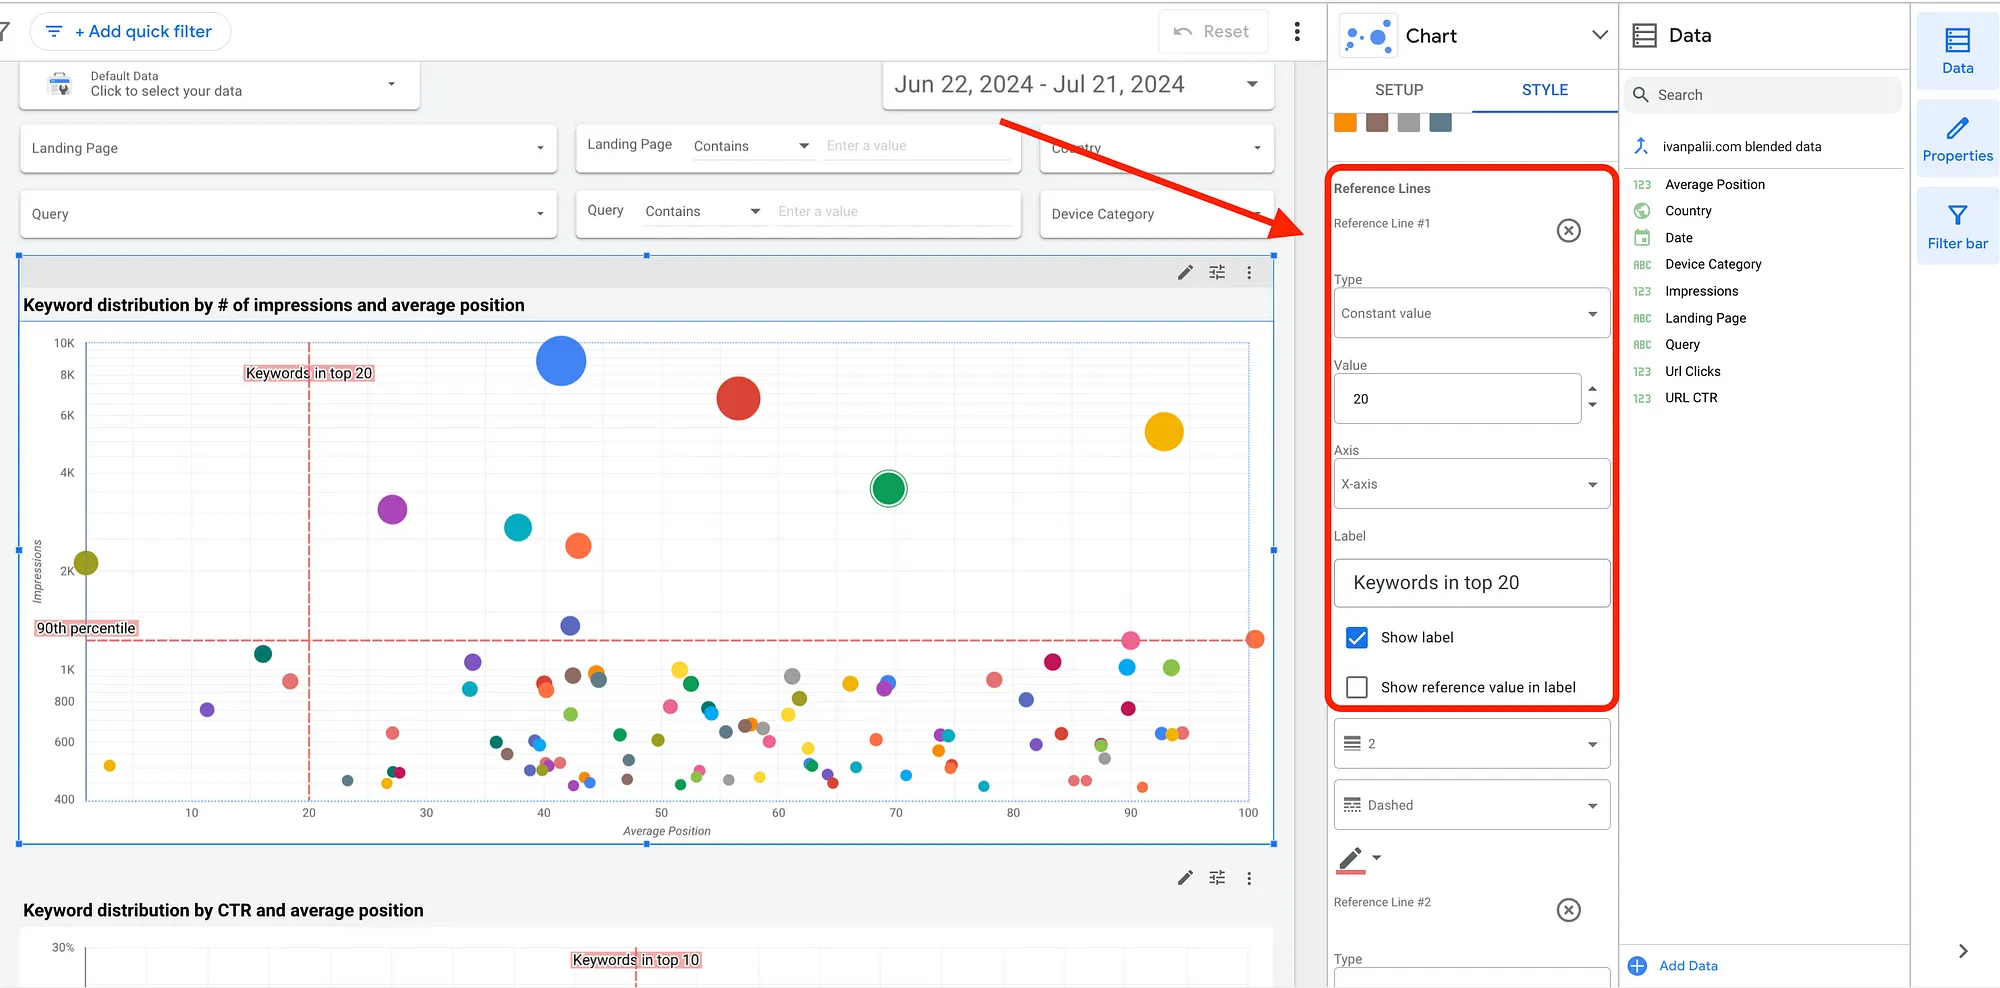
1. Adjust the reference lines on scattered charts
Modify these lines to set custom thresholds for impressions, positions, or CTR, helping you better identify high-priority keywords and pages.
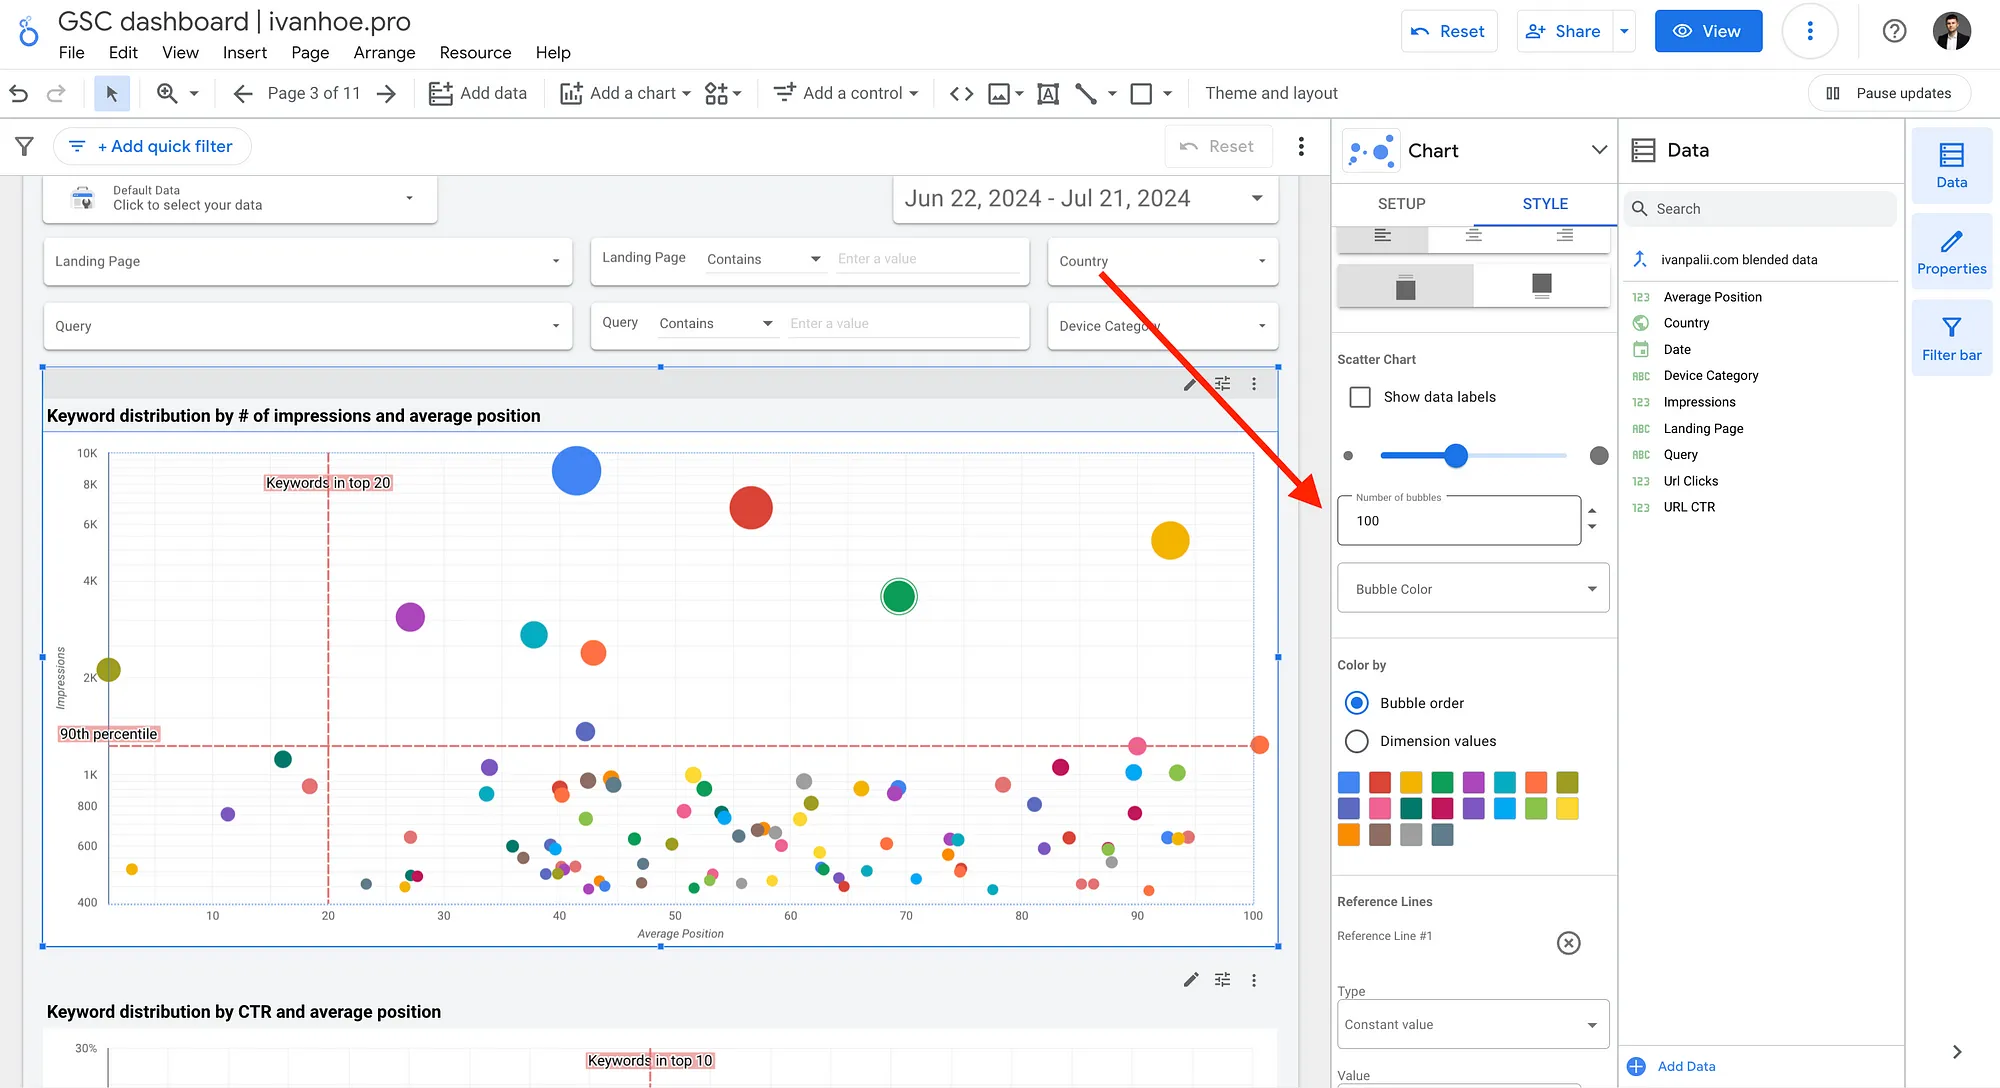
2. Control the number of bubbles displayed
Increase or decrease the number of data points shown on the charts to focus on the most relevant keywords and landing pages for analysis.
That’s it. Don’t miss my related templates and articles: