")


1. AI Traffic report
You can now track traffic coming from AI chats like ChatGPT, Perplexity, and Gemini right inside Sitechecker, powered by your GA4 data.
The AI Traffic report now gives you three ways to look at your data, each built around a different question.
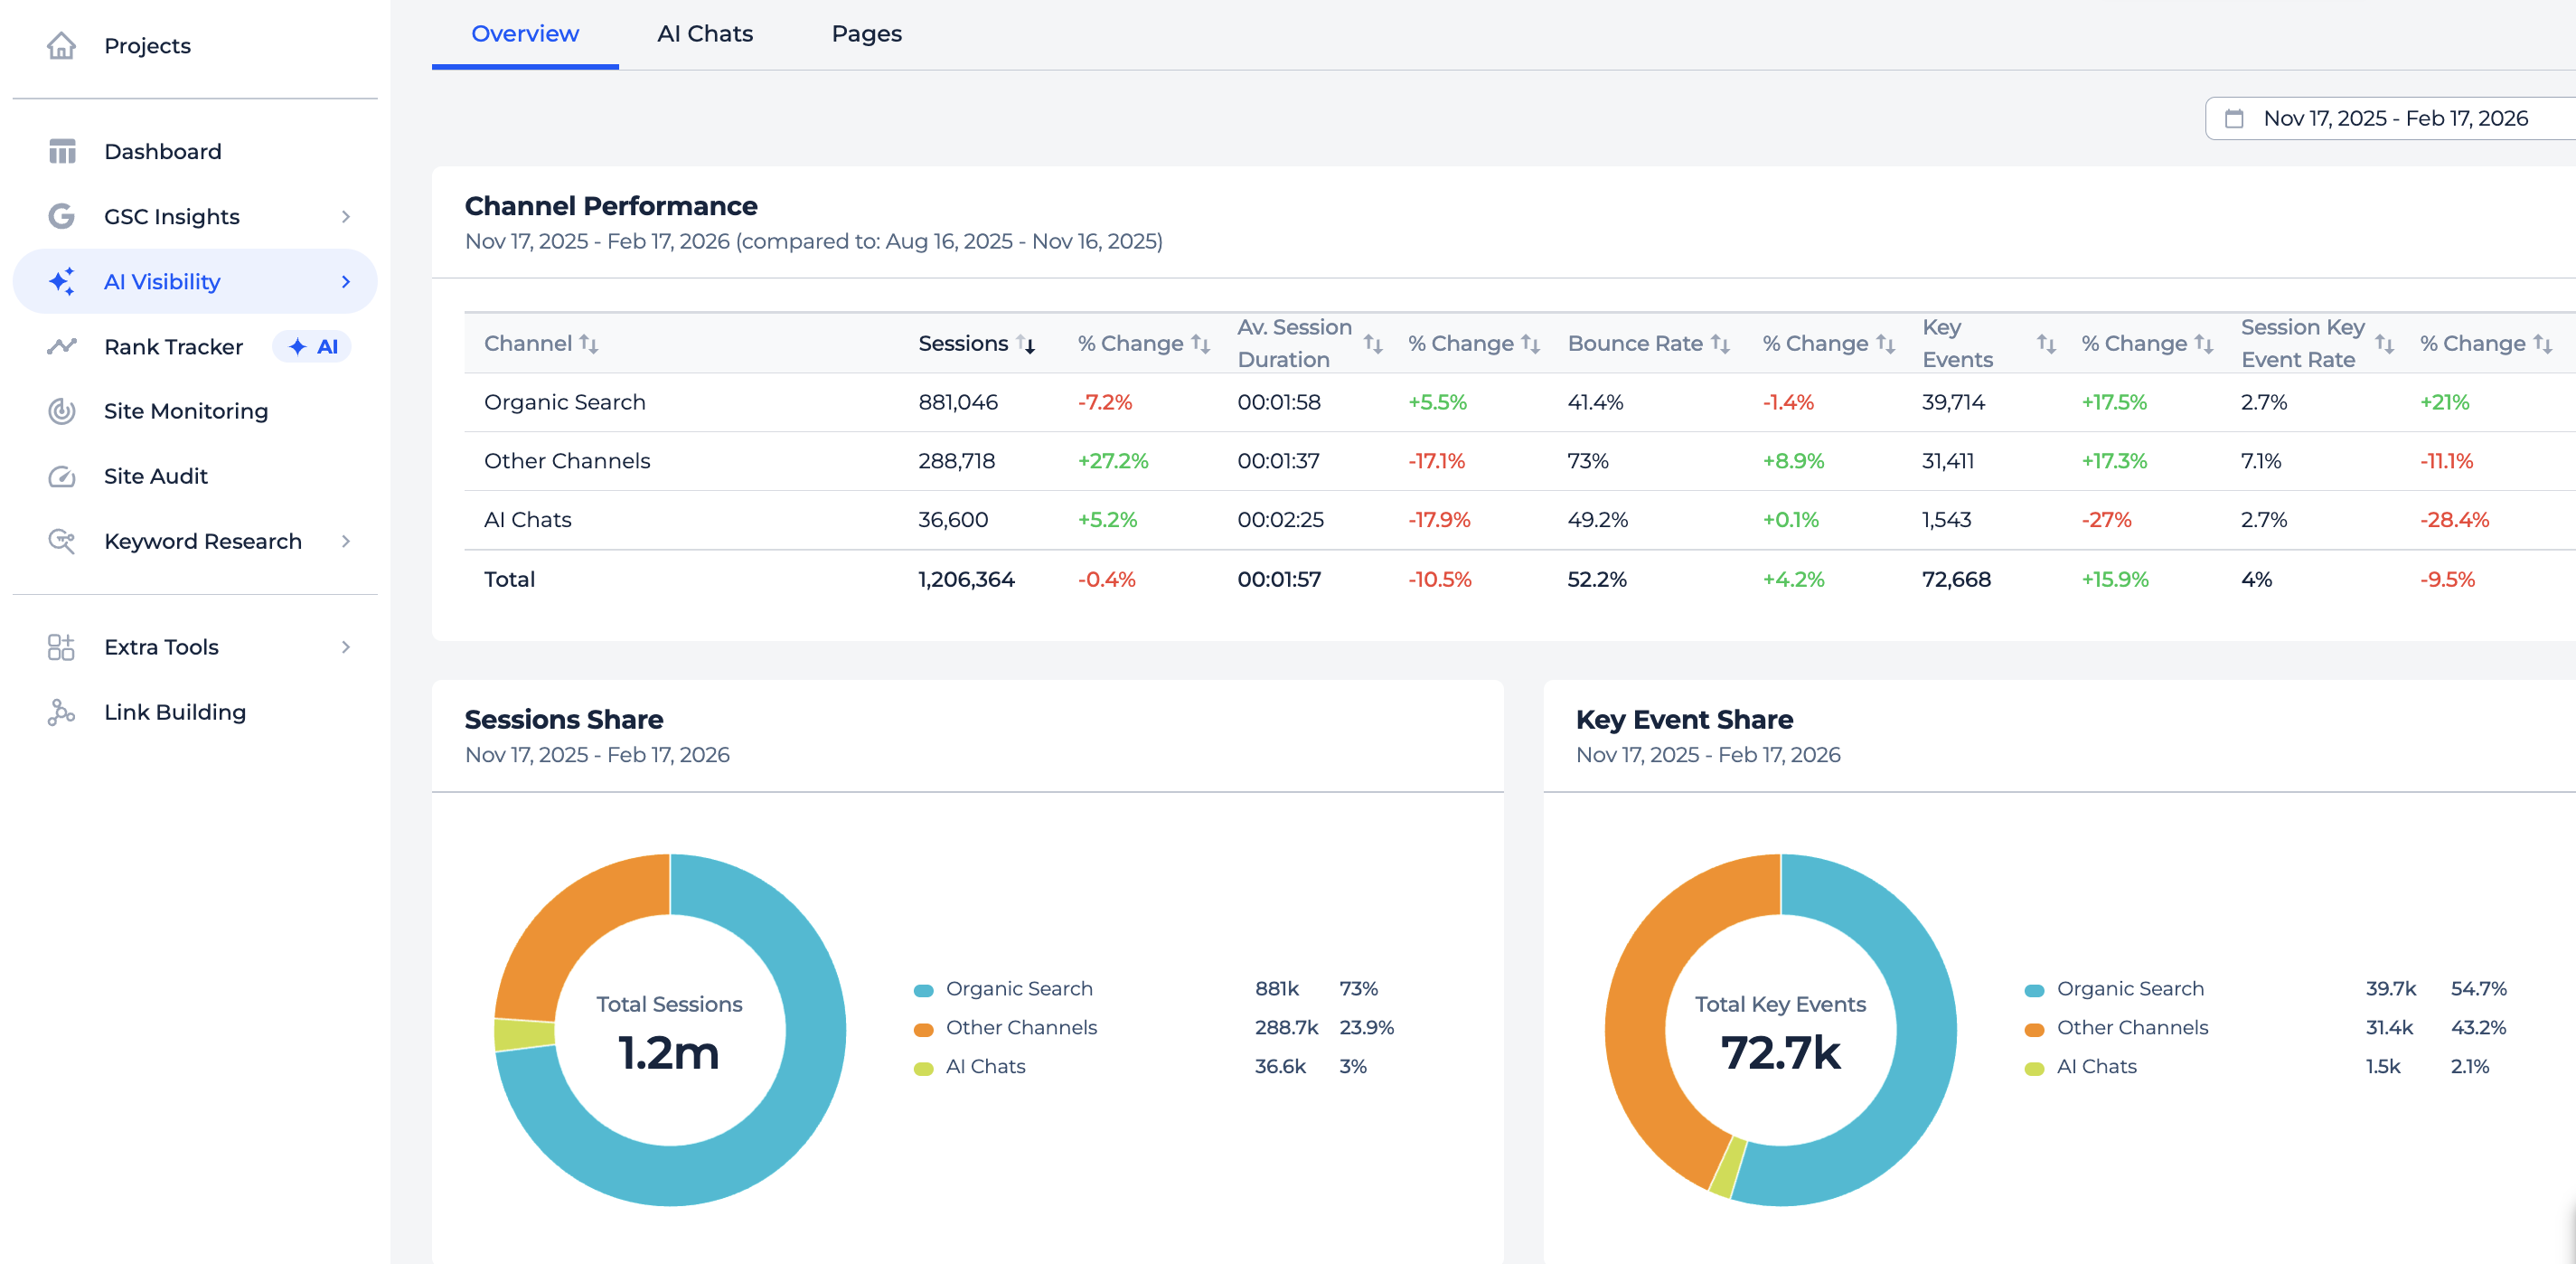
Overview
This report shows the big picture. You see how AI chat traffic stacks up against organic search and other channels, with session and key event shares visualized side by side.
Two comparison charts let you track AI chats against total traffic and against organic search over time.
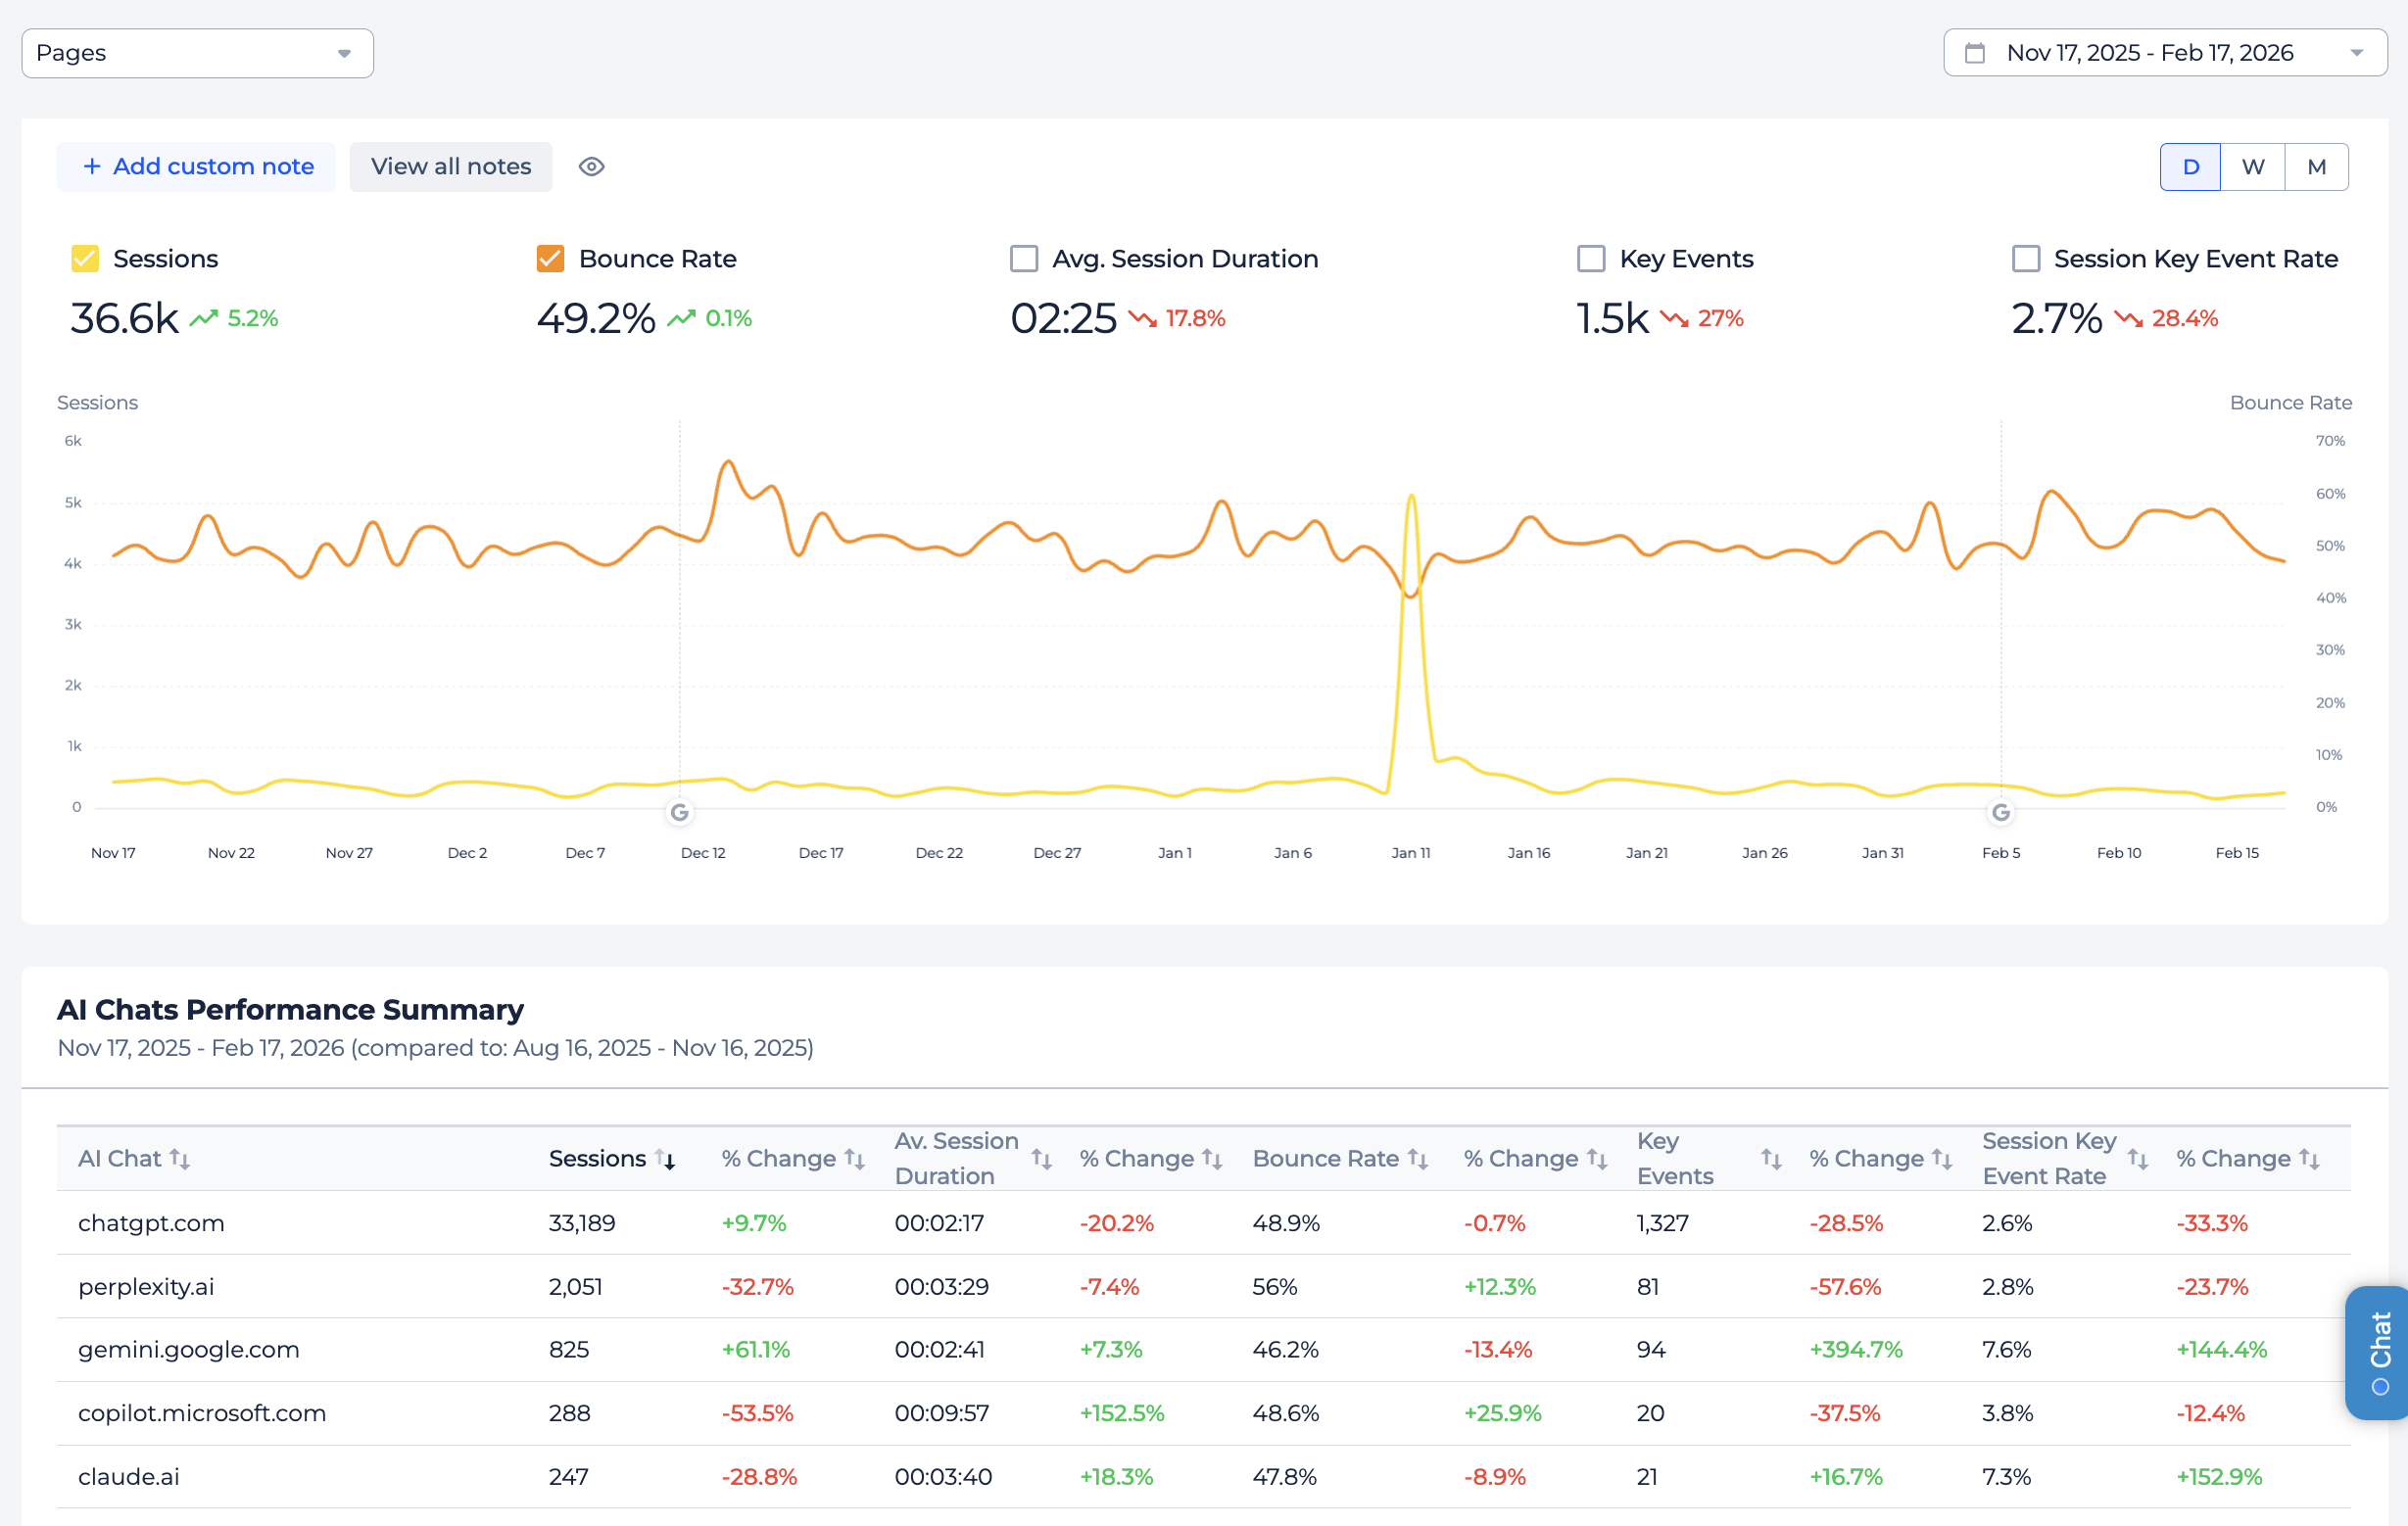
AI Chats
This one breaks things down by source. You get performance metrics for each LLM individually, whether that’s ChatGPT, Perplexity, Gemini, Copilot, Claude, or DeepSeek.
There’s also a dynamic chart showing how each source trends over your selected period, plus session and key event share breakdowns per chat.
You can filter by specific pages to see which content performs best within each AI source.
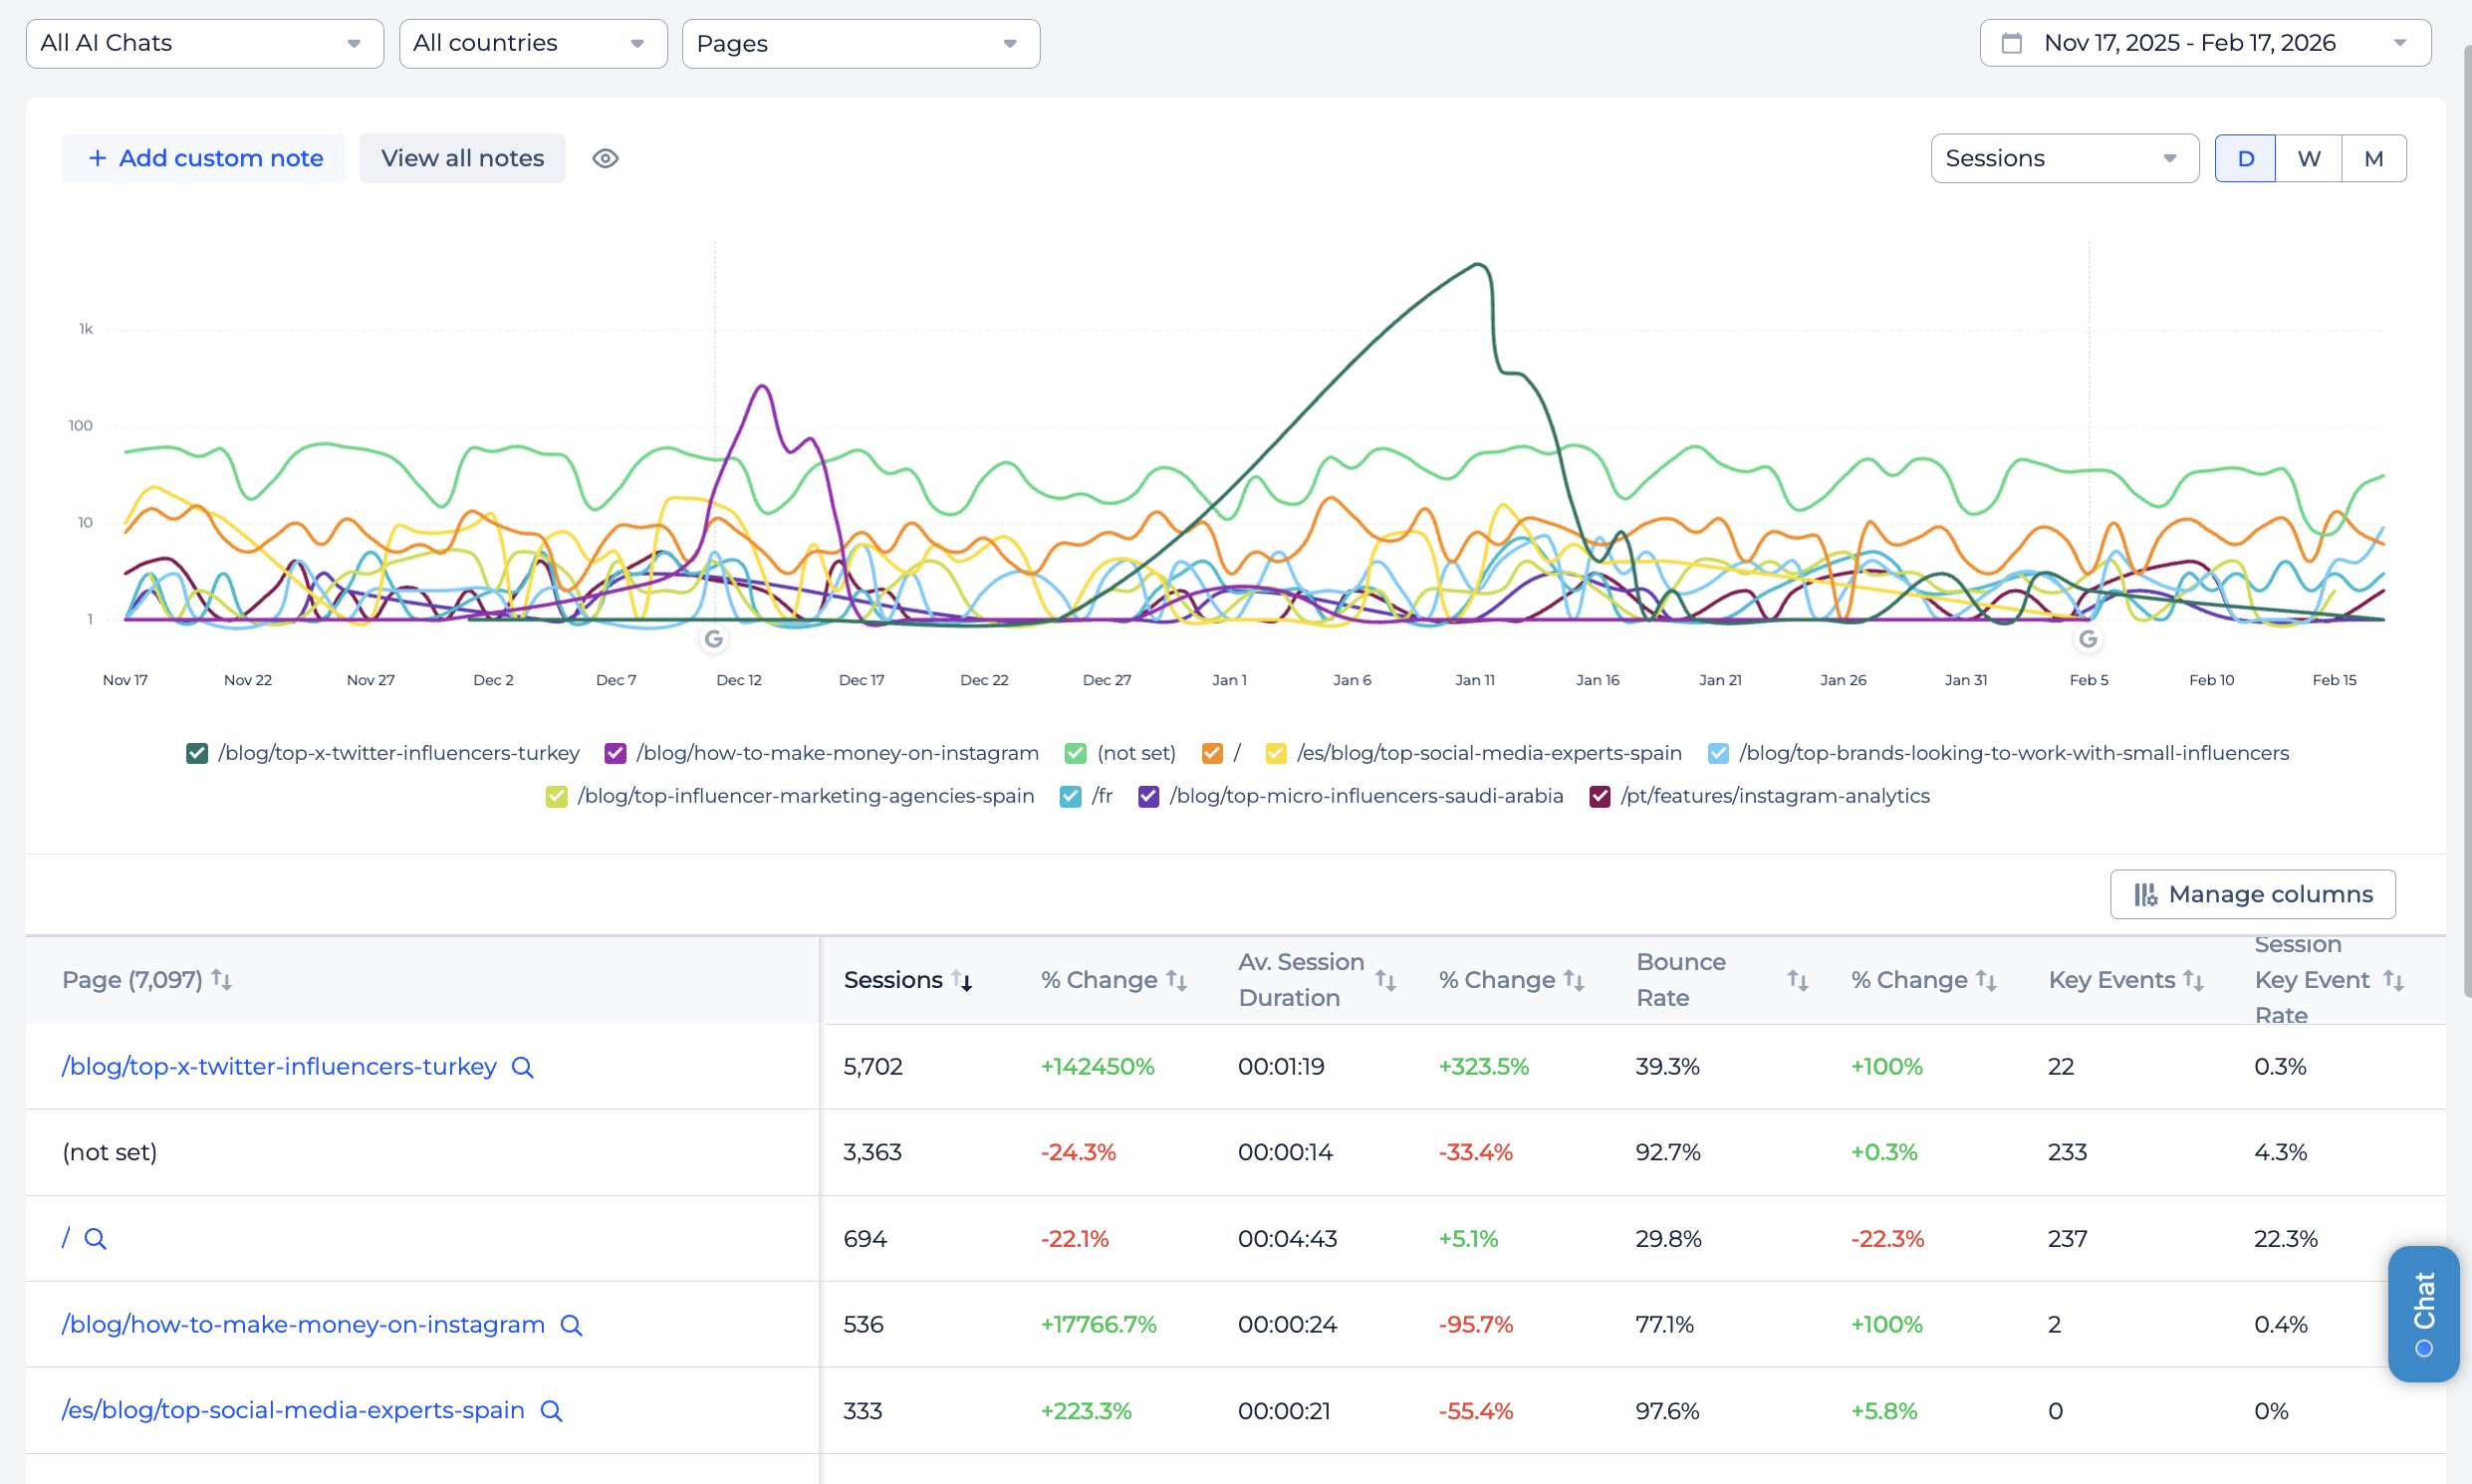
Pages
This tab shows which landing pages receive the most AI traffic.
A top-10 chart highlights your best-performing pages over time, and a full table lists every page that got at least one AI visit, with all the key metrics and period-over-period changes.
You can filter by specific AI chats to see which LLM sends traffic where.
You could build something similar in Looker Studio, but with Sitechecker you don’t need to reconfigure anything when switching between websites.
2. Google AI Overview
You can now see how your website performs in Google’s AI Overview results for the keywords you have in Rank Tracker.
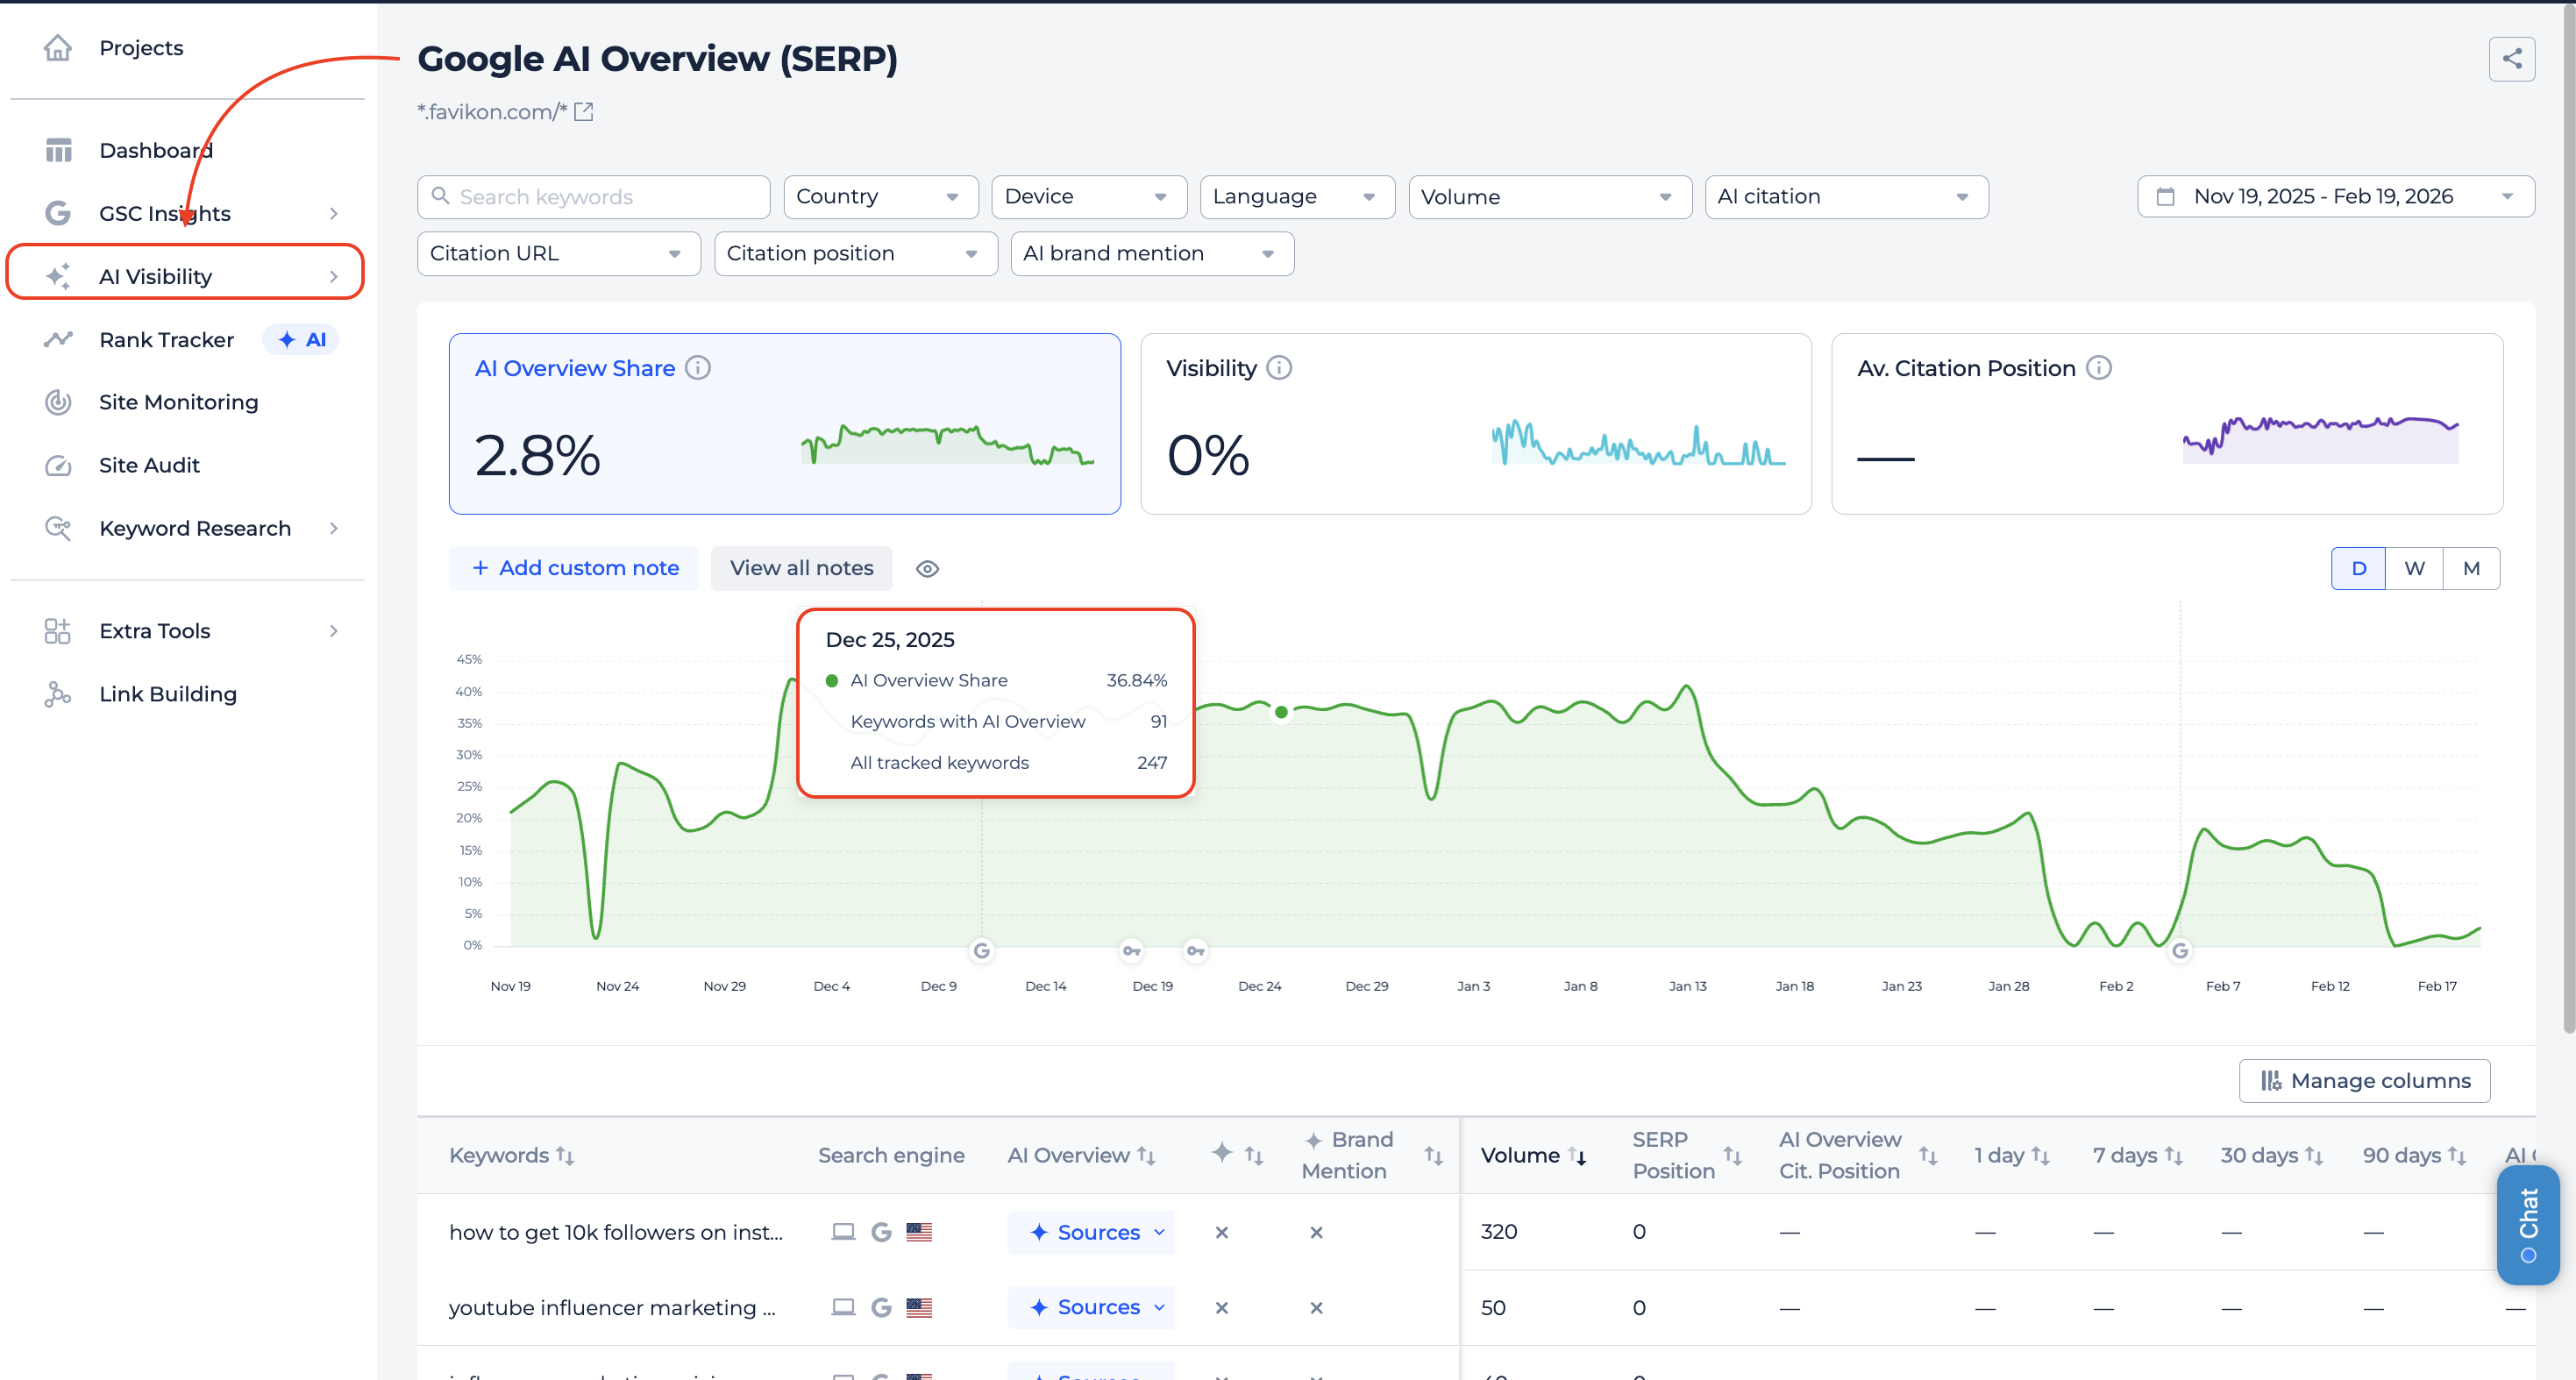
AI Overview Share
This tab shows what percentage of your tracked keywords trigger an AI Overview in search results. The value updates daily, so you can track how the AI presence in your SERPs changes over time.
For each keyword, you see whether your domain is cited, whether your brand is mentioned, and your citation position.
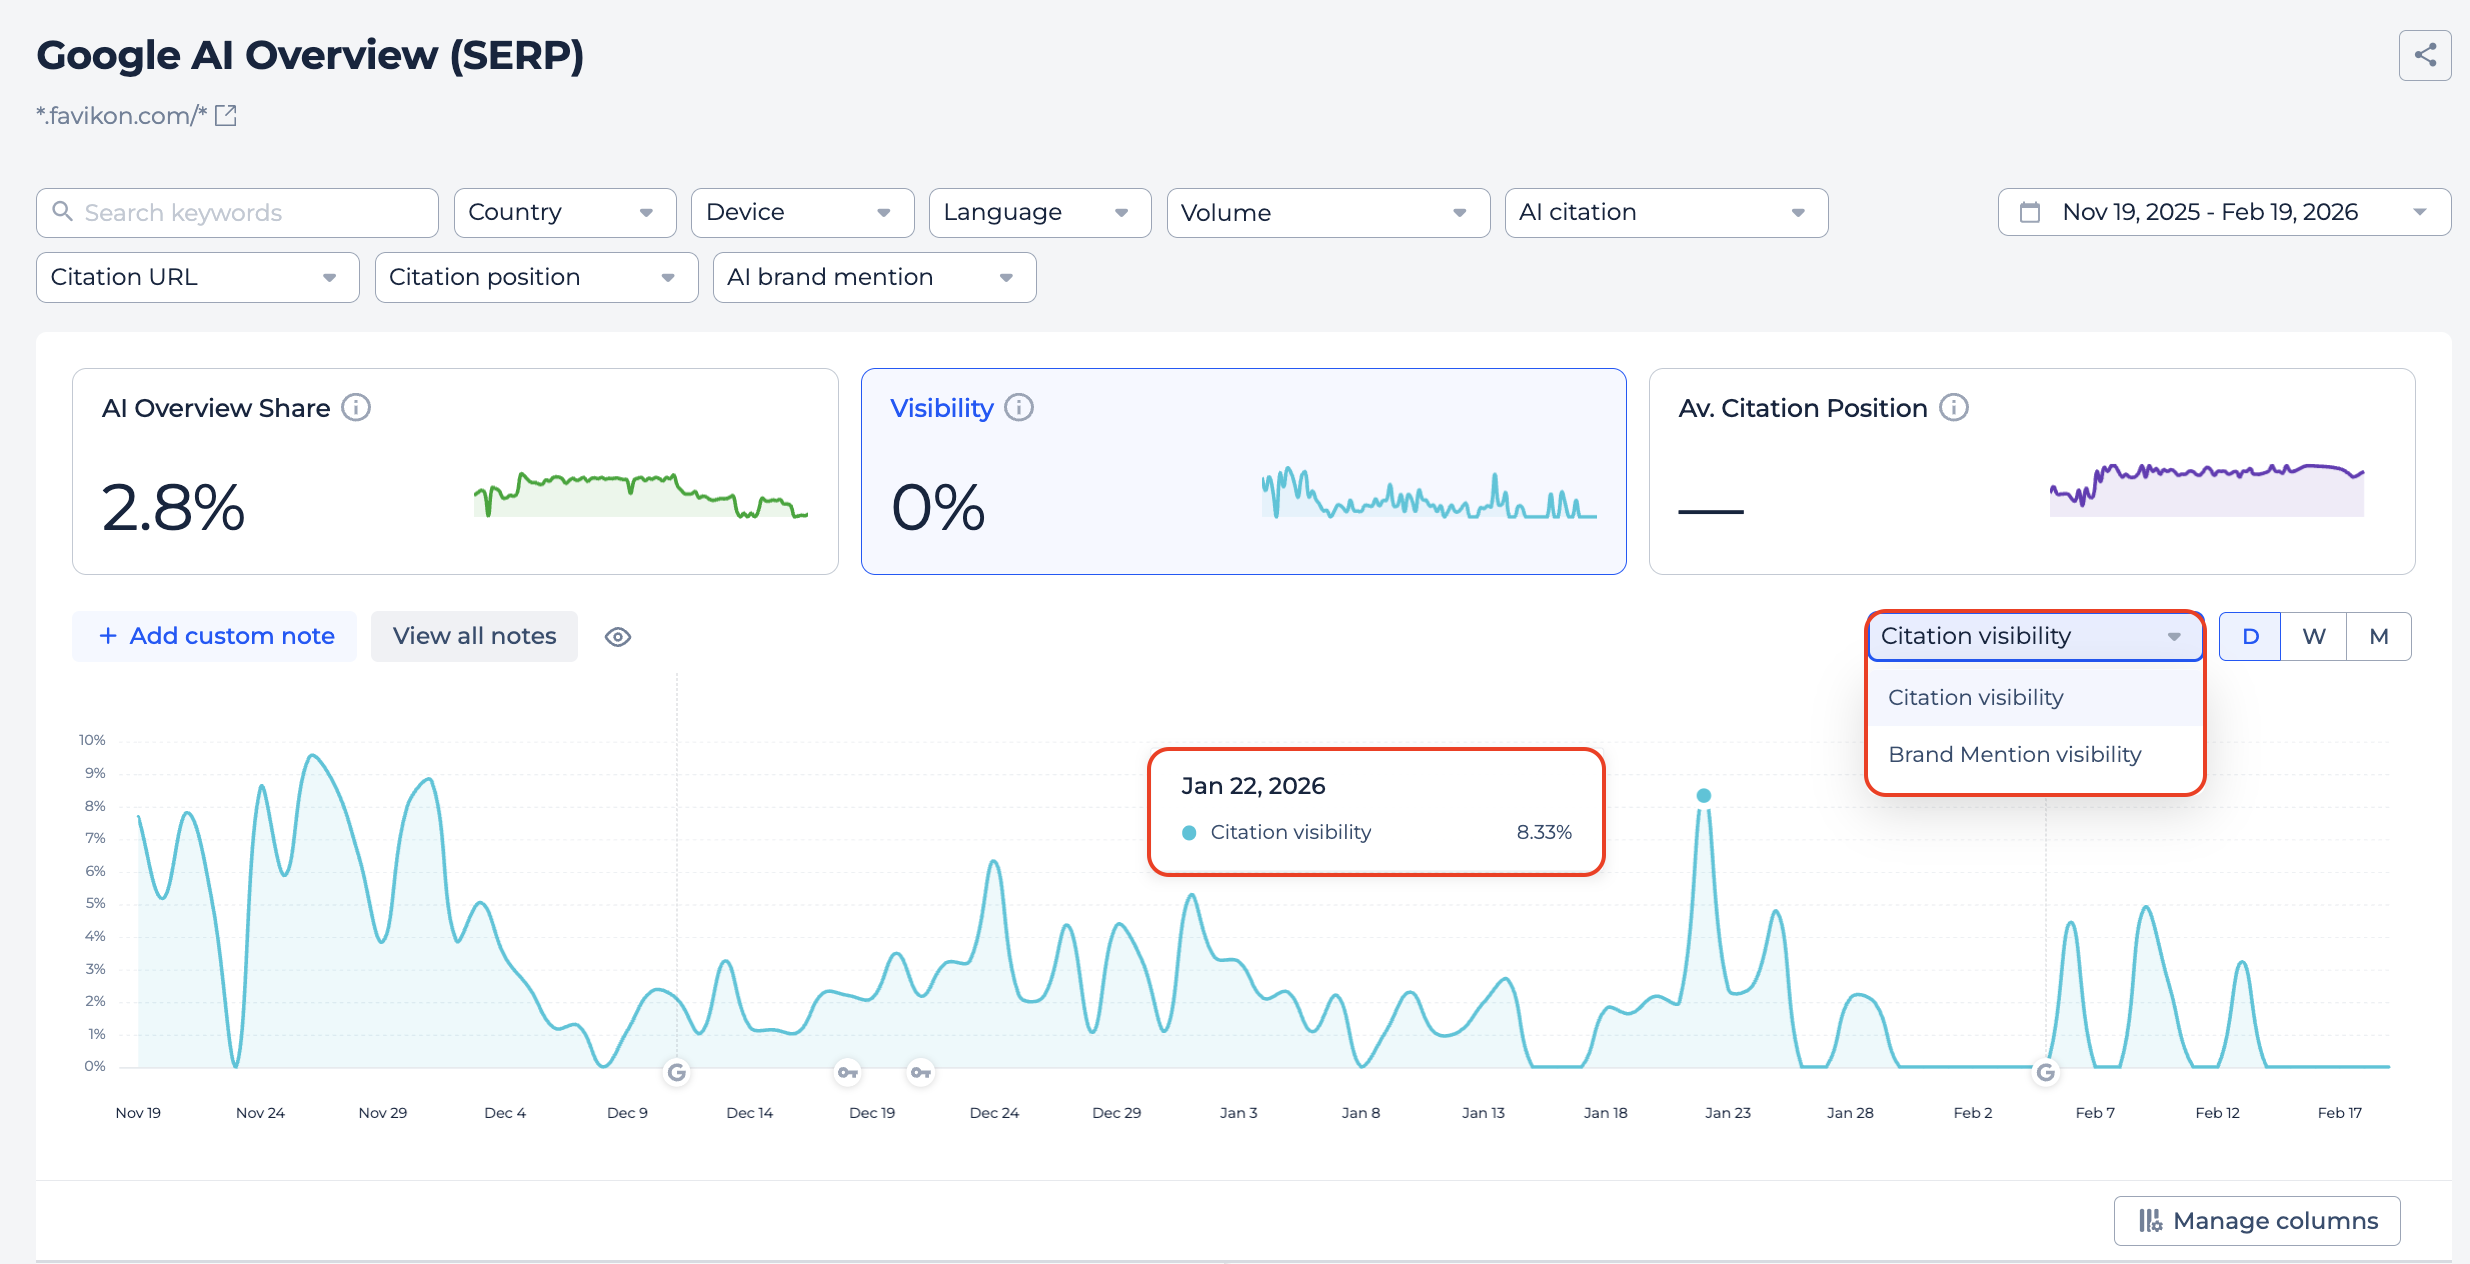
Visibility
Here you can track how often your domain actually appears in AI Overview blocks. There are two modes you can switch between:
Citation Visibility shows in what percentage of AI Overviews your domain is listed as a source.
Brand Mention Visibility shows how often your brand name appears in the AI-generated text itself, even without a direct citation link.
Both are calculated daily and displayed as trend charts.
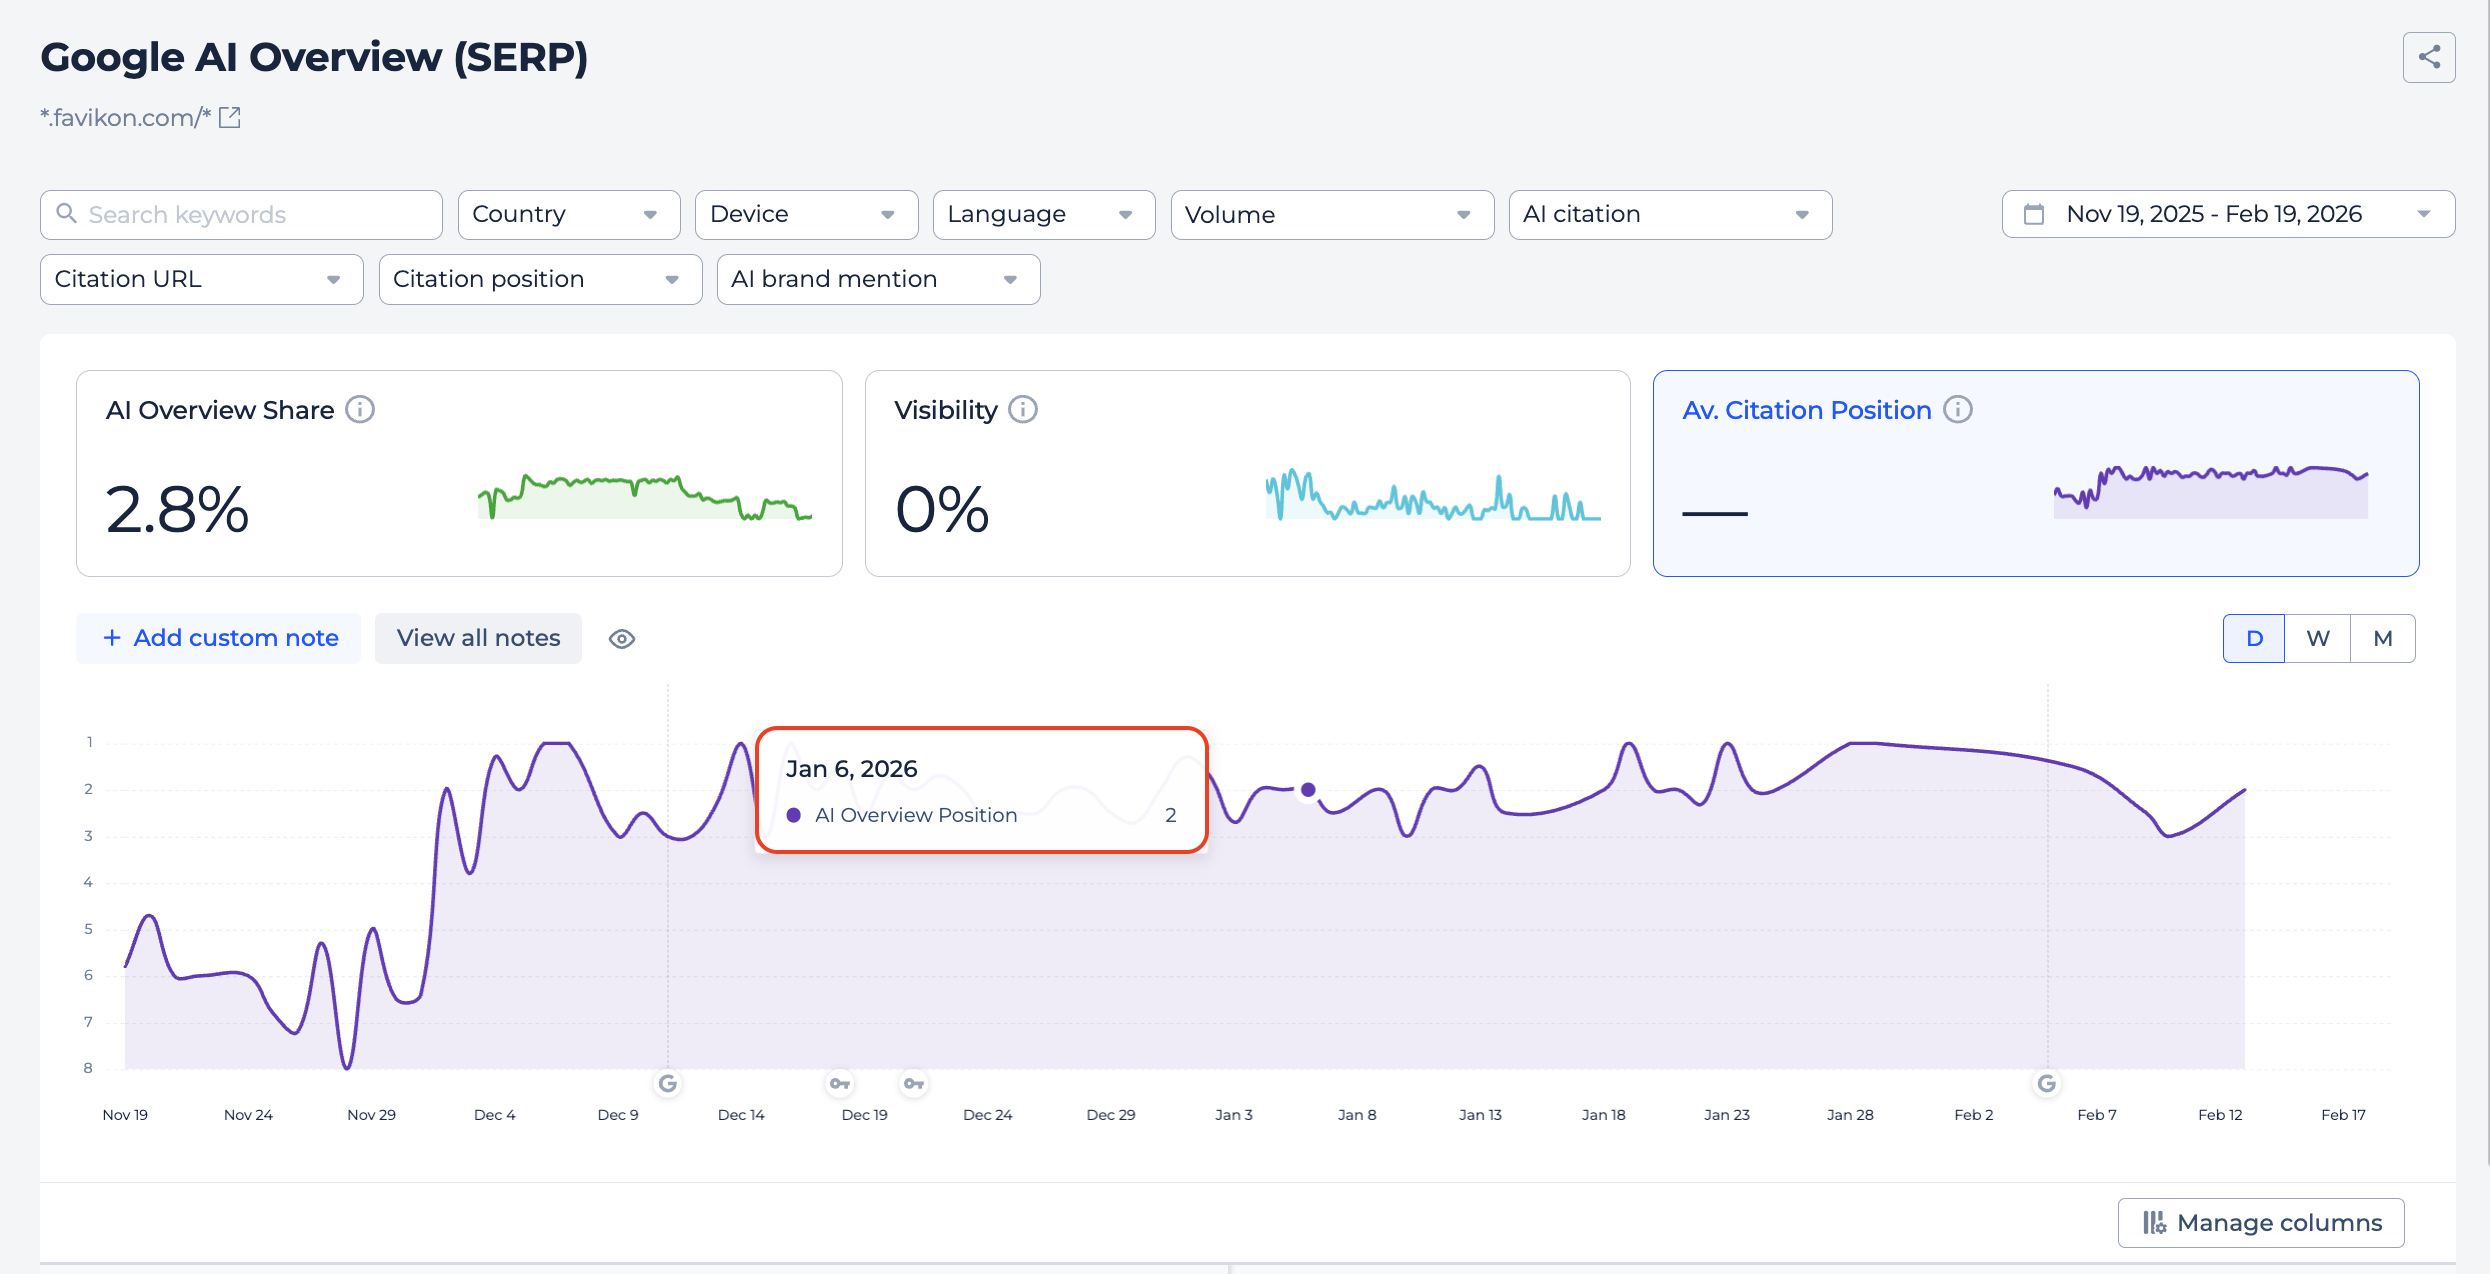
Average Citation Position
This tab shows where your domain ranks among the cited sources when it does appear.
3. Rank Tracker
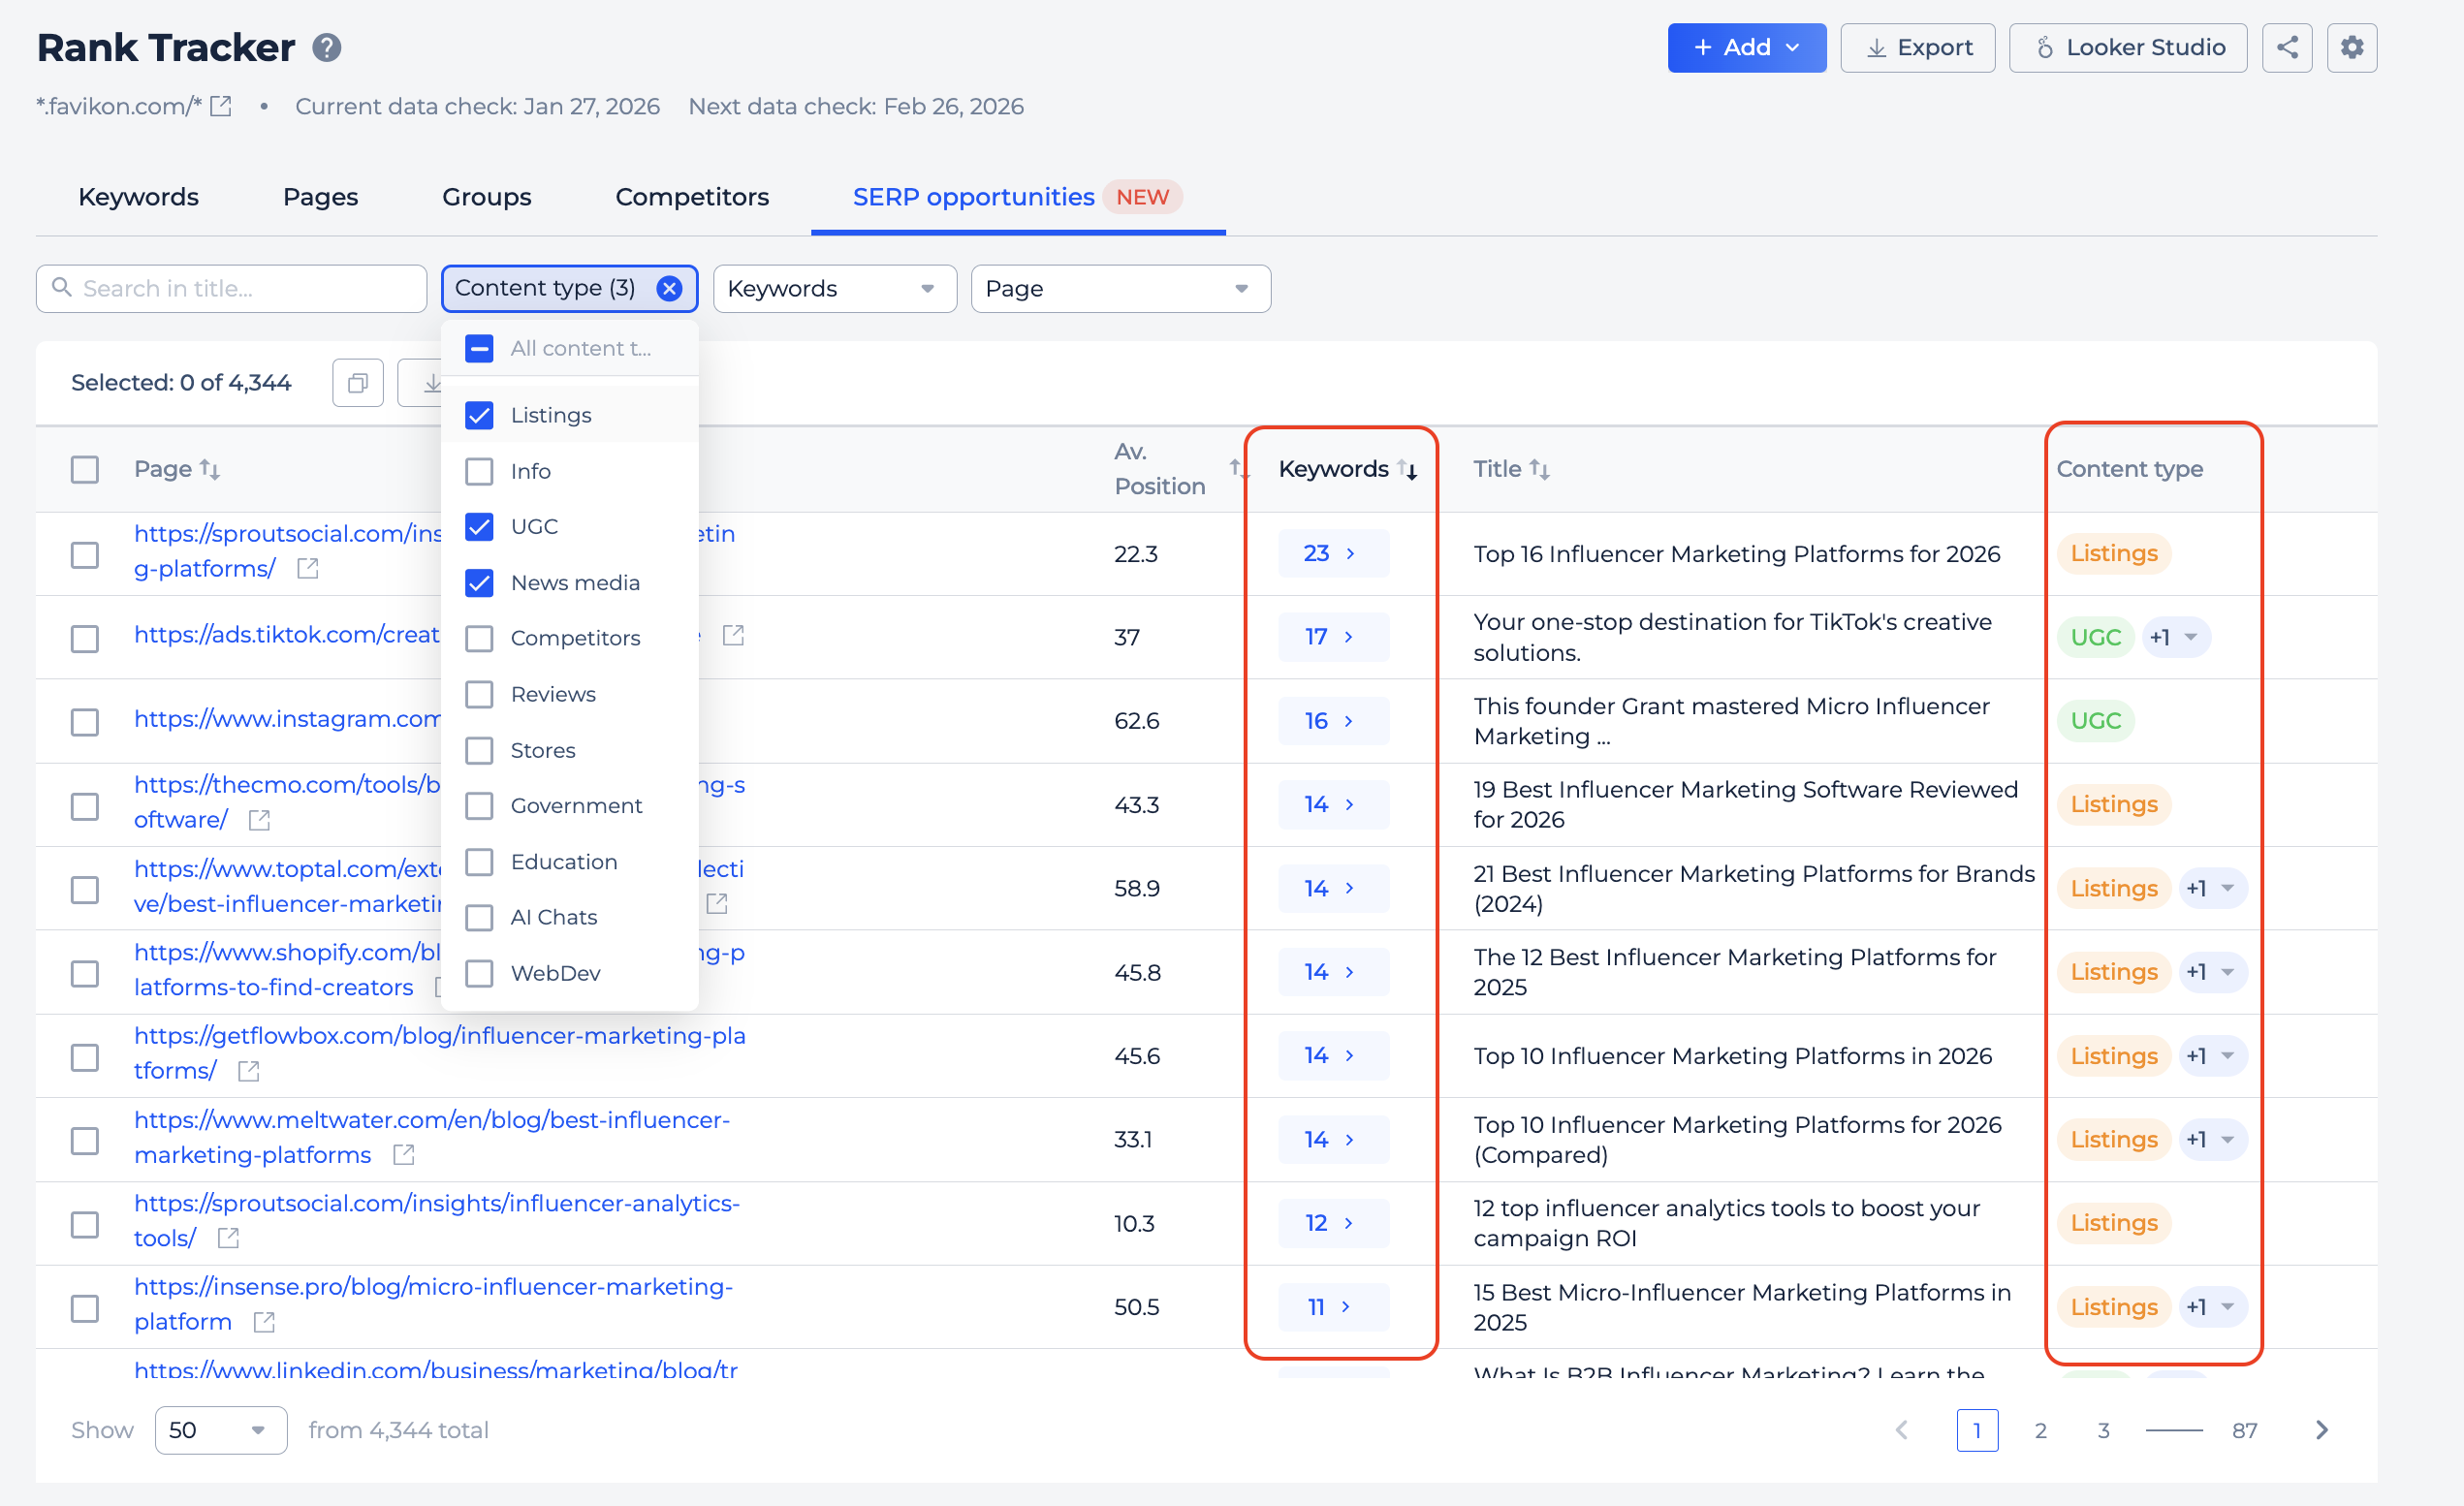
SERP Opportunities
New tab in Rank Tracker that helps you discover what else is ranking for your tracked keywords.
We take all the URLs from the SERPs across your keywords, remove duplicates, and organize them into a clean list with average position and keyword count for each URL.
This makes it easy to spot where you could place a link, find listing opportunities, or identify new competitors you were not aware of.
Click on the keyword count for any URL to see exactly which keywords it ranks for, along with position, volume, and KGR for each one.
The report refreshes monthly.
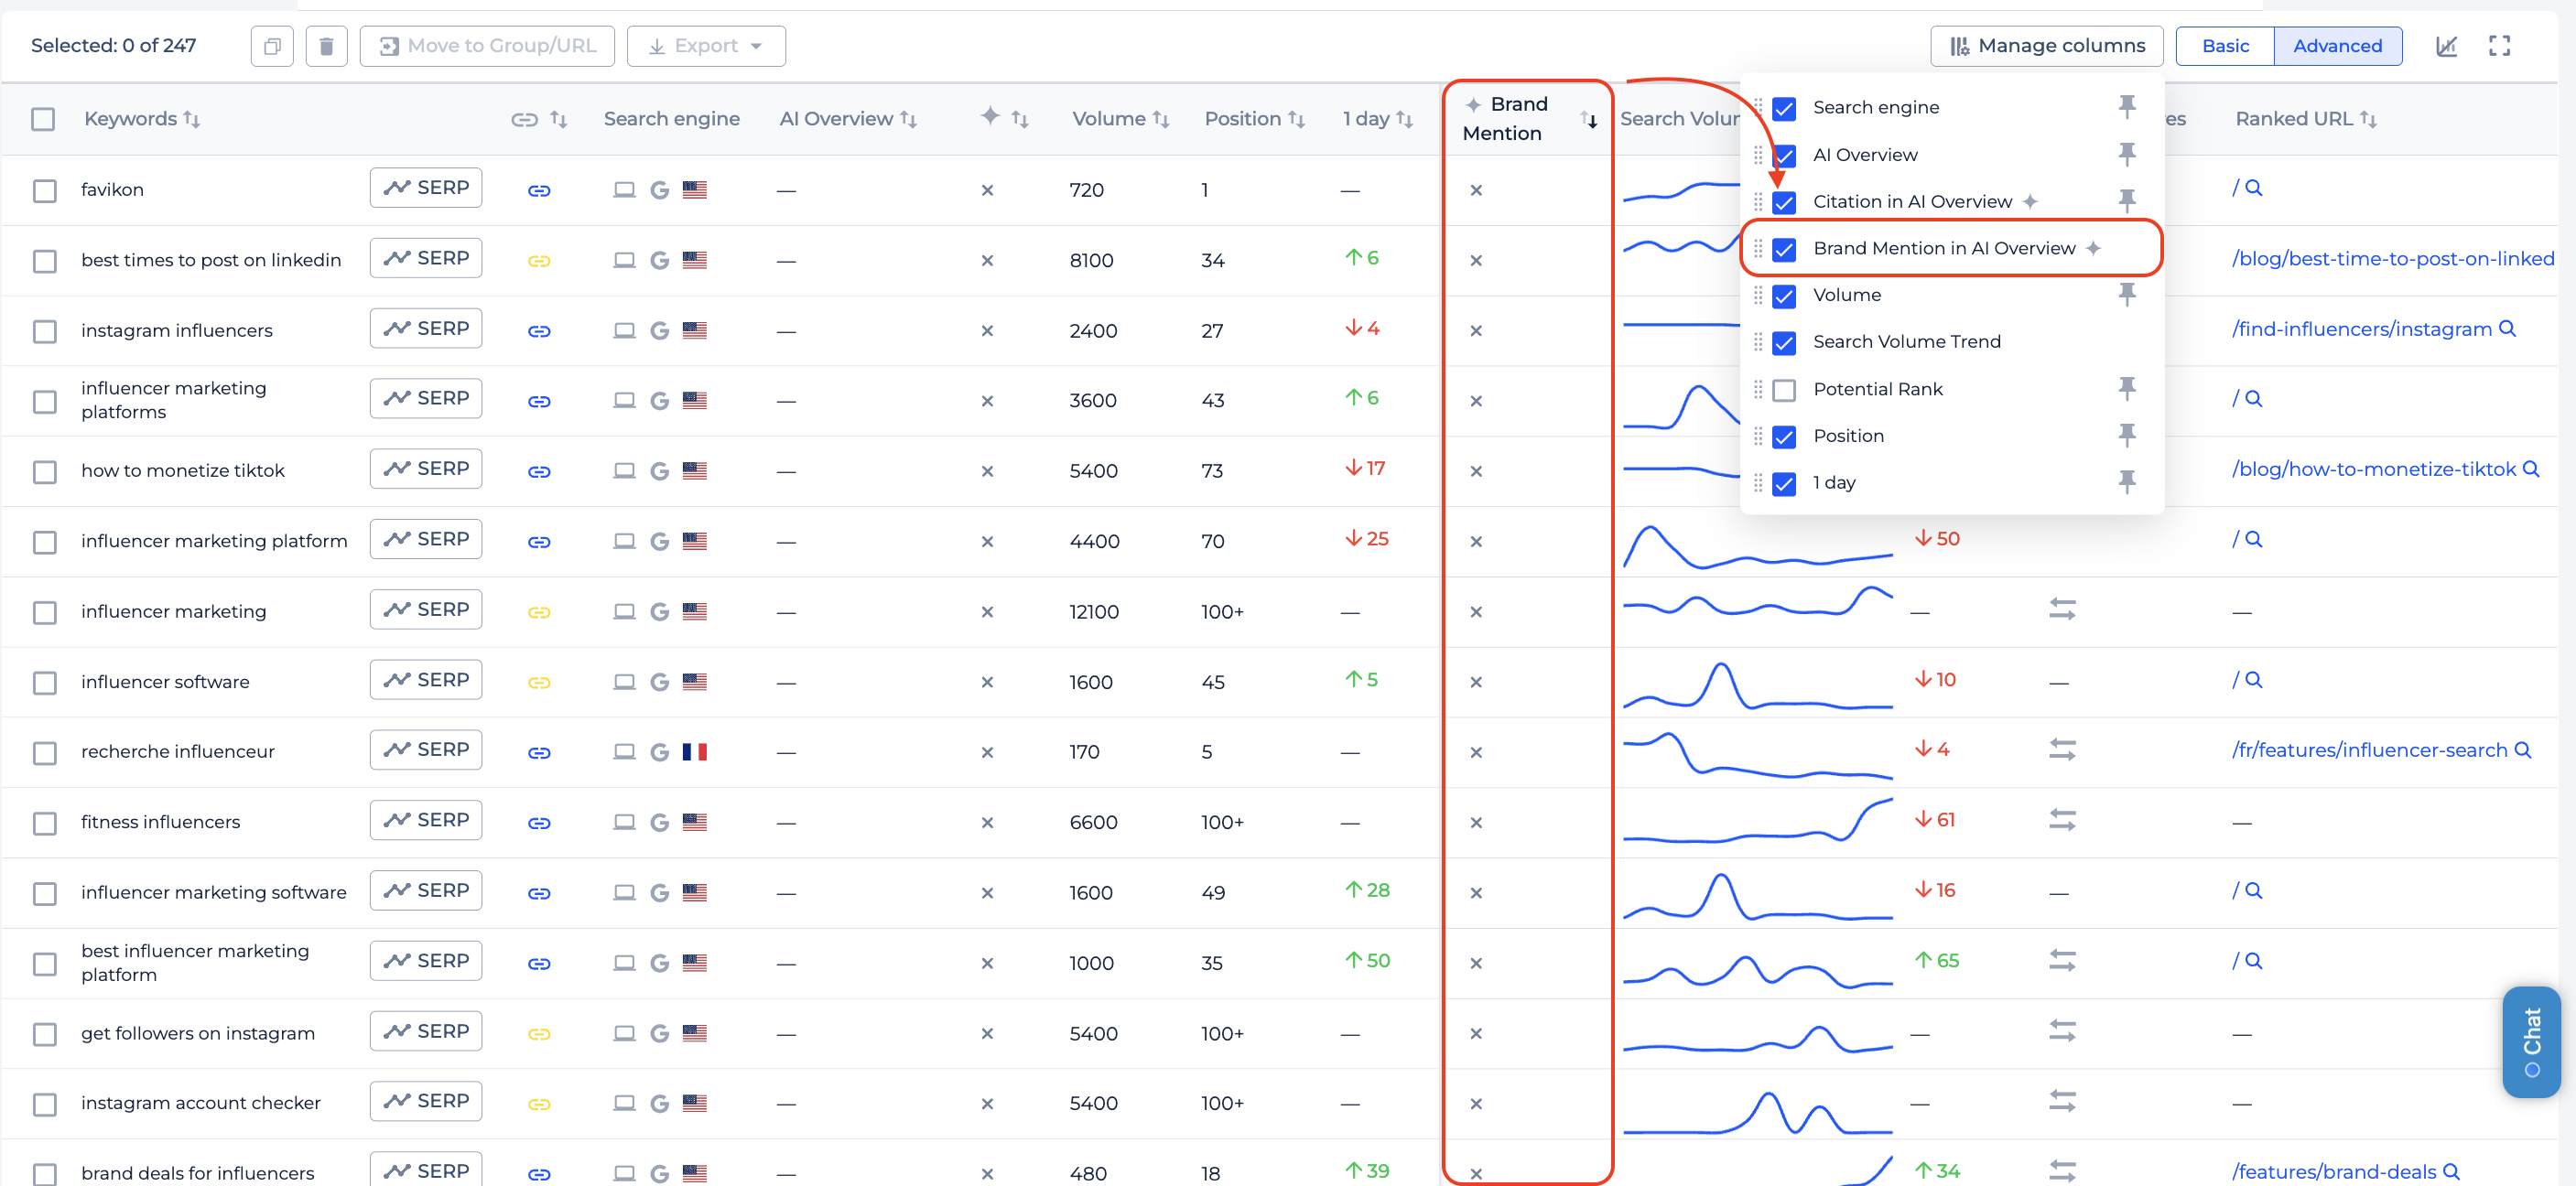
Brand Mention detection in AI Overview
Rank Tracker now checks whether your brand name is mentioned in the AI Overview text, not just in the citation links.
You can enable the Brand Mention column through Manage Columns button.
When you open the AI Overview Analysis for any keyword, the snippet now highlights where exactly your brand appears in the text.
Location filter
You can now filter keywords by city in Rank Tracker. If you track the same keywords across different locations, this filter lets you quickly narrow down results to a specific city instead of scrolling through everything.
Works the same way as the country filter, with a checkbox menu where you can pick one or several locations.
Project List improvements
Table view now includes a Rank Tracker Visibility column showing your current visibility percentage after the latest check.
You can find it in Manage Columns and reorder it like any other column. It’s added by default after the Ranked Keywords Changes.
4. New GSC Insights reports
GSC + GA4 Blended Report
You can now see GSC and GA4 data side by side for your landing pages, all in one report.
We import:
- Search performance metrics from GSC (impressions, clicks, CTR, average position, ranked pages, ranked keywords).
- Behavioral metrics from GA4 for organic Google sessions (sessions, key events, session key event rate, bounce rate, average session duration).
Then we match GA4 data to GSC landing pages so you get the full picture without switching between tools or building custom dashboards.
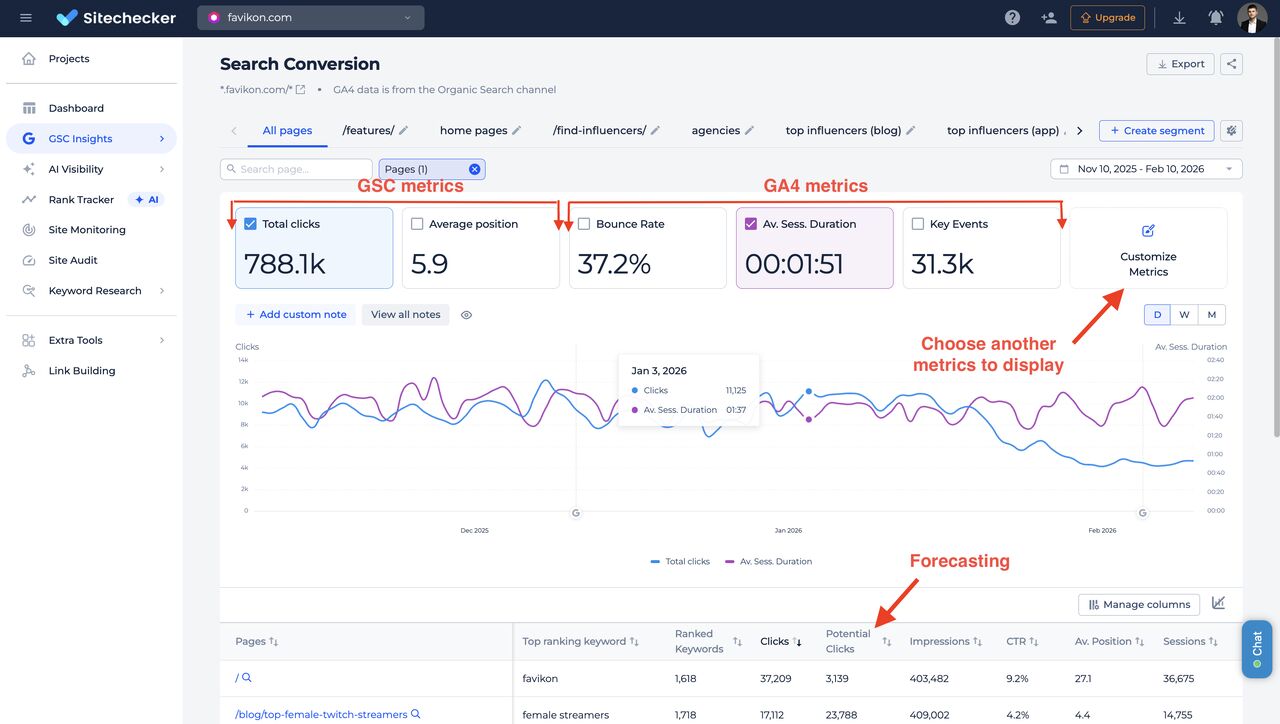
You can use a single chart to explain traffic drops to clients by showing that CTR decreased while position stayed the same, clicks went down, but key events actually grew, meaning the SEO work is on track.
You also get a forecast for each landing page showing potential clicks and key events it could generate if it ranked first for all queries it already appears for, based on its session key event rate from the past 90 days.
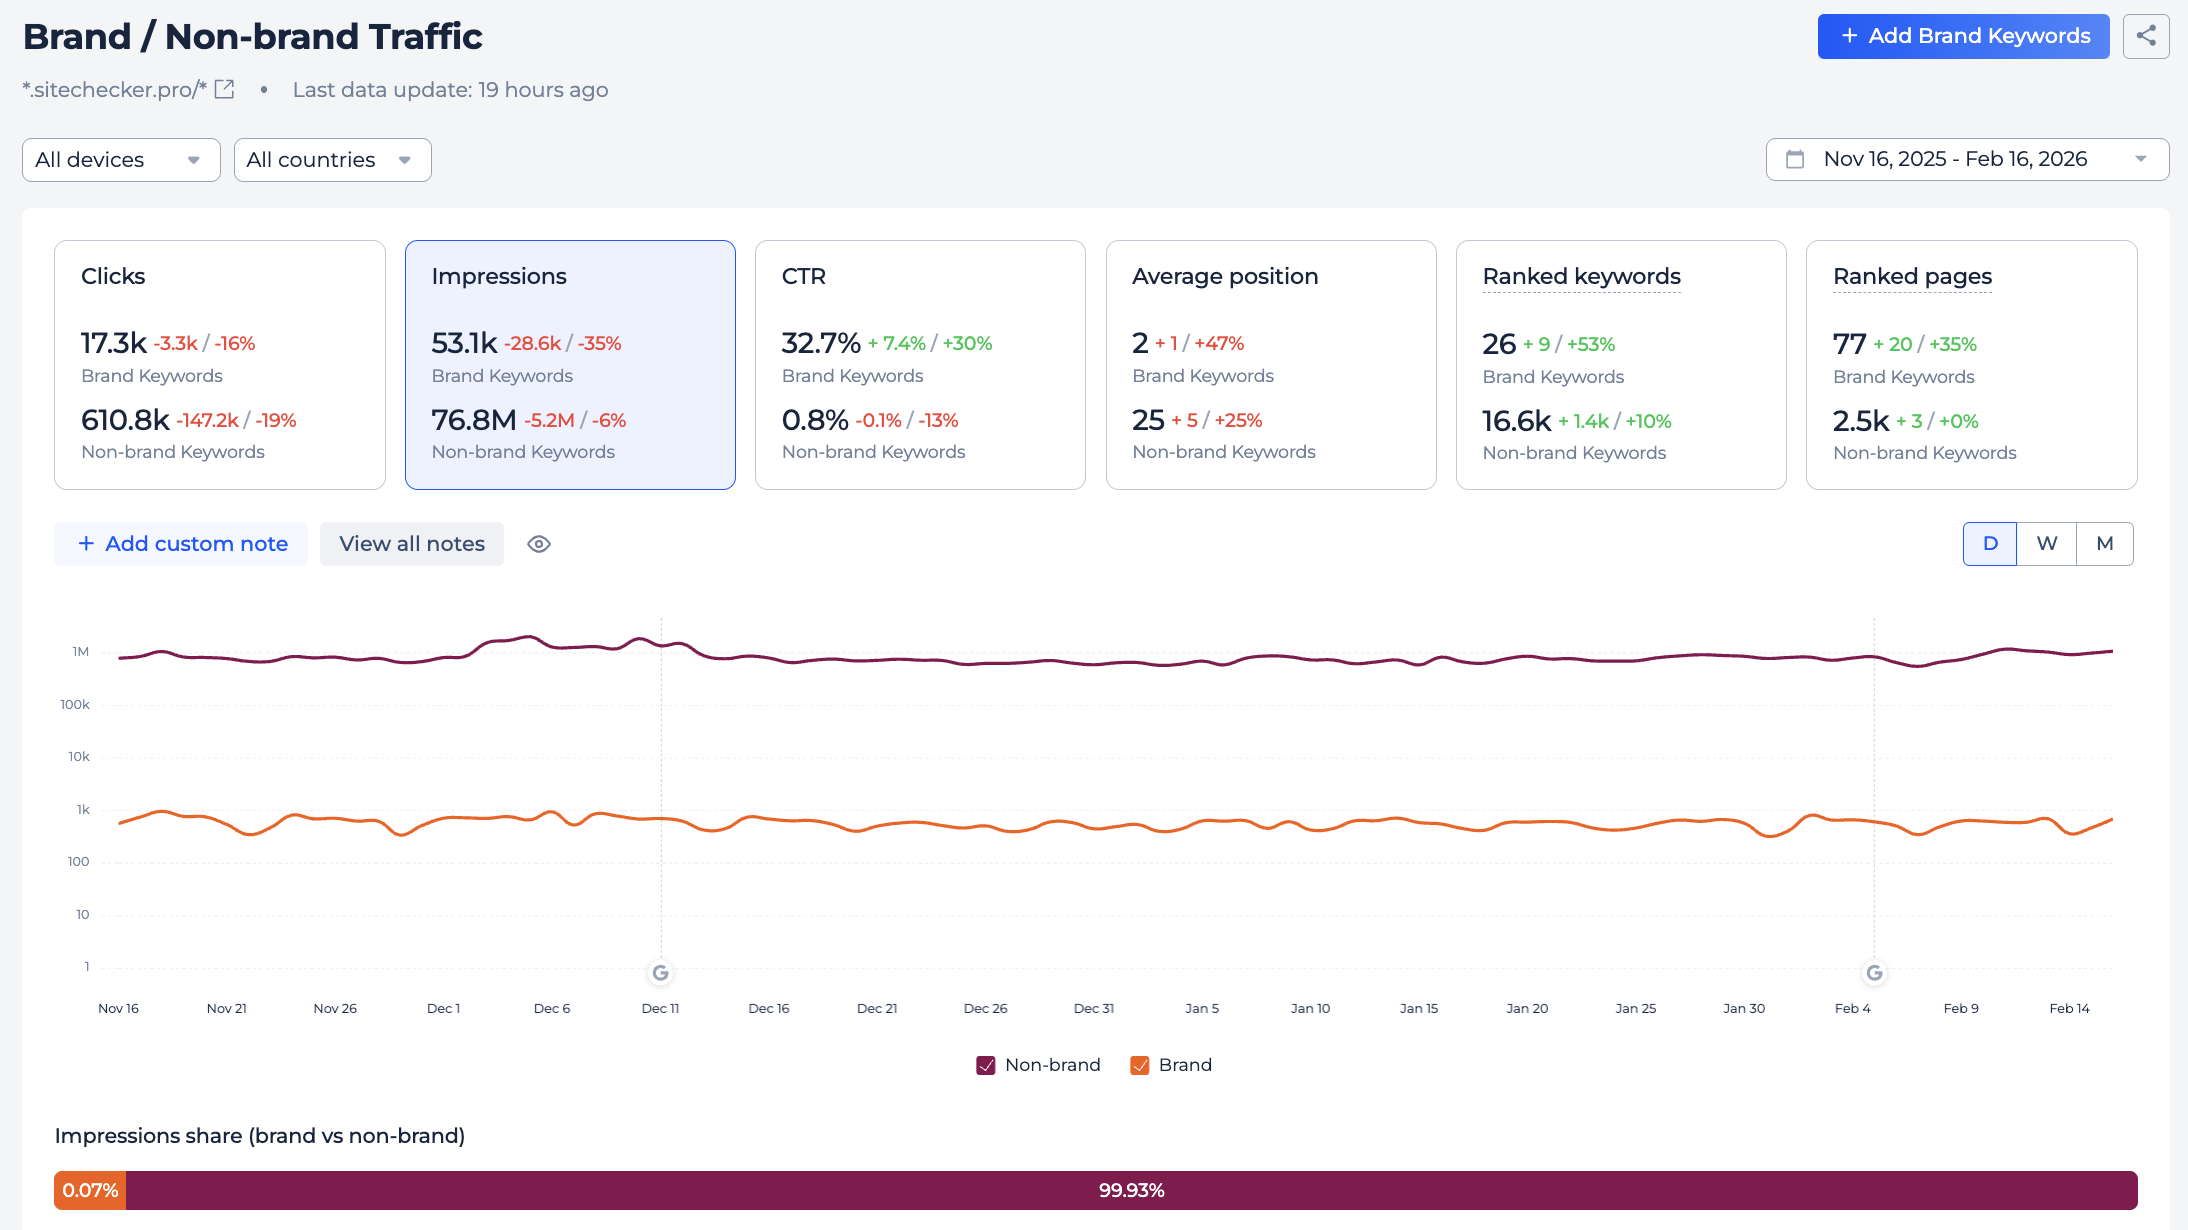
Brand vs Non-Brand Report
This report splits your GSC performance into branded and non-branded keywords.
You get an overall comparison across all key metrics:
- Clicks
- Impressions
- CTR
- Position
- Query count
- Page count for any period you choose
Below that, you can track how these metrics change over time by day, week, or month.
There’s also a share breakdown showing what portion of your clicks comes from branded vs. non-branded queries.
One thing that makes this especially useful is the ability to log changes and see how they correlate with branded traffic.
If you ran an influencer campaign, launched paid ads, or got a mention in an AI chat, you can see whether branded search picked up after that.
The report also includes a full list of branded keywords, sortable by growth percentage, so you can quickly spot which brand terms are trending up or down.
5. Unified Alerts and Reports
Alerts and reports used to live in one mixed list, which got messy fast, especially if you manage multiple projects.
Now they’re split into separate tabs with a clear structure that’s much easier to navigate.
Alerts
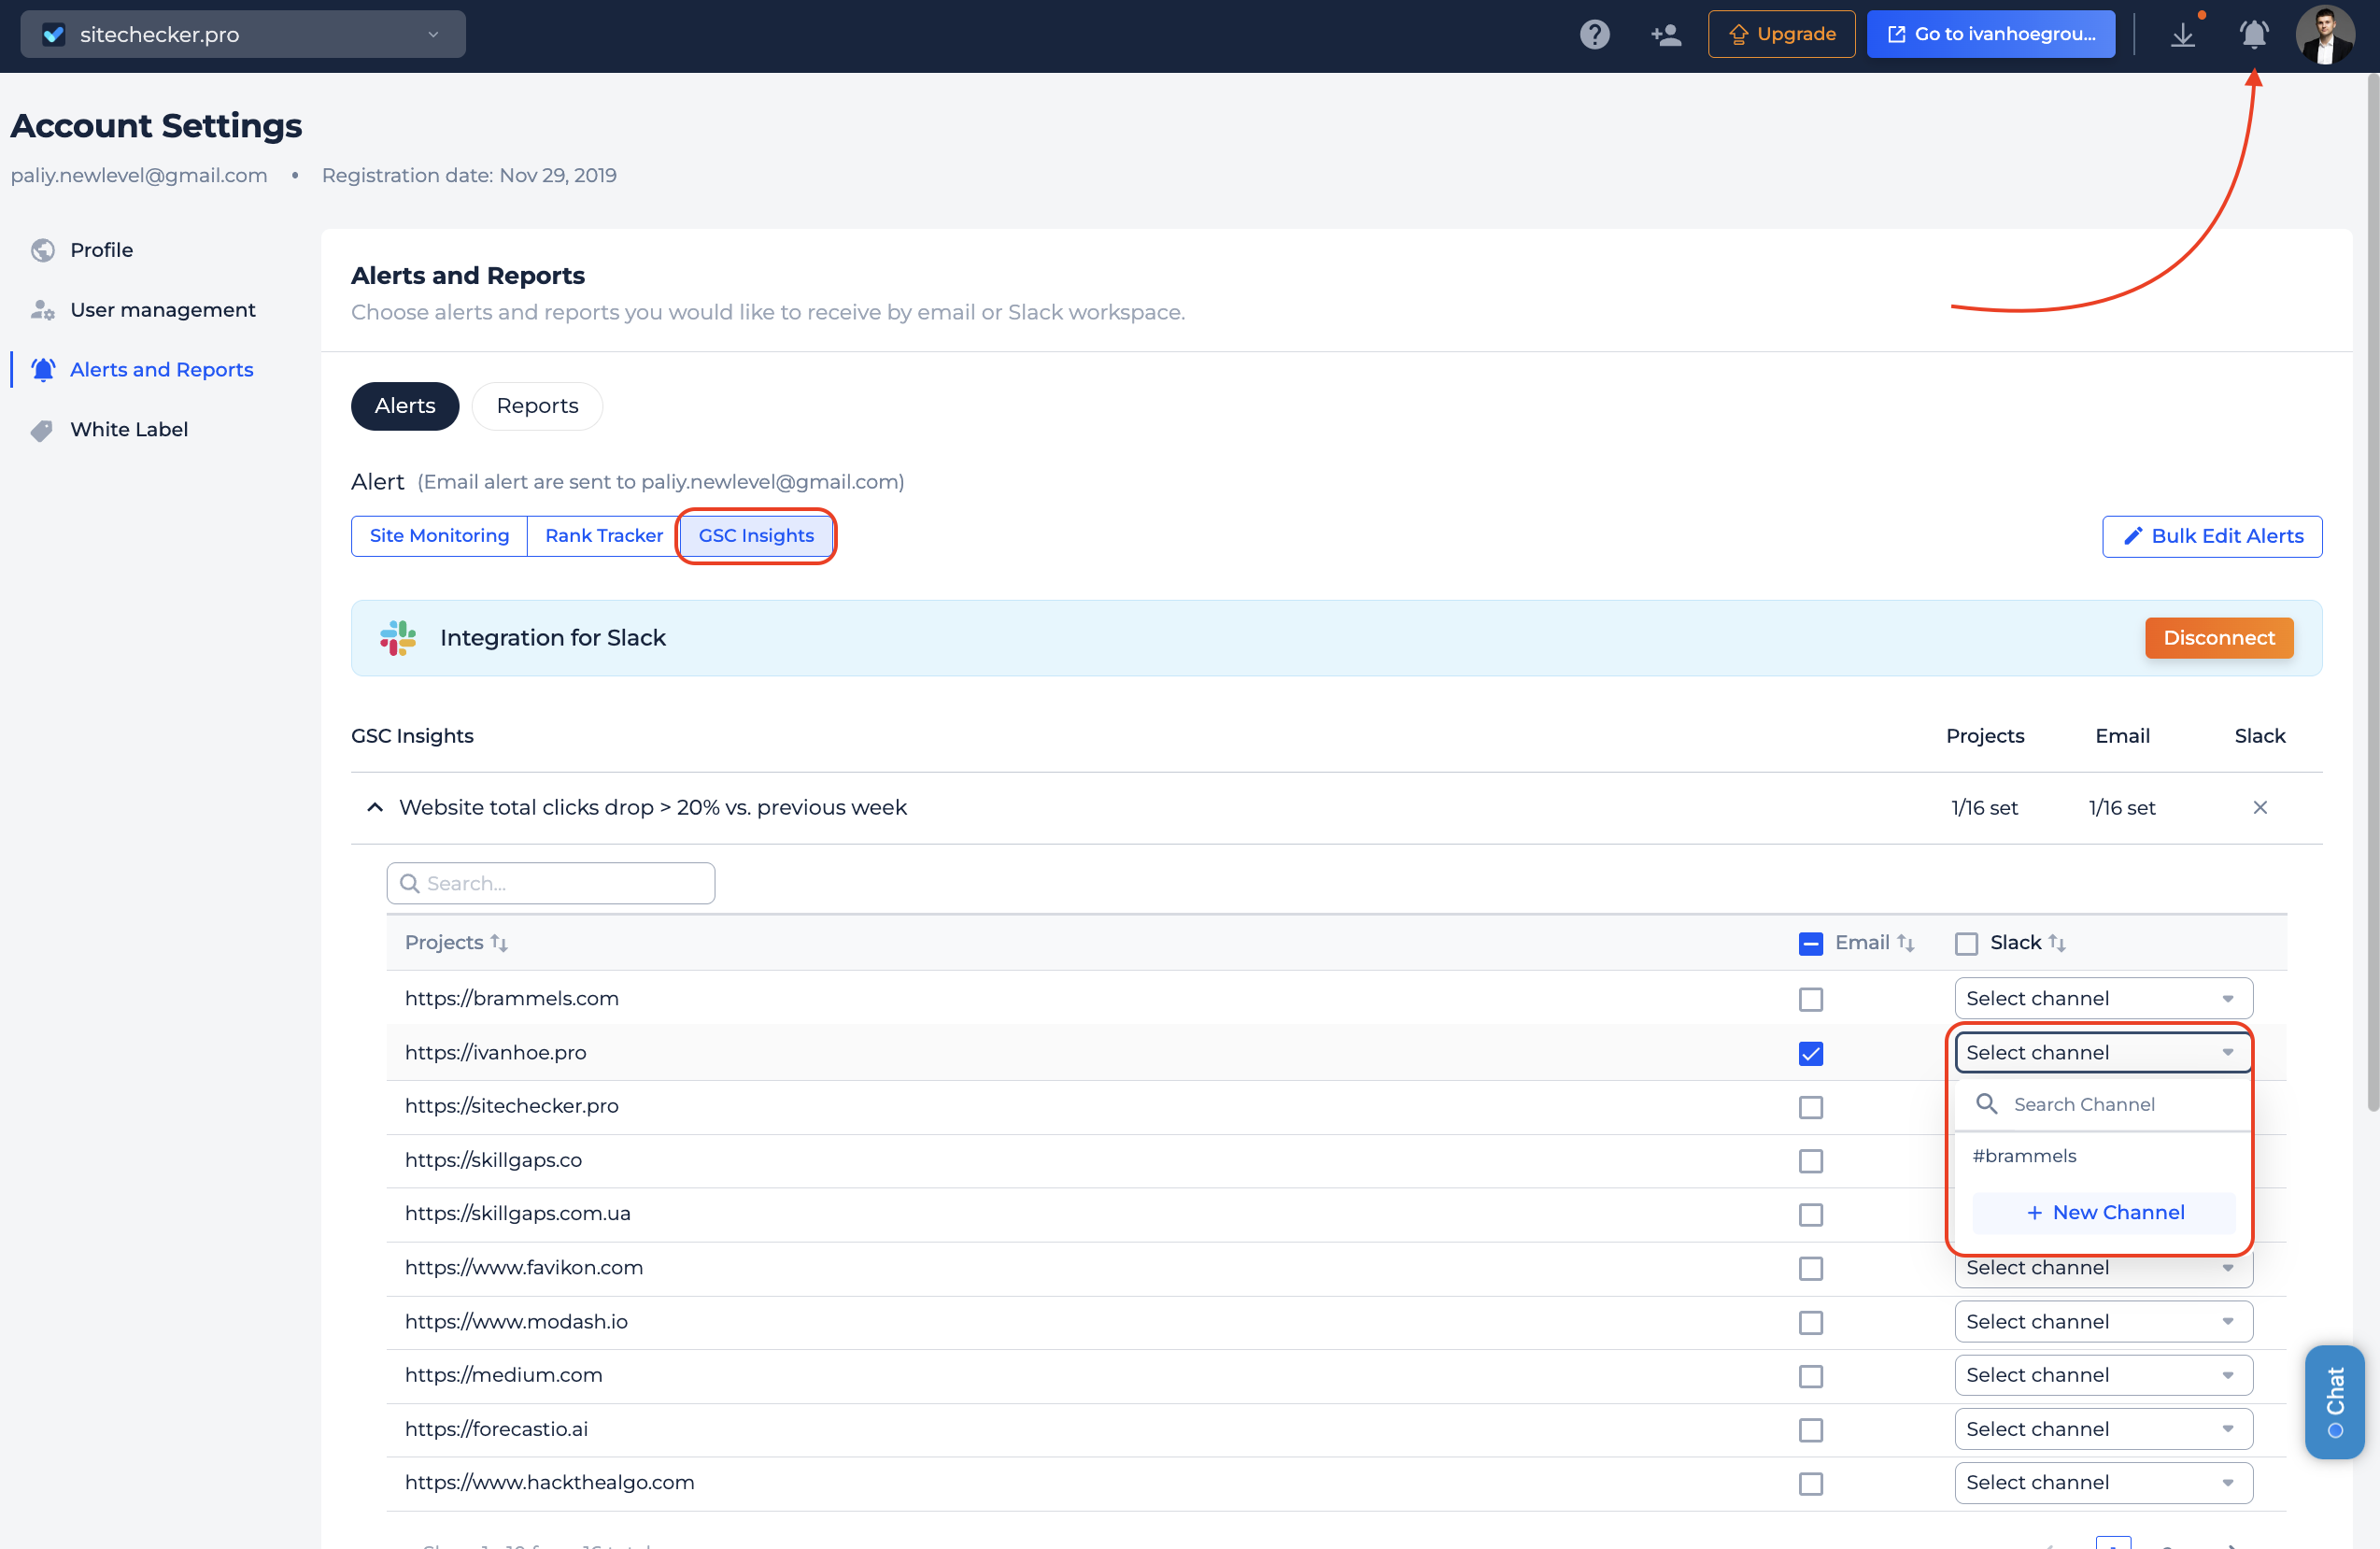
Alerts are organized by tool. You’ll find dedicated sections for Site Monitoring, Rank Tracker, and GSC Insights, so you always know where to look.
The biggest time saver is bulk editing.
Instead of configuring alerts one by one, you can now click Bulk Edit Alerts, select multiple alerts at once, and set email and Slack delivery for all of them in a single action.
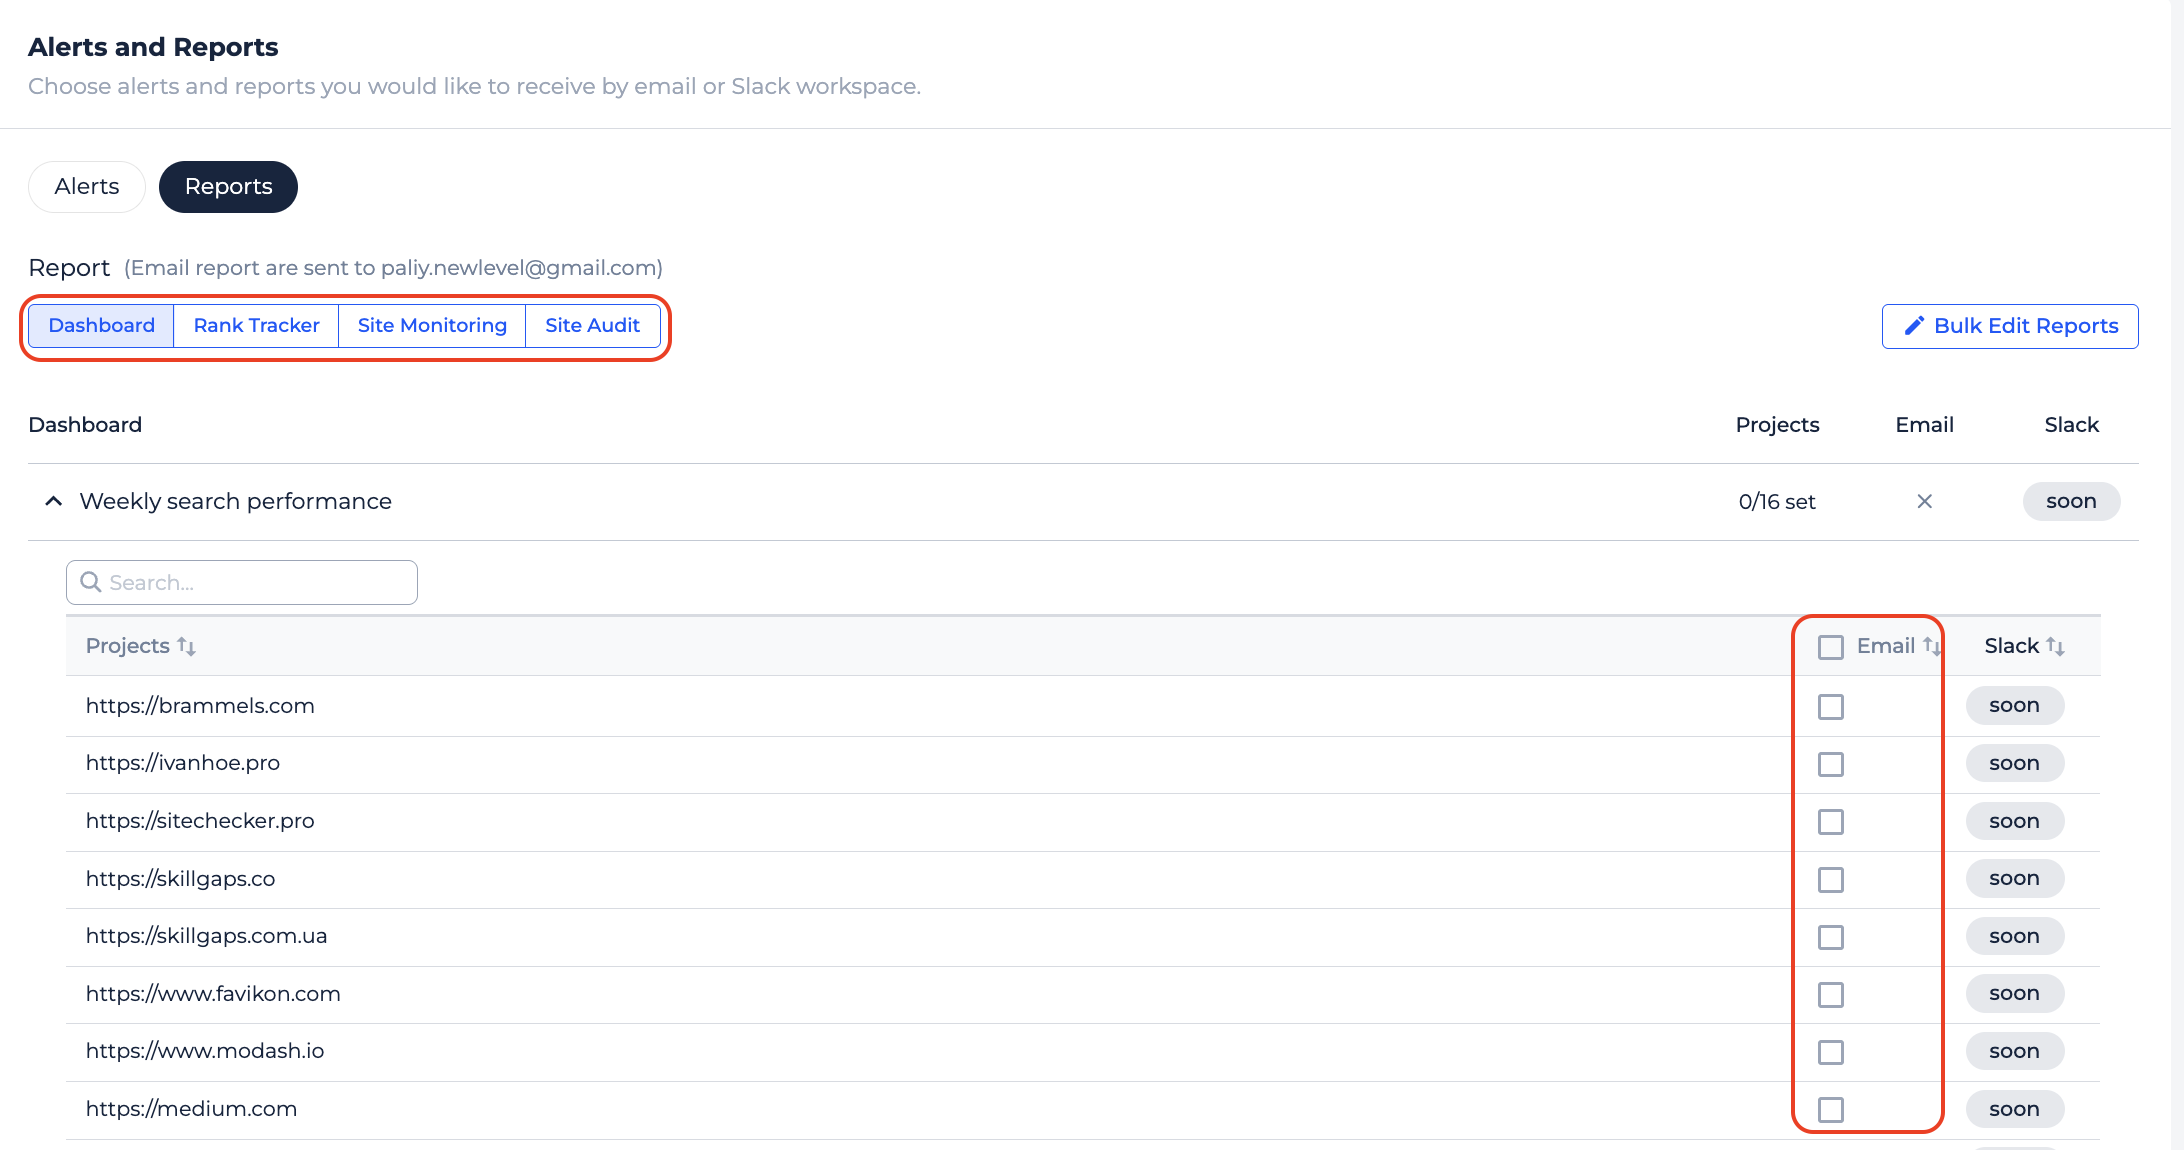
Reports
Reports now have their own tab as well. We kept it simple. Each report name includes its sending frequency, so you can see at a glance how often it goes out.
Reports are email-only for now.
6. New Alerts
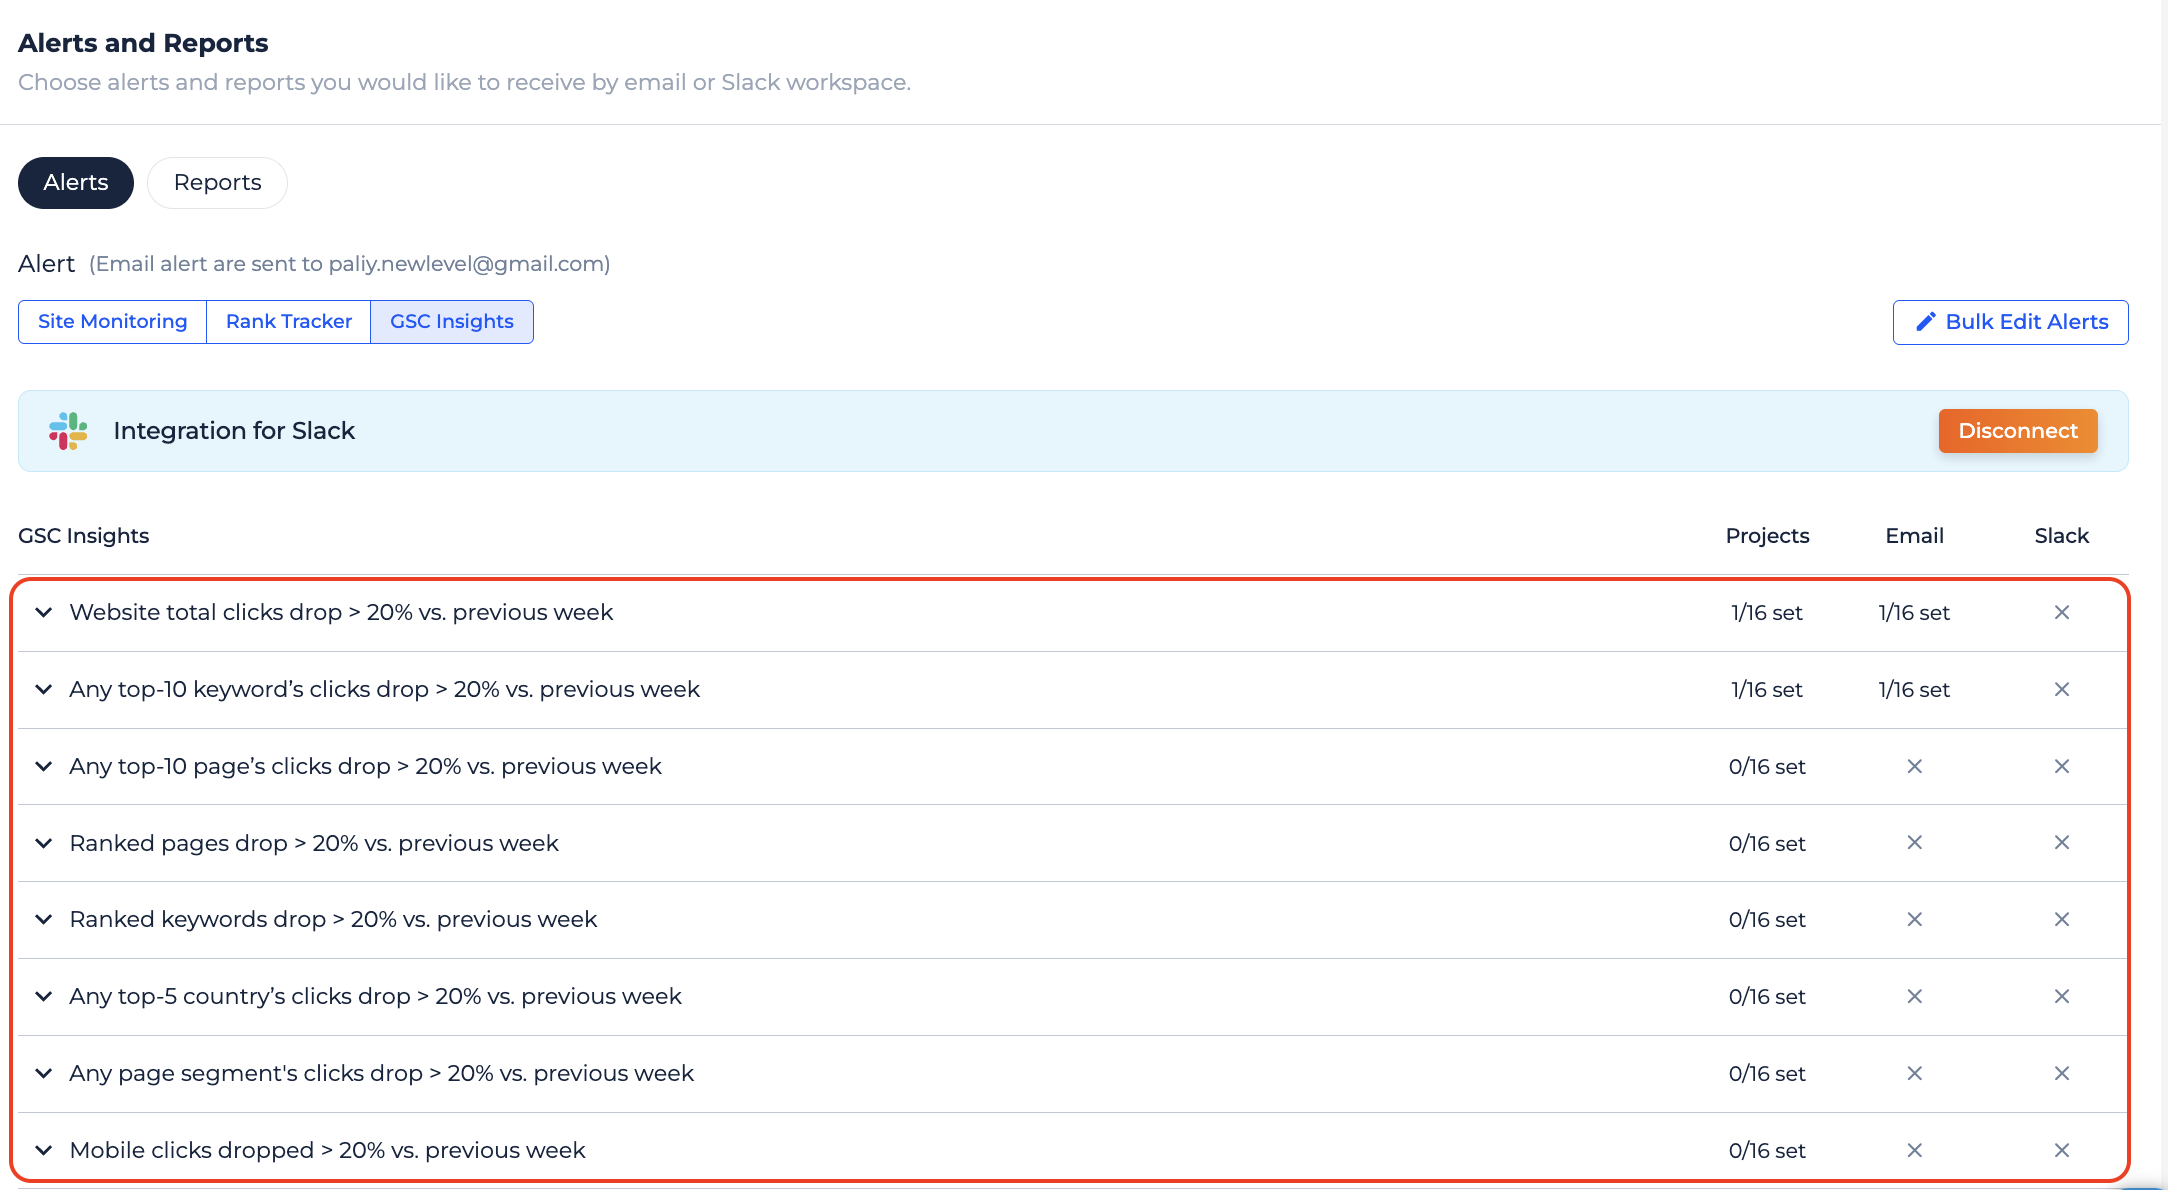
We’ve added 10 new alerts so you can catch important changes before they become problems.
These cover drops in visibility, clicks, rankings, and indexing issues across Rank Tracker, GSC Insights, and Site Monitoring.
All of them can be delivered via email, Slack, or both.
- Clicks dropped more than 20% vs. previous week (GSC)
- Top-10 keyword’s clicks dropped more than 20% vs. previous week (GSC)
- Any top-10 page’s clicks dropped more than 20% vs. previous week (GSC)
- Ranked pages dropped more than 20% vs. previous week (GSC)
- Ranked keywords dropped more than 20% vs. previous week (GSC)
- Any page segment’s clicks dropped more than 20% vs. previous week (GSC)
- Any top-5 country’s clicks dropped more than 20% vs. previous week (GSC)
- Mobile clicks dropped more than 20% vs. previous week (GSC)
- Overall visibility dropped more than 20% (Rank Tracker)
- Page with a noindex tag receives impressions from Google (Site Monitoring)
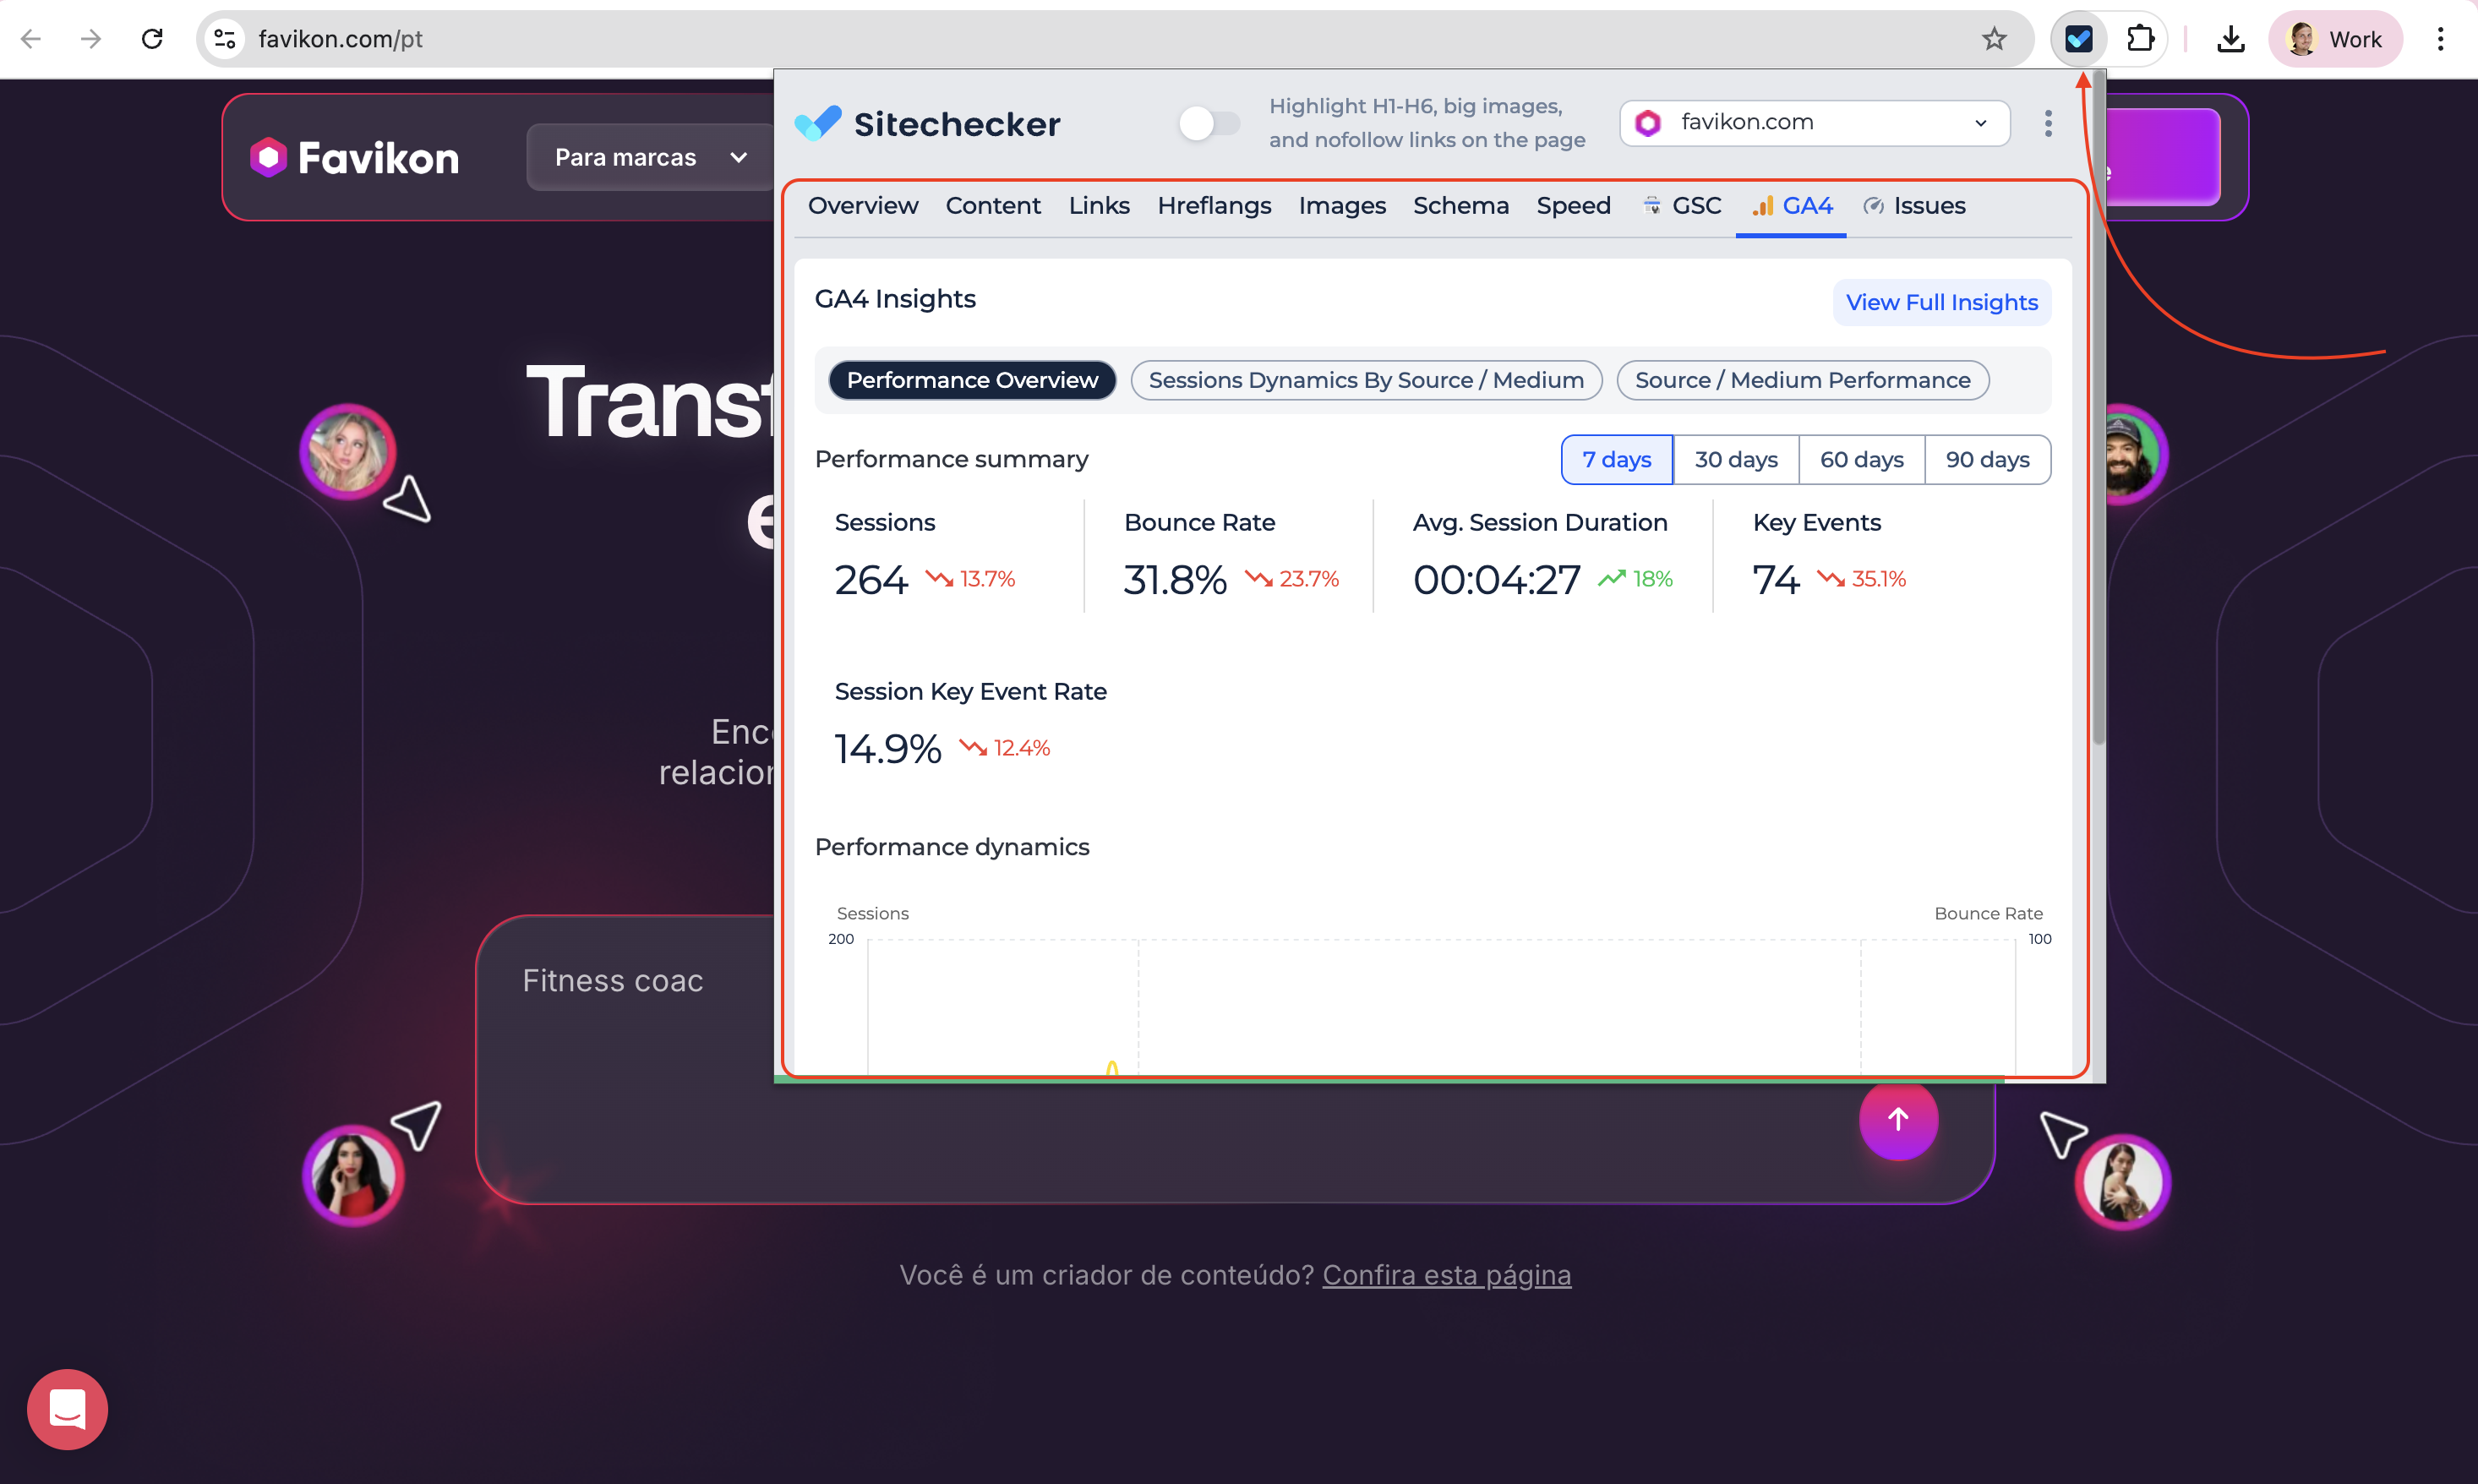
7. Google Chrome extension update
The extension now includes a GA4 tab that shows behavioral data for any page you’re viewing, right in your browser.
If your project has GA4 connected, you get sessions, bounce rate, average session duration, key events, and session key event rate, along with a dynamic chart and traffic breakdown by source.
There are three views:
- Performance Overview for key metrics and trends
- Sessions Dynamics for channel-level traffic over time
- Source/Medium Performance as a sortable table of all traffic sources.
")
")
")