

What is a Google Search Console dashboard tool for agencies?
Google Search Console dashboard tool for agencies is a platform that connects to GSC and transforms its raw data into clear, actionable reports. It removes native GSC limits, offering unlimited data access, a more extended history, flexible filters, and automated insights.
Built for SEO teams and agencies, it simplifies performance tracking, cross-device and regional analysis, and client reporting, making SEO monitoring faster, deeper, and easier to share.
Essential Google Search Console dashboard features for agencies
1. Unlimited data access: remove Google Search Console’s 1,000-row export limit. Agencies need complete visibility into all keywords, pages, and impressions, not just top results. A proper dashboard should automatically fetch all available data through the API without manual scripts.
2. Extended data history: access up to 36 months of GSC data instead of the native 16 months. This helps agencies analyze seasonality, long-term growth, and the impact of SEO campaigns over time.
3. Advanced filtering and segmentation: enable multi-layer filters by country, device, query type, CTR, position, and impressions. The tool should also allow creating custom segments (e.g., “US mobile traffic,” “CTR < 1% keywords,” etc.) and saving them for reuse in reports.
4. Automated insights and change detection: the dashboard should automatically highlight growth or decline in clicks, impressions, and keyword positions.
5. Keyword–page relationship mapping: display the top-performing keyword for each page and the top-ranking page for each keyword in one view.
6. Branded, client-ready reports: allow agencies to generate white-label dashboards and exports that visualize trends and segment data, and include annotations for Google updates or campaign actions.
Managing Google Search Console data can be challenging due to export limits, short data history, and limited filtering options.
That’s why many SEO teams and agencies use specialized GSC dashboard tools. These tools turn raw search data into clear, interactive reports with deeper insights and easier comparisons.
Below is a comparison of the best tools for visualizing and analyzing GSC data, showing how they differ in data access, customization, automation, and reporting capabilities.
Google Search Console dashboard tools
| Feature / Tool | Sitechecker GSC Dashboard | DashThis | Geckoboard | Coupler.io + Looker Studio | Nozzle GSC Dashboard |
|---|---|---|---|---|---|
| 1,000-row data limit | ❌ No limit, full data access via API | ✅ Limited (GSC API limit applies) | ✅ Limited (API-based) | ❌ No limit (custom API extraction) | ⚙️ Currently limited to GSC API scope |
| Data history | 🕒 Up to 36 months | ⚙️ Up to 16 months | ⚙️ Up to 16 months | ⚙️Based on stored exports | ⚙️ 16 months, extended storage |
| No API / BigQuery setup required | ✅ 1-click OAuth connect | ✅ OAuth connect | ✅ OAuth connect | ❌ Manual API setup required | ✅ OAuth connect |
| Flexible filters | ✅ Advanced custom ranges | ⚙️ Basic KPI filters | ⚙️ Basic (limited options) | ✅ Full control in Looker Studio | ✅ Yes |
| Combined filters | ✅ Yes (multi-filter logic) | ❌ Single-filter only | ❌ Single-filter only | ✅ Yes | ⚙️ Partial |
| Segments | ✅ Available | ❌ Not supported | ❌ Not supported | ⚙️ Template-based | ⚙️ Planned |
| Period comparison | ✅ Instant period comparison | ⚙️ Manual widget setup | ⚙️ Manual setup | ✅ Native support in Looker Studio | ✅ Yes |
| Keyword ↔ Page mapping | ✅ Unique built-in table | ❌ Not available | ❌ Not available | ❌ Manual setup needed | ⚙️ Partial |
| Built-in one-page SEO audit | ✅ Yes | ❌ No | ❌ No | ❌ No | ❌ No |
| Automated insights | ✅ Pre-built insights | ❌ No | ❌ No | ❌ Manual formulas only | ⚙️ Basic trend tables |
| Annotations (Google updates + custom notes) | ✅ Yes | ❌ No | ⚙️ Limited | ❌ No | ✅ Yes |
| CSV / Excel export without limits | ✅ Full export | ⚙️Visible-data-only | ⚙️ Limited | ✅ Yes | ✅ Yes |
| Pricing model | 💰 SaaS subscription (GSC included) | 💰 SaaS per dashboard | 💰 SaaS subscription | 💰 Per data source/user | 💰 SaaS SEO platform |
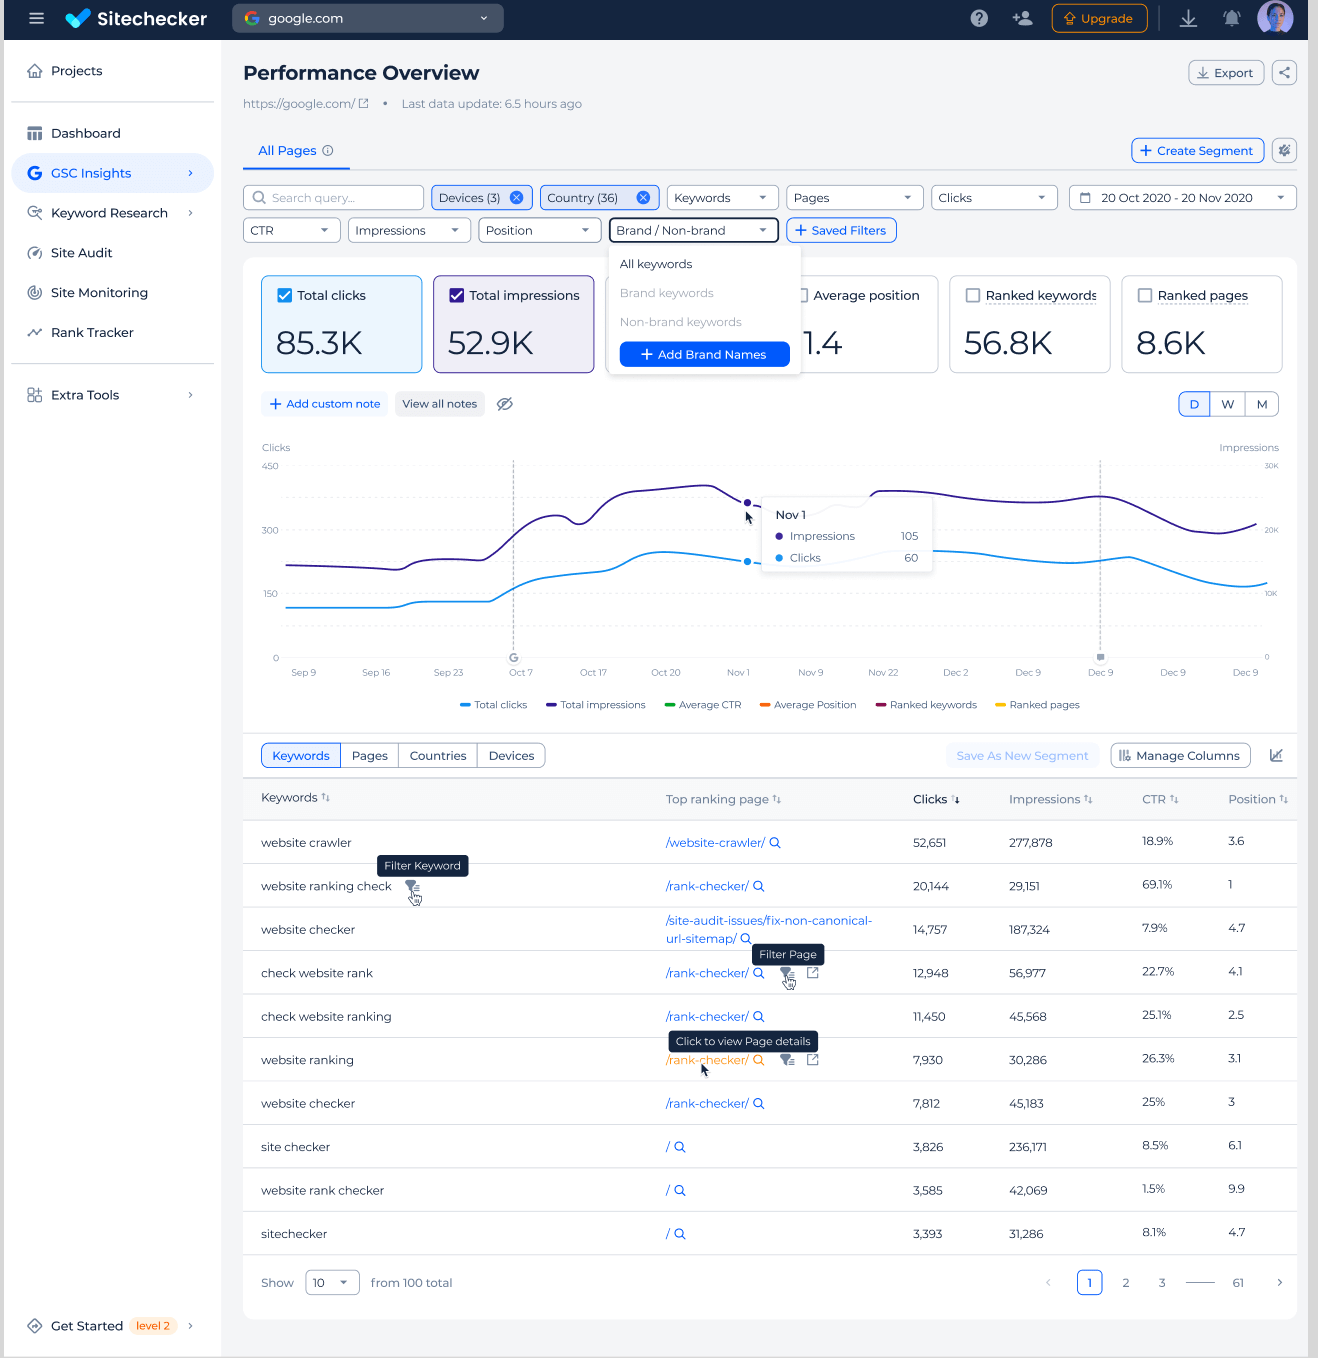
1. Sitechecker – the best Google Search Console dashboard for agencies
Here is why:
Get the complete picture of your search performance
No 1,000-row limits. No complex setup. Just data.
Access your entire Google Search Console dataset in one place. Sitechecker removes export caps and gives you up to 36 months of history, full keyword and page coverage, and instant exports without using Looker Studio, BigQuery, or code. Finally, see the complete story of your organic visibility.
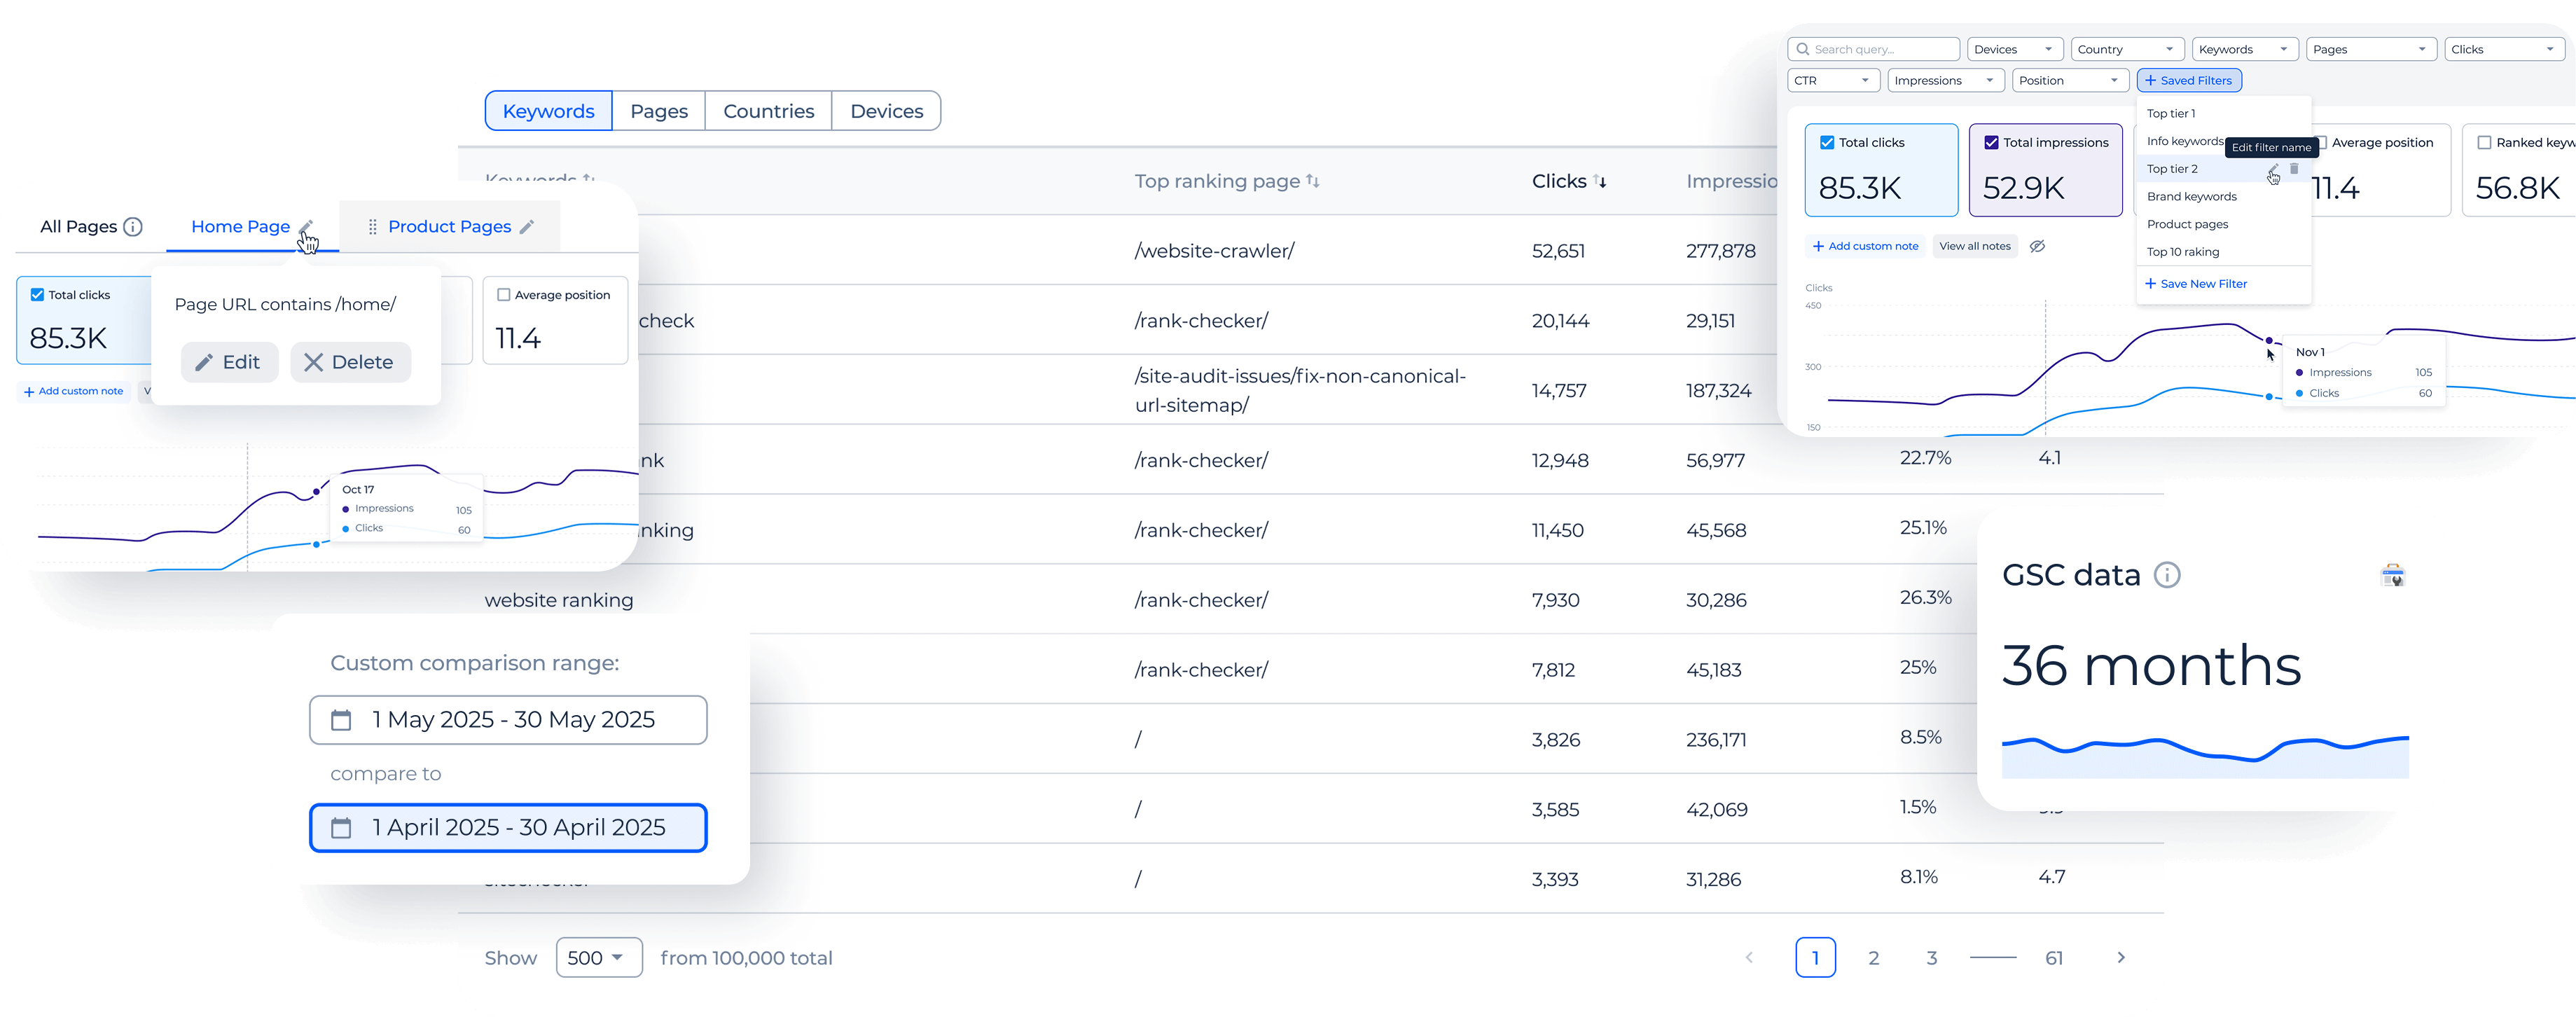
Analyze faster with smart filters
Find what matters in seconds. Filter and combine data by CTR, clicks, impressions, position, country, or device, with no restrictions. Create reusable segments like “US + Mobile with CTR <1%” or “Keywords ranked 4-10”.
Save them once and apply in one click to spot ranking gaps, low-CTR pages, or missed opportunities.
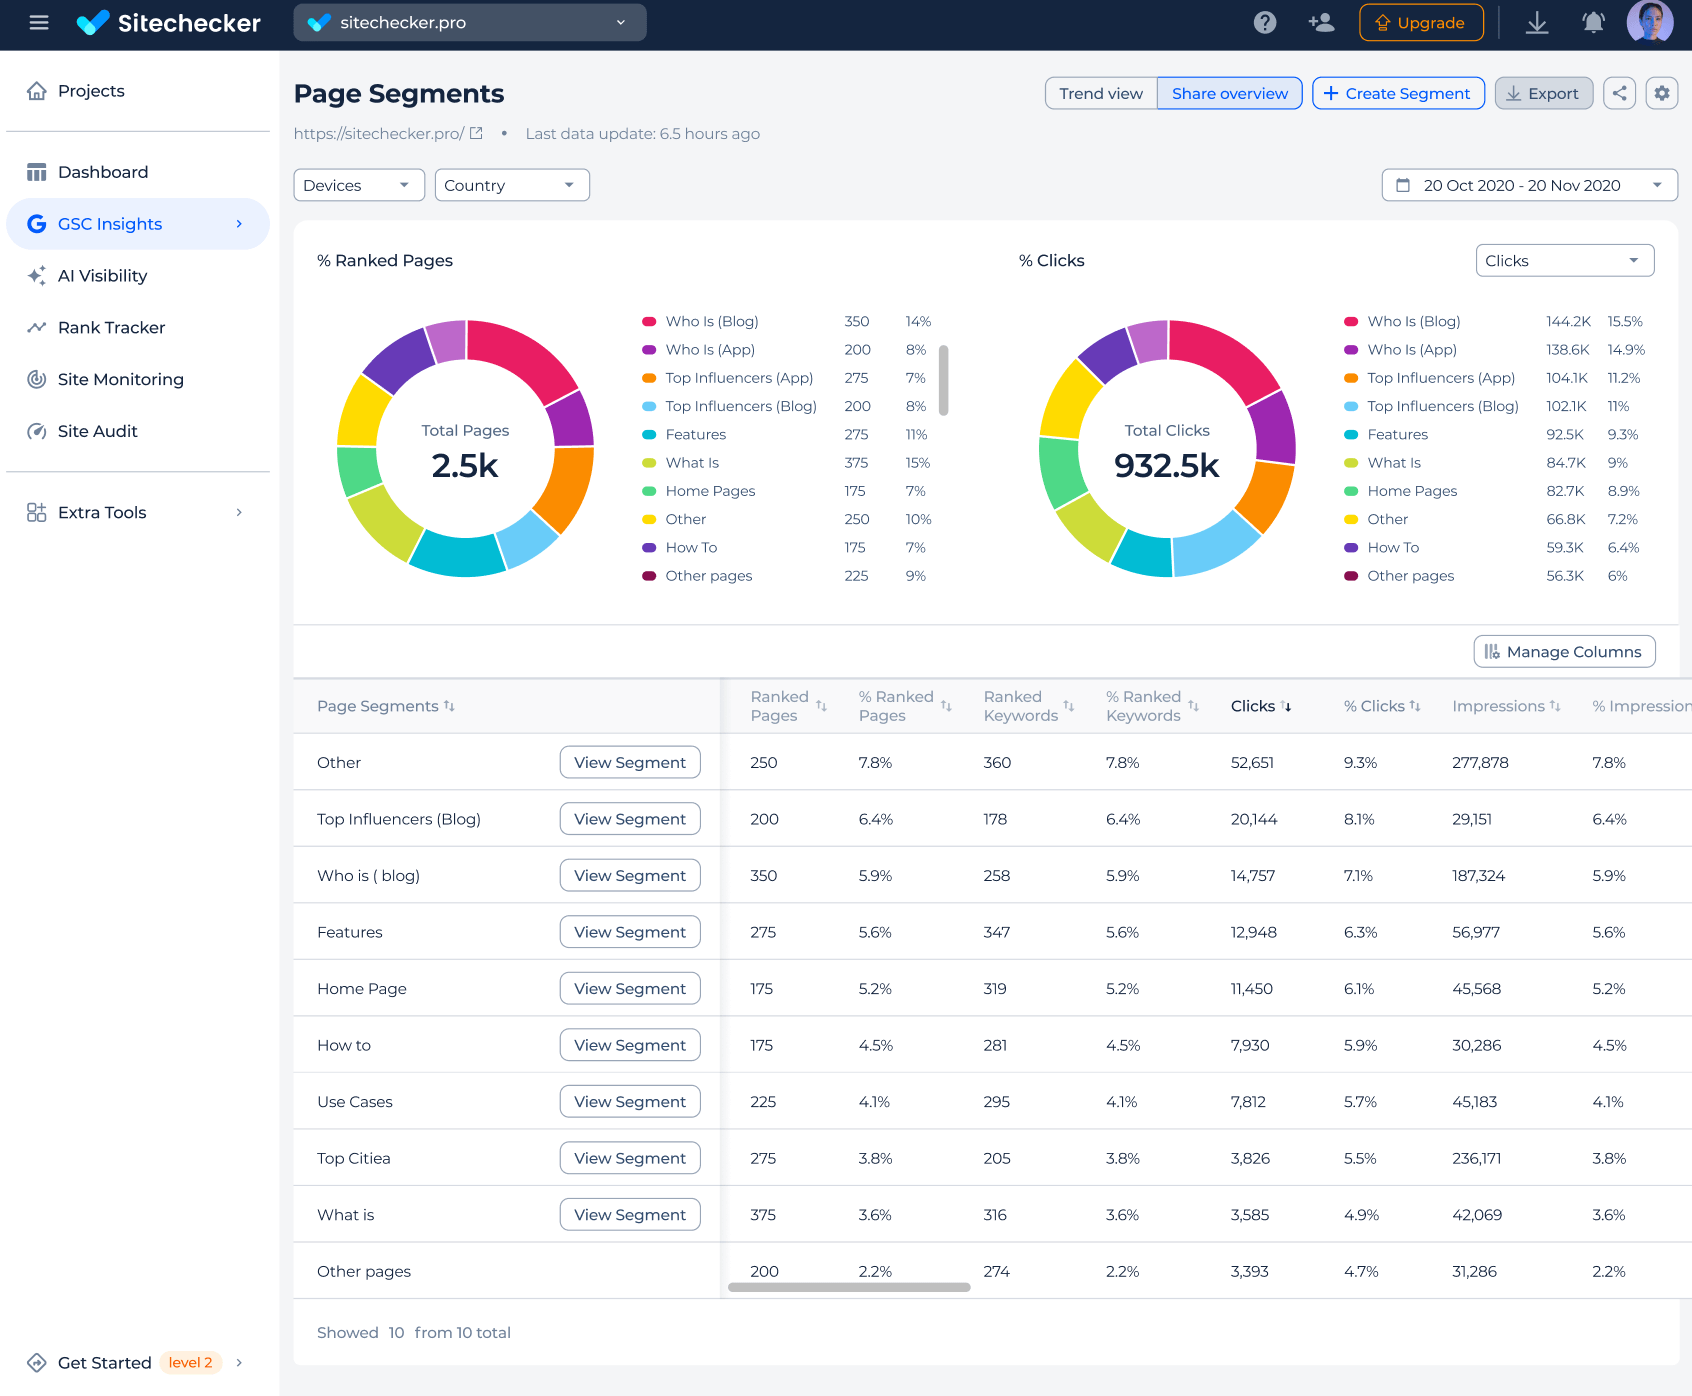
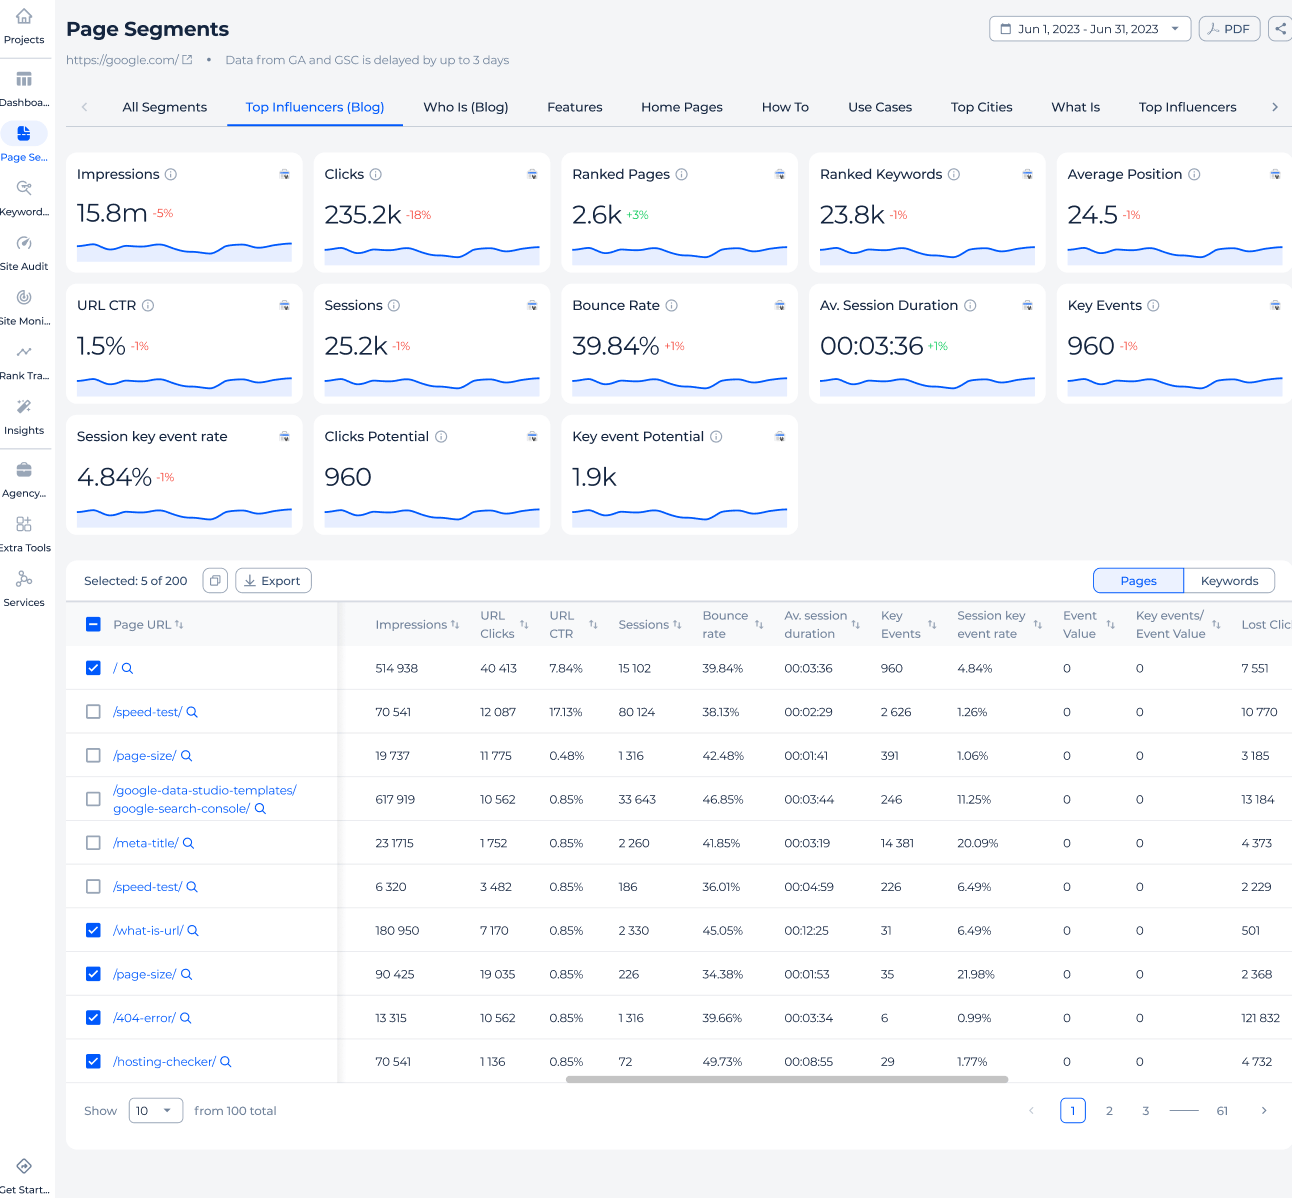
Analyze performance by segments
Group pages by type or purpose to see how each section of your site performs. Compare clicks, CTR, and rankings for blogs, products, or landing pages in one view.
Easily spot top-performing sections and growth opportunities with clear, actionable insights.
Discover insights & ready-made reports
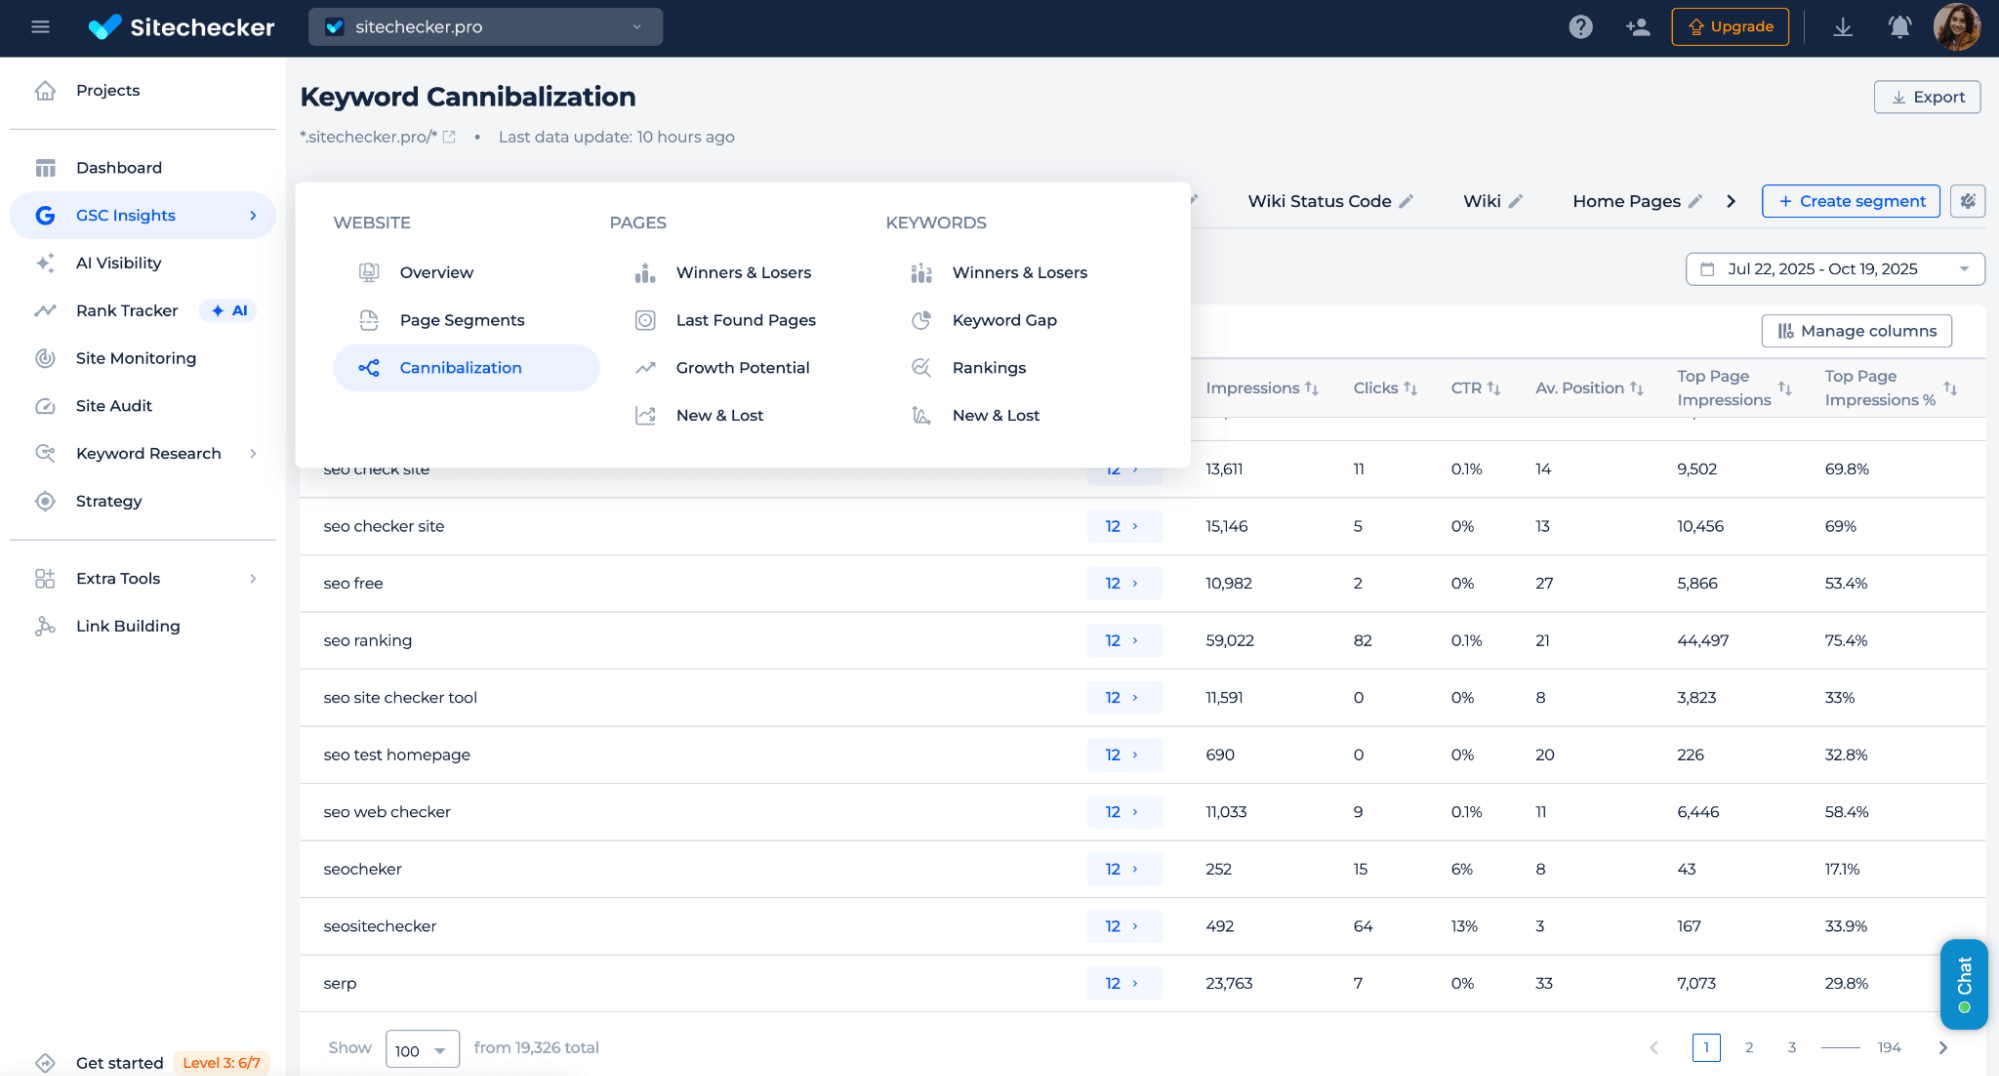
Turn raw GSC data into clear answers. The GSC Insights section in Sitechecker automatically organizes your data into actionable reports, so no setup or formulas are required.
You can see which pages lost or gained traffic, track new and dropped keywords, uncover growth potential, and detect keyword cannibalization between pages.
Each report highlights clicks, impressions, and ranking changes so you can act fast. It’s like having an SEO analyst built into your dashboard, always showing what deserves your attention next.
White-label Google Search Console dashboards
Deliver professional SEO insights under your own brand. Sitechecker’s GSC dashboards, charts, and reports can be fully white-labeled, perfect for agencies managing multiple clients.
Add your logo, brand colors, custom domain, and share dashboards or export reports that look 100% yours. Clients see clean, branded data views without external tool names or setup hassle.
It’s the fastest way to provide transparent, automated SEO reporting while keeping your brand front and center.
2. DashThis
DashThis is a general marketing reporting tool that integrates with Google Search Console to display key metrics such as clicks, impressions, CTR, and average position.
Its focus is on data visualization, not deep SEO analysis. Dashboards are built from predefined widgets and rely on GSC’s standard API output.
Pros:
✅ Easy connection to Google Search Console
✅ Basic performance metrics visible in one dashboard
✅ Automated report sharing via email or live link
Cons:
❌ Still limited by GSC’s 1,000-row and 16-month data restrictions
❌ No advanced filters, keyword–page mapping, or insights
❌ Templates and layouts offer minimal customization
DashThis works as a basic GSC visualization layer, but lacks the analytical depth, segmentation, and flexibility required for detailed SEO reporting.
3. Geckoboard
Geckoboard is a business KPI dashboard tool with a Google Search Console integration for displaying top-level SEO metrics like clicks, impressions, CTR, and average position.
The platform focuses on real-time visualization, allowing teams to monitor performance at a glance rather than perform in-depth analysis.
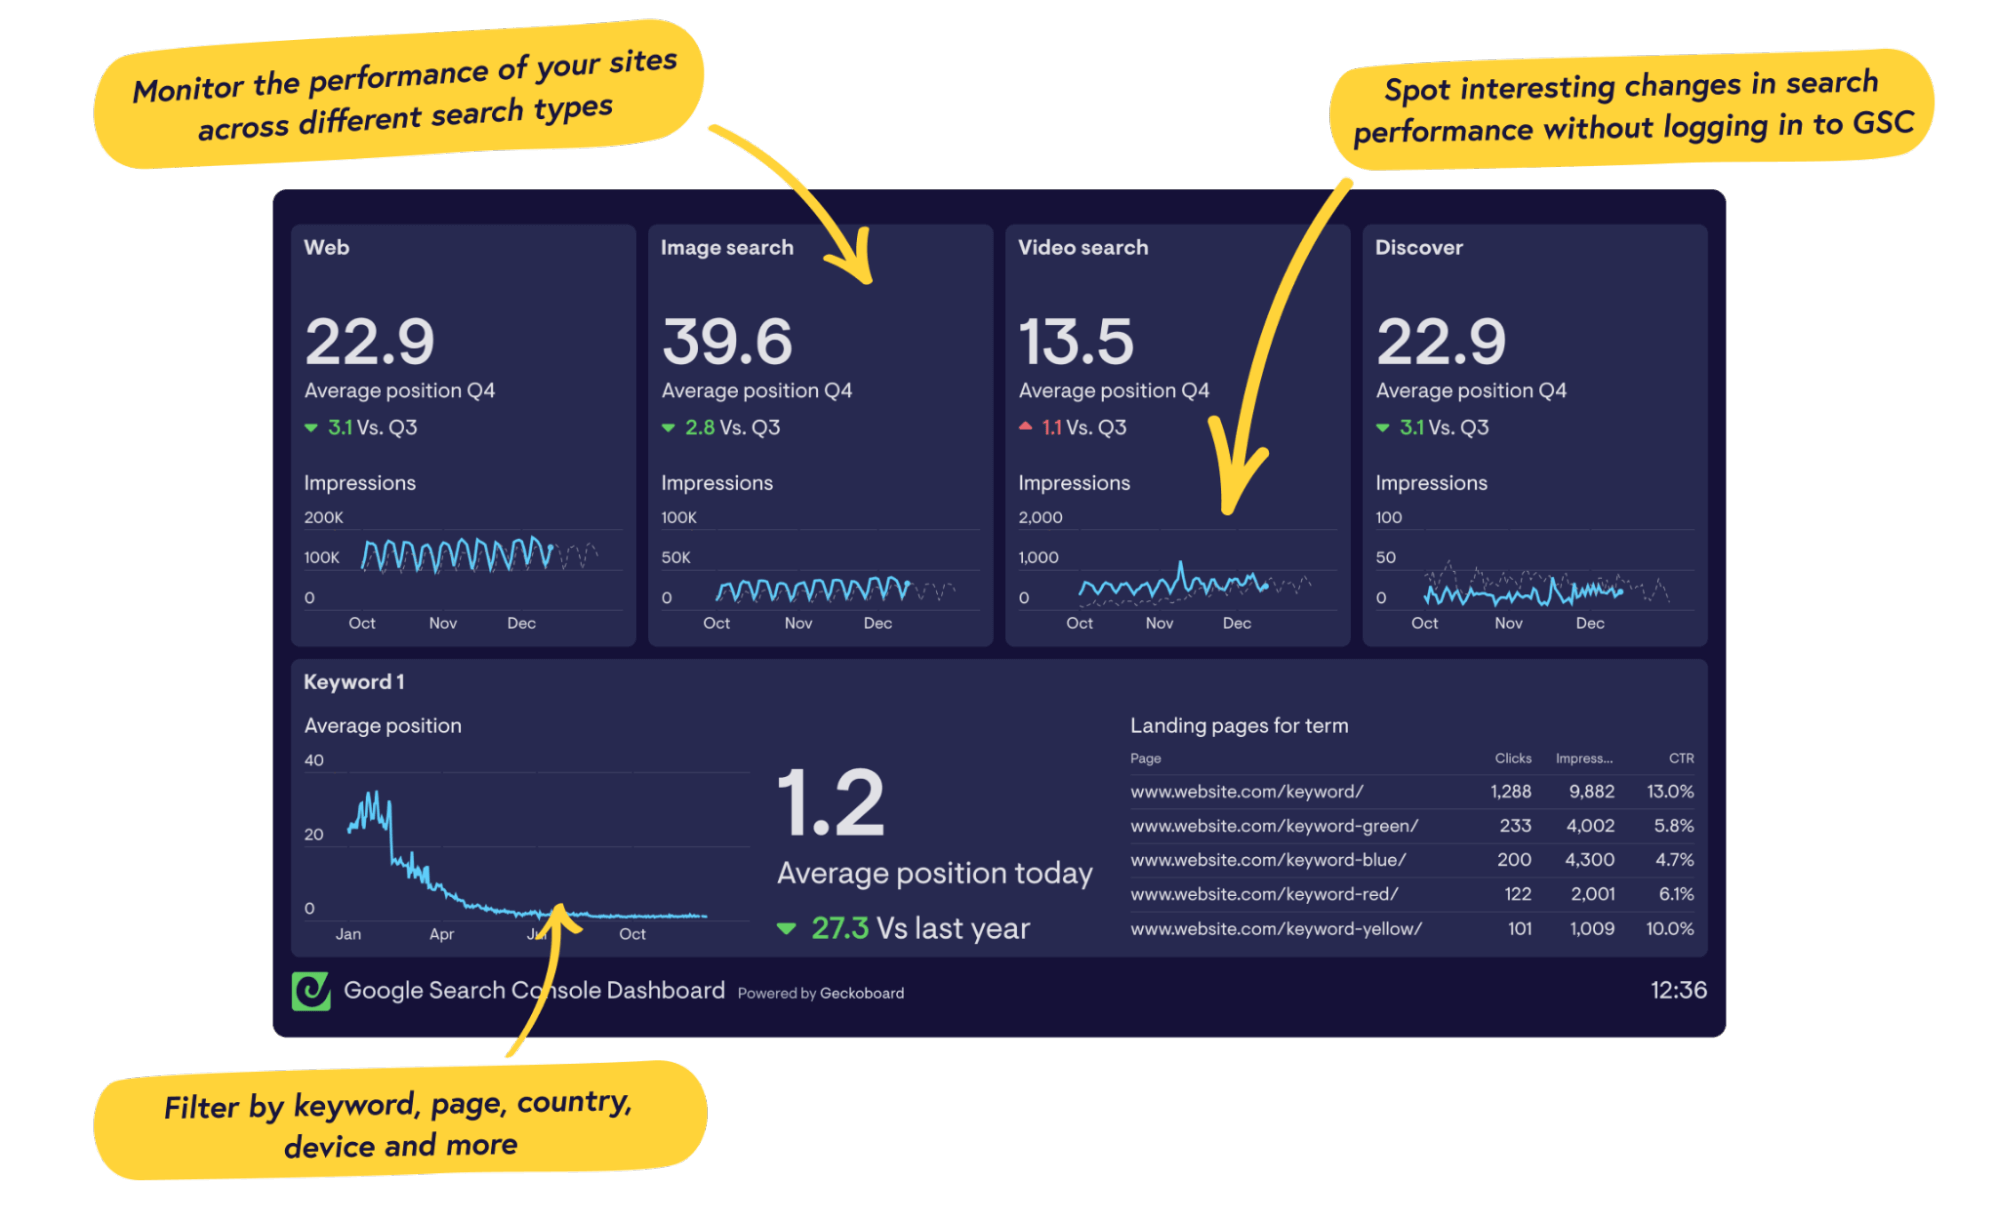
Pros:
✅ Simple connection to GSC
✅ Clear visual widgets for quick KPI tracking
✅ Easy to display dashboards on team screens
Cons:
❌ Limited to GSC’s standard API data (1,000-row and 16-month limits)
❌ No advanced SEO filters, keyword–page insights, or segmentation
❌ Dashboards prioritize visualization over actionable SEO data
Geckoboard is suitable for teams that need surface-level visibility of GSC metrics but not detailed analysis, insights, or historical trend tracking.
4. Coupler.io + Looker Studio
Coupler.io provides a data connector that transfers Google Search Console data into Looker Studio for custom visualization.
This setup gives complete control over dashboard structure and metrics but requires manual configuration and some technical knowledge to manage API connections and templates.
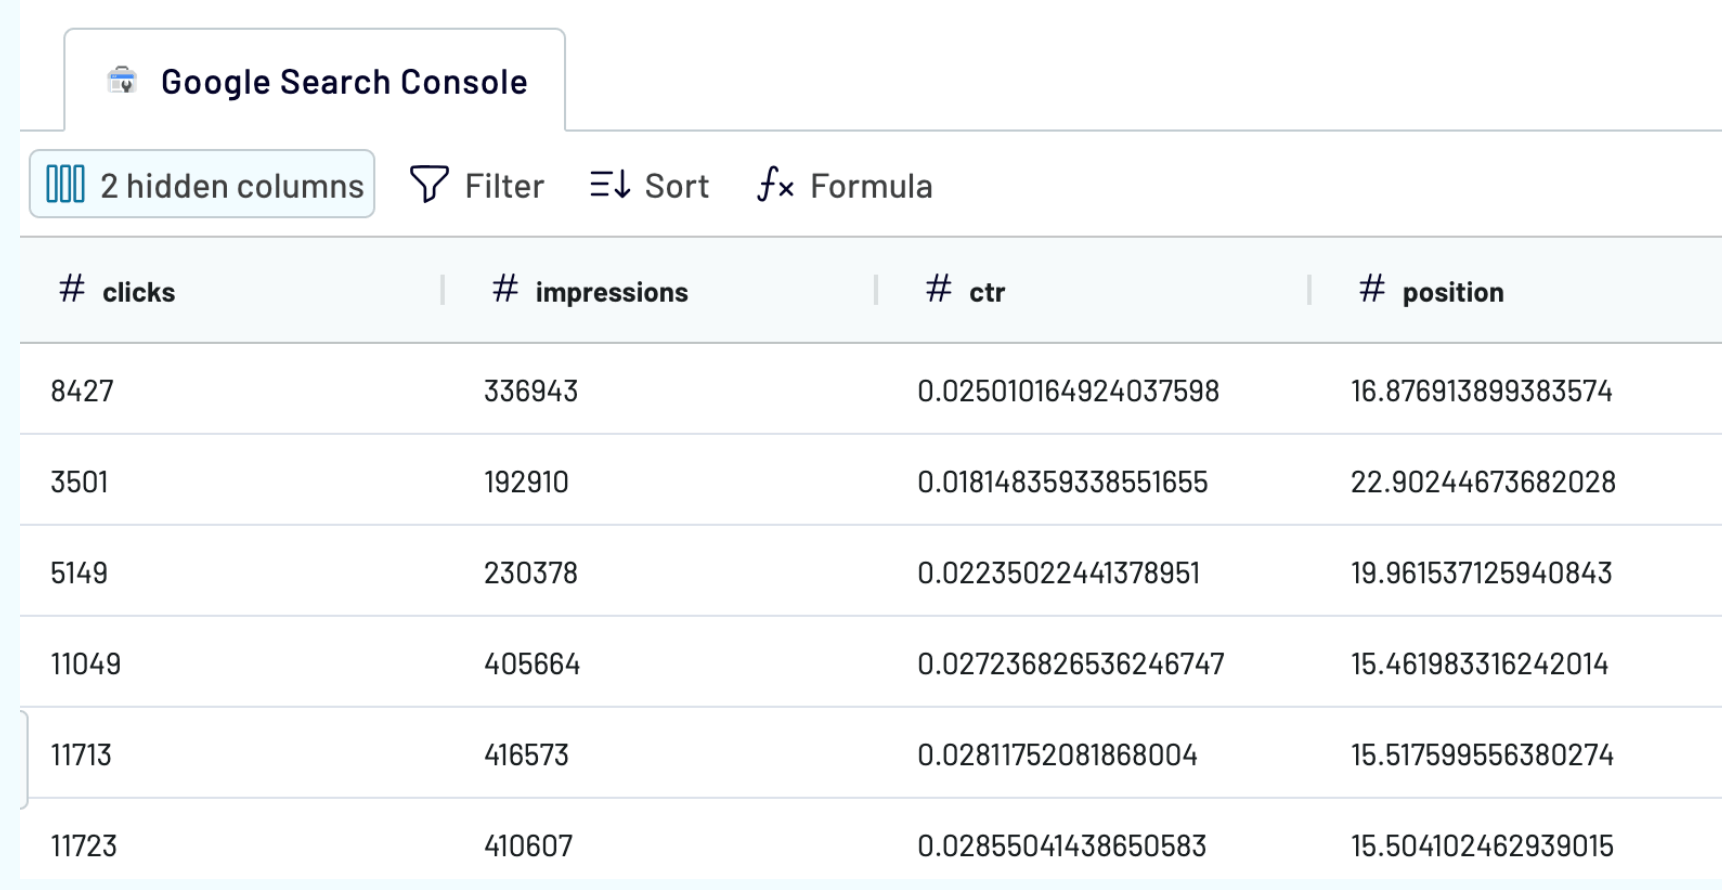
Pros:
✅ Full data export from GSC without row limits
✅ Flexible dashboards built in Looker Studio
✅ Supports combining multiple data sources (GA4, GSC, Ads, etc.)
Cons:
❌ Requires setup of API connectors and manual configuration
❌ No pre-built SEO insights or keyword–page mapping
❌ Maintenance needed to keep dashboards functional and up to date
Coupler.io with Looker Studio is best for analysts or technical SEO specialists who want to build fully custom GSC dashboards but are willing to invest in additional setup and maintenance.
5. Nozzle GSC dashboard
Nozzle offers a Google Search Console Overview Dashboard that integrates GSC data directly into its SEO platform. It displays clicks, impressions, CTR, and average position for keywords and pages, allowing basic performance monitoring without switching tools.
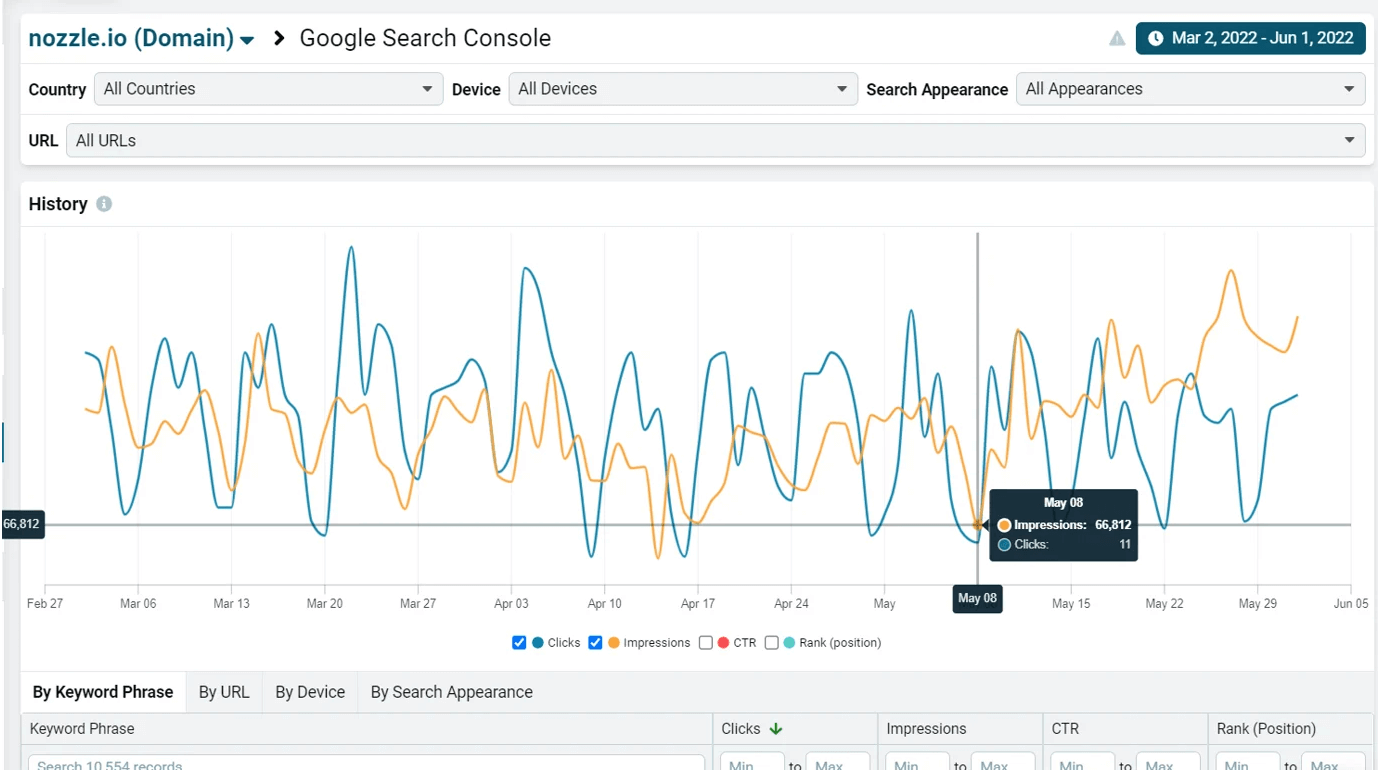
Pros:
✅ Direct GSC integration inside the Nozzle interface
✅ Simple visualization of keyword and page metrics
✅ Filters by country, device, and date range
Cons:
❌ Limited to standard GSC API scope (1,000 rows, 16-month history)
❌ No advanced segmentation, insights, or saved reports
❌ Long-term data storage and trend comparison are still in development
Nozzle’s GSC Dashboard is helpful for quick visibility checks within the platform, but it lacks the analytical depth and historical coverage needed for agency-level reporting.
Final idea
Google Search Console’s 1,000-row limit and 16-month history weren’t designed for professional SEO reporting. The right dashboard tool transforms GSC from a basic monitoring panel into a strategic asset. Sitechecker delivers complete data access and white-label reports with zero setup. DashThis and Geckoboard work well for multi-channel marketing teams. Coupler.io with Looker Studio offers maximum customization for technical users. The tools exist, and the data is available.
The only question is how much time you’ll spend fighting export limits versus improving SEO. Stop manually exporting spreadsheets and start delivering insights clients can act on.

![SEMrush vs Ahrefs: Comparison Chart and Main Features [2022]](https://sitechecker.pro/wp-content/uploads/2020/07/ahrefs-vs-semrush.png "SEMrush vs Ahrefs: Comparison Chart and Main Features [2022]")