")


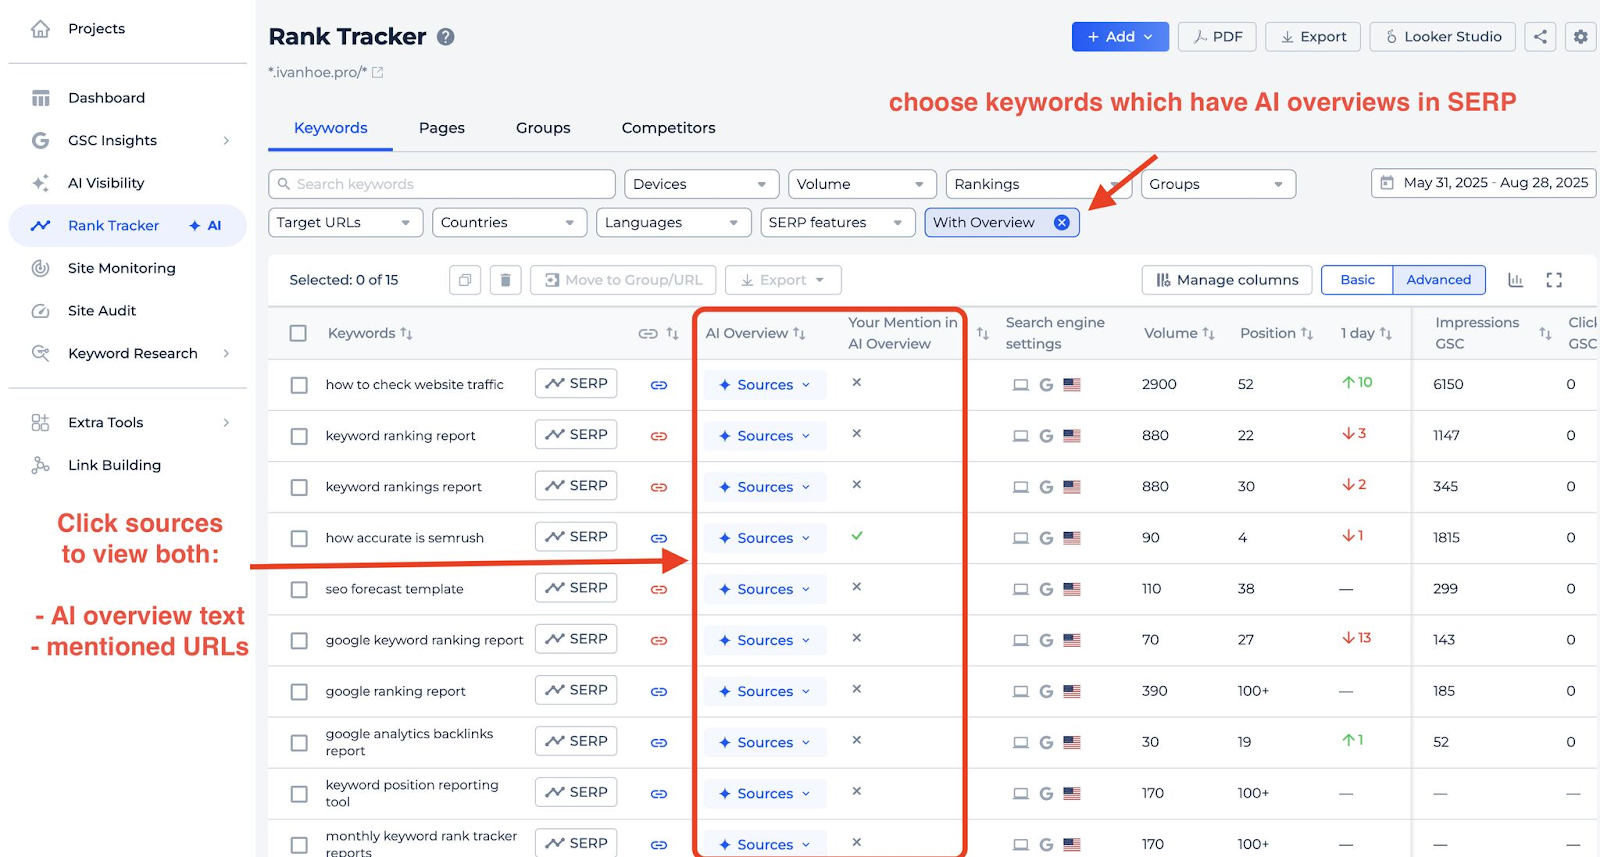
1. AI Overview tracking in Rank Tracker
This new feature lets you monitor whether your pages are being mentioned inside AI Overviews in Google Search.
Here’s what you can do with this new feature:
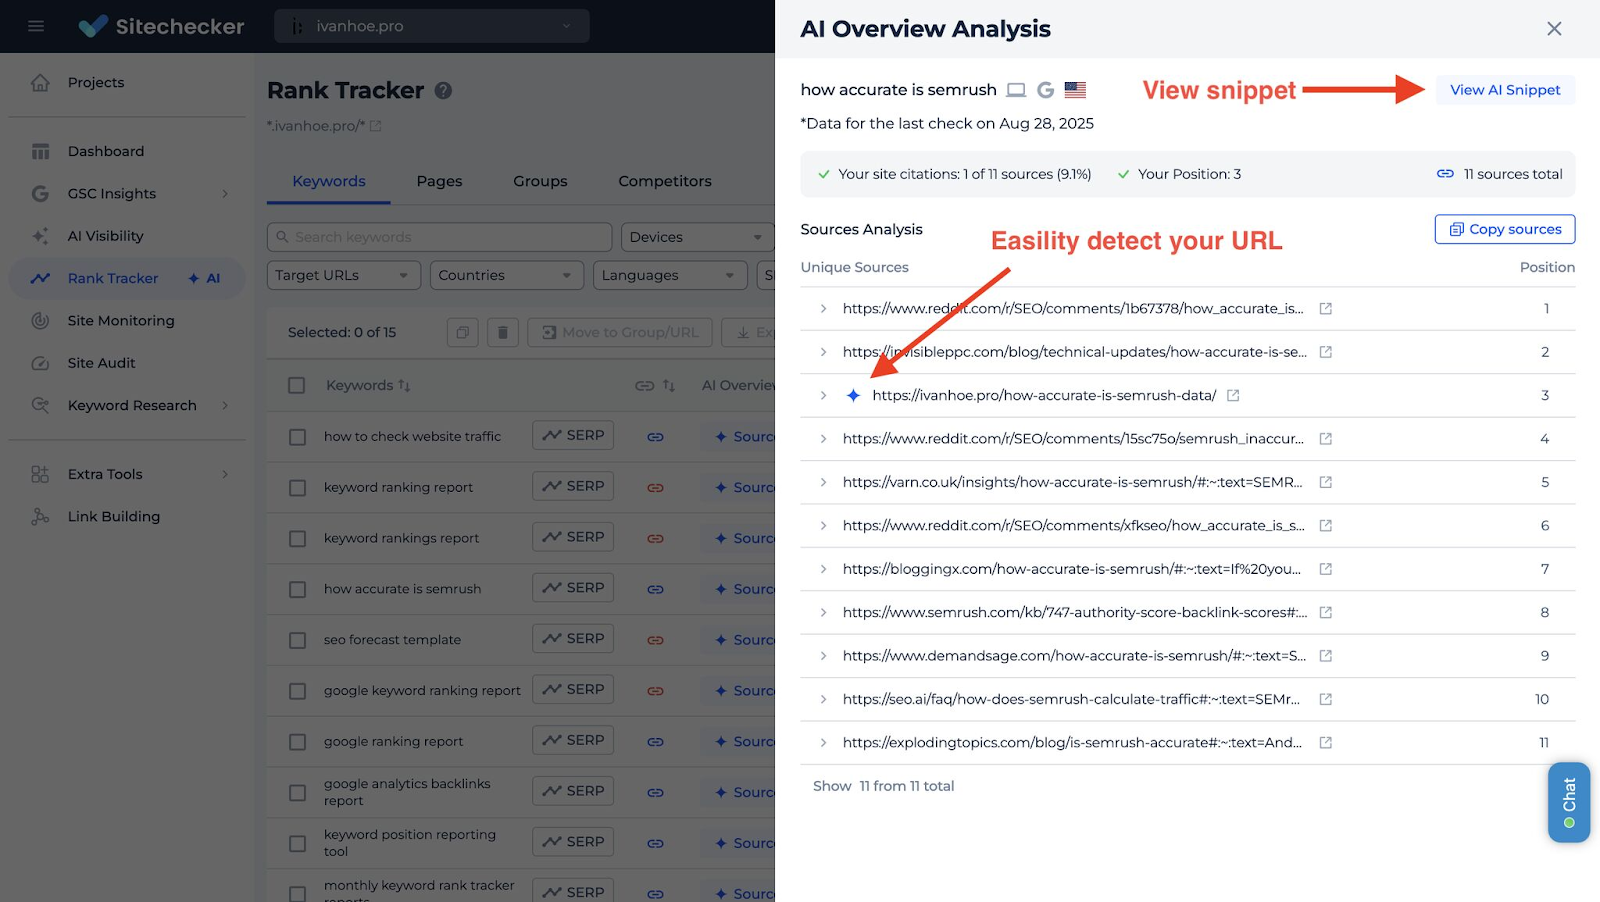
You can filter your keywords to instantly see which ones trigger AI Overviews and which don’t. For those that do, you can check if your URLs are cited, read the full AI snippet, and copy the list of sources that Google uses, all in one view.
You’ll find AI Overviews tracking inside Rank Tracker, available for all users on paid plans. If you haven’t tested it yet, now’s a great time to explore this new source of insights.
2. New reports based on GSC data
Keyword cannibalization report
We’ve launched a new report in the GSC Insights section to help you find and fix cases where multiple pages compete for the same keyword.
That confusion splits impressions, clicks, and can lead to lower rankings overall.
This report solves that. It automatically scans your GSC data and shows all keywords that are ranked by two or more different pages.
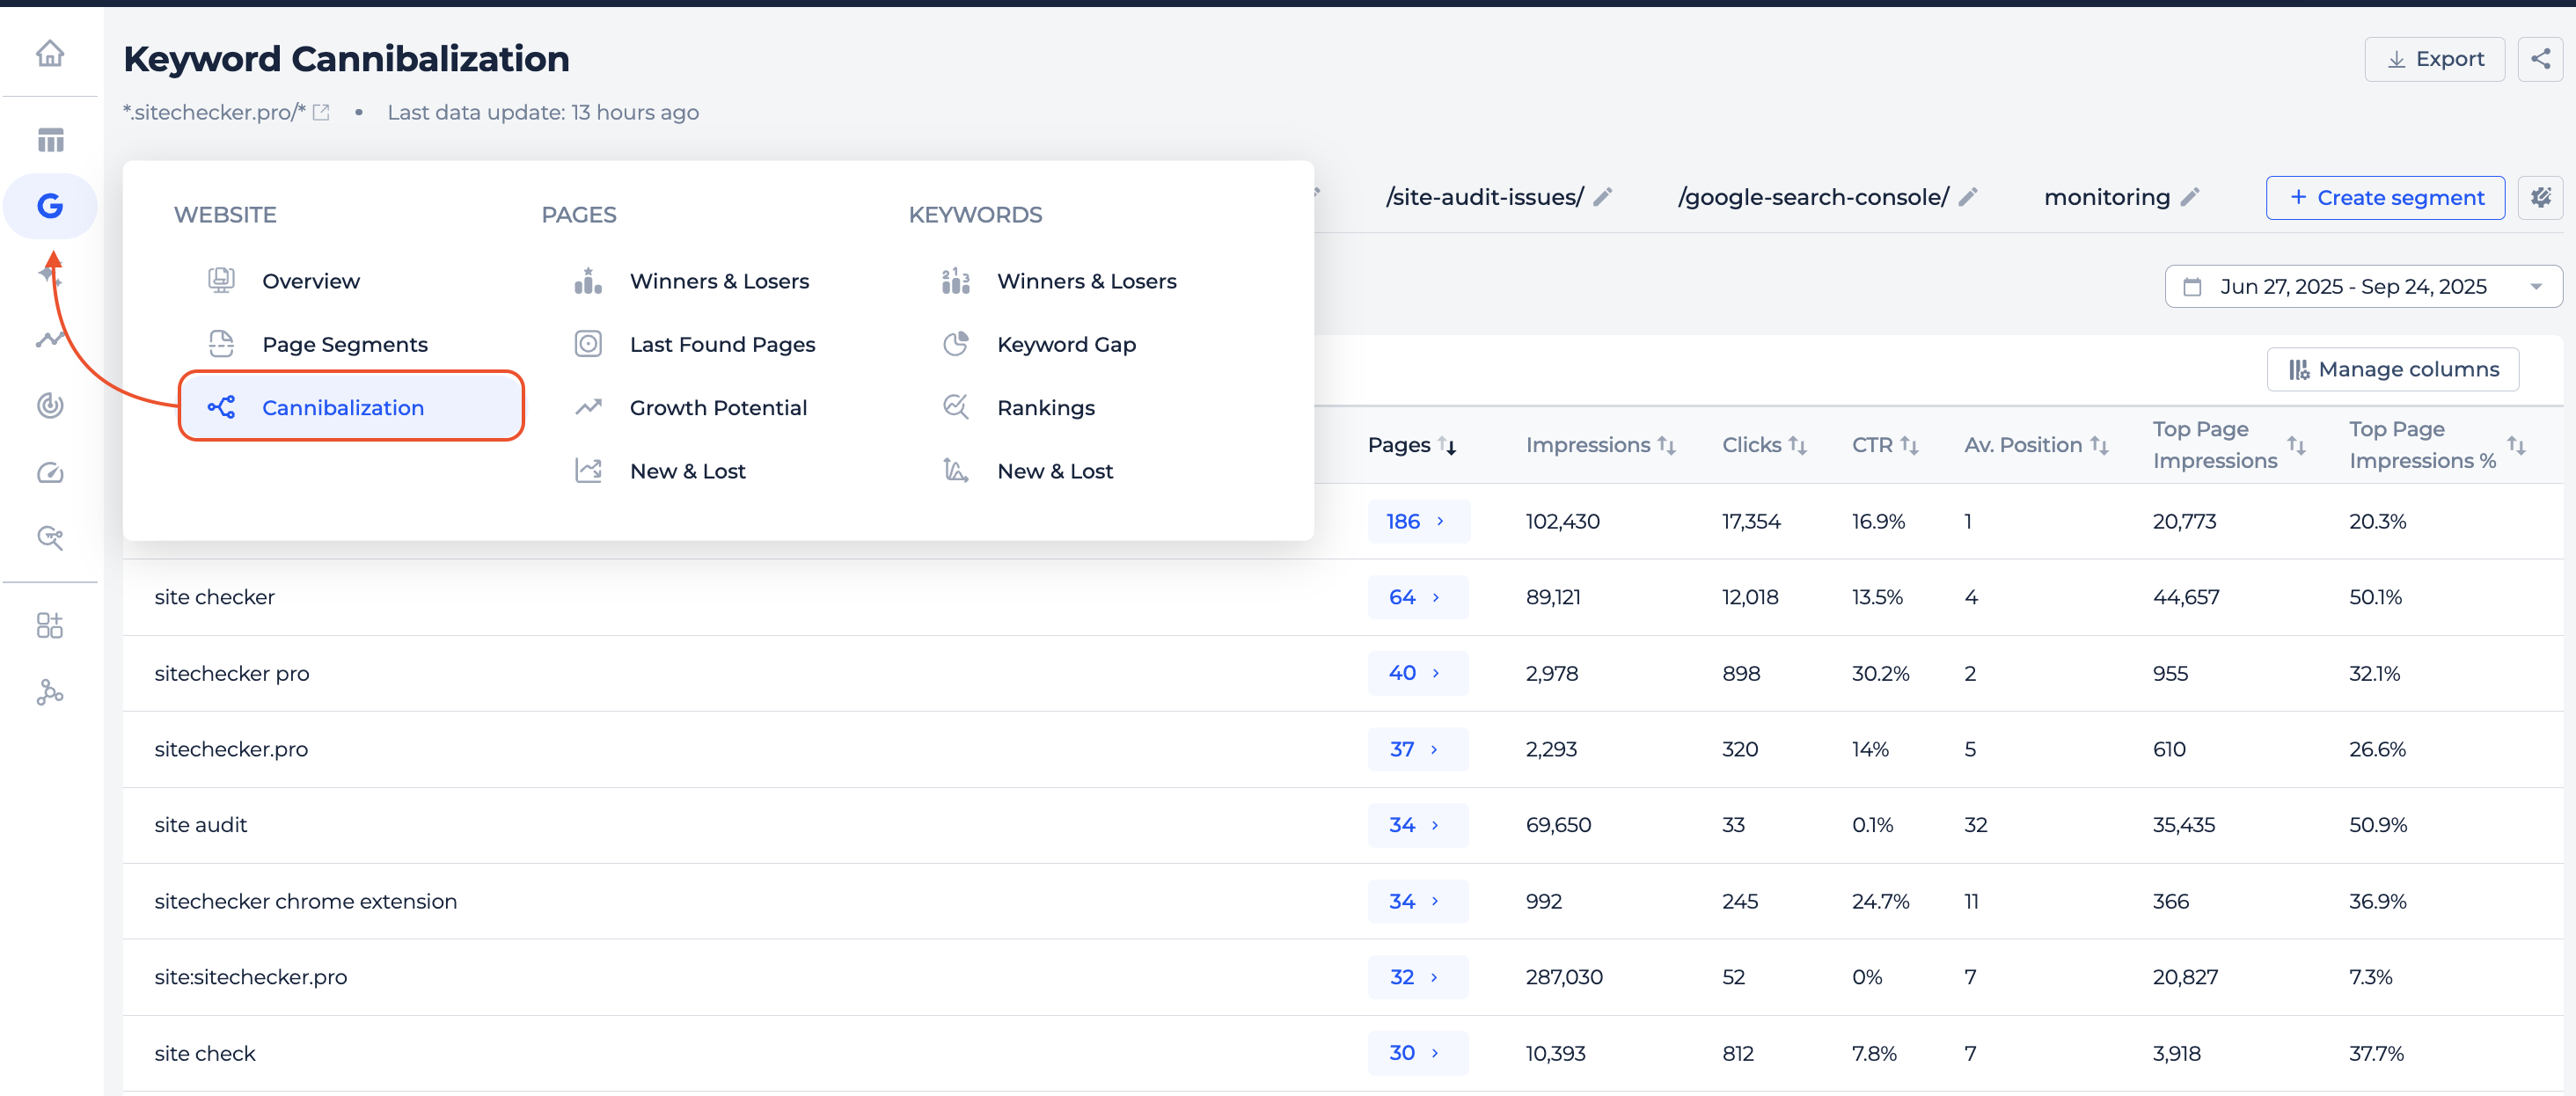
For each keyword, you’ll see the number of competing pages, search metrics like clicks, impressions, CTR, and average position, plus a new metric: Impression Share of the top-ranking page.
This lets you instantly understand if the traffic is concentrated on a single dominant URL (which might be okay) or if it’s evenly spread across multiple pages (which usually signals a problem).
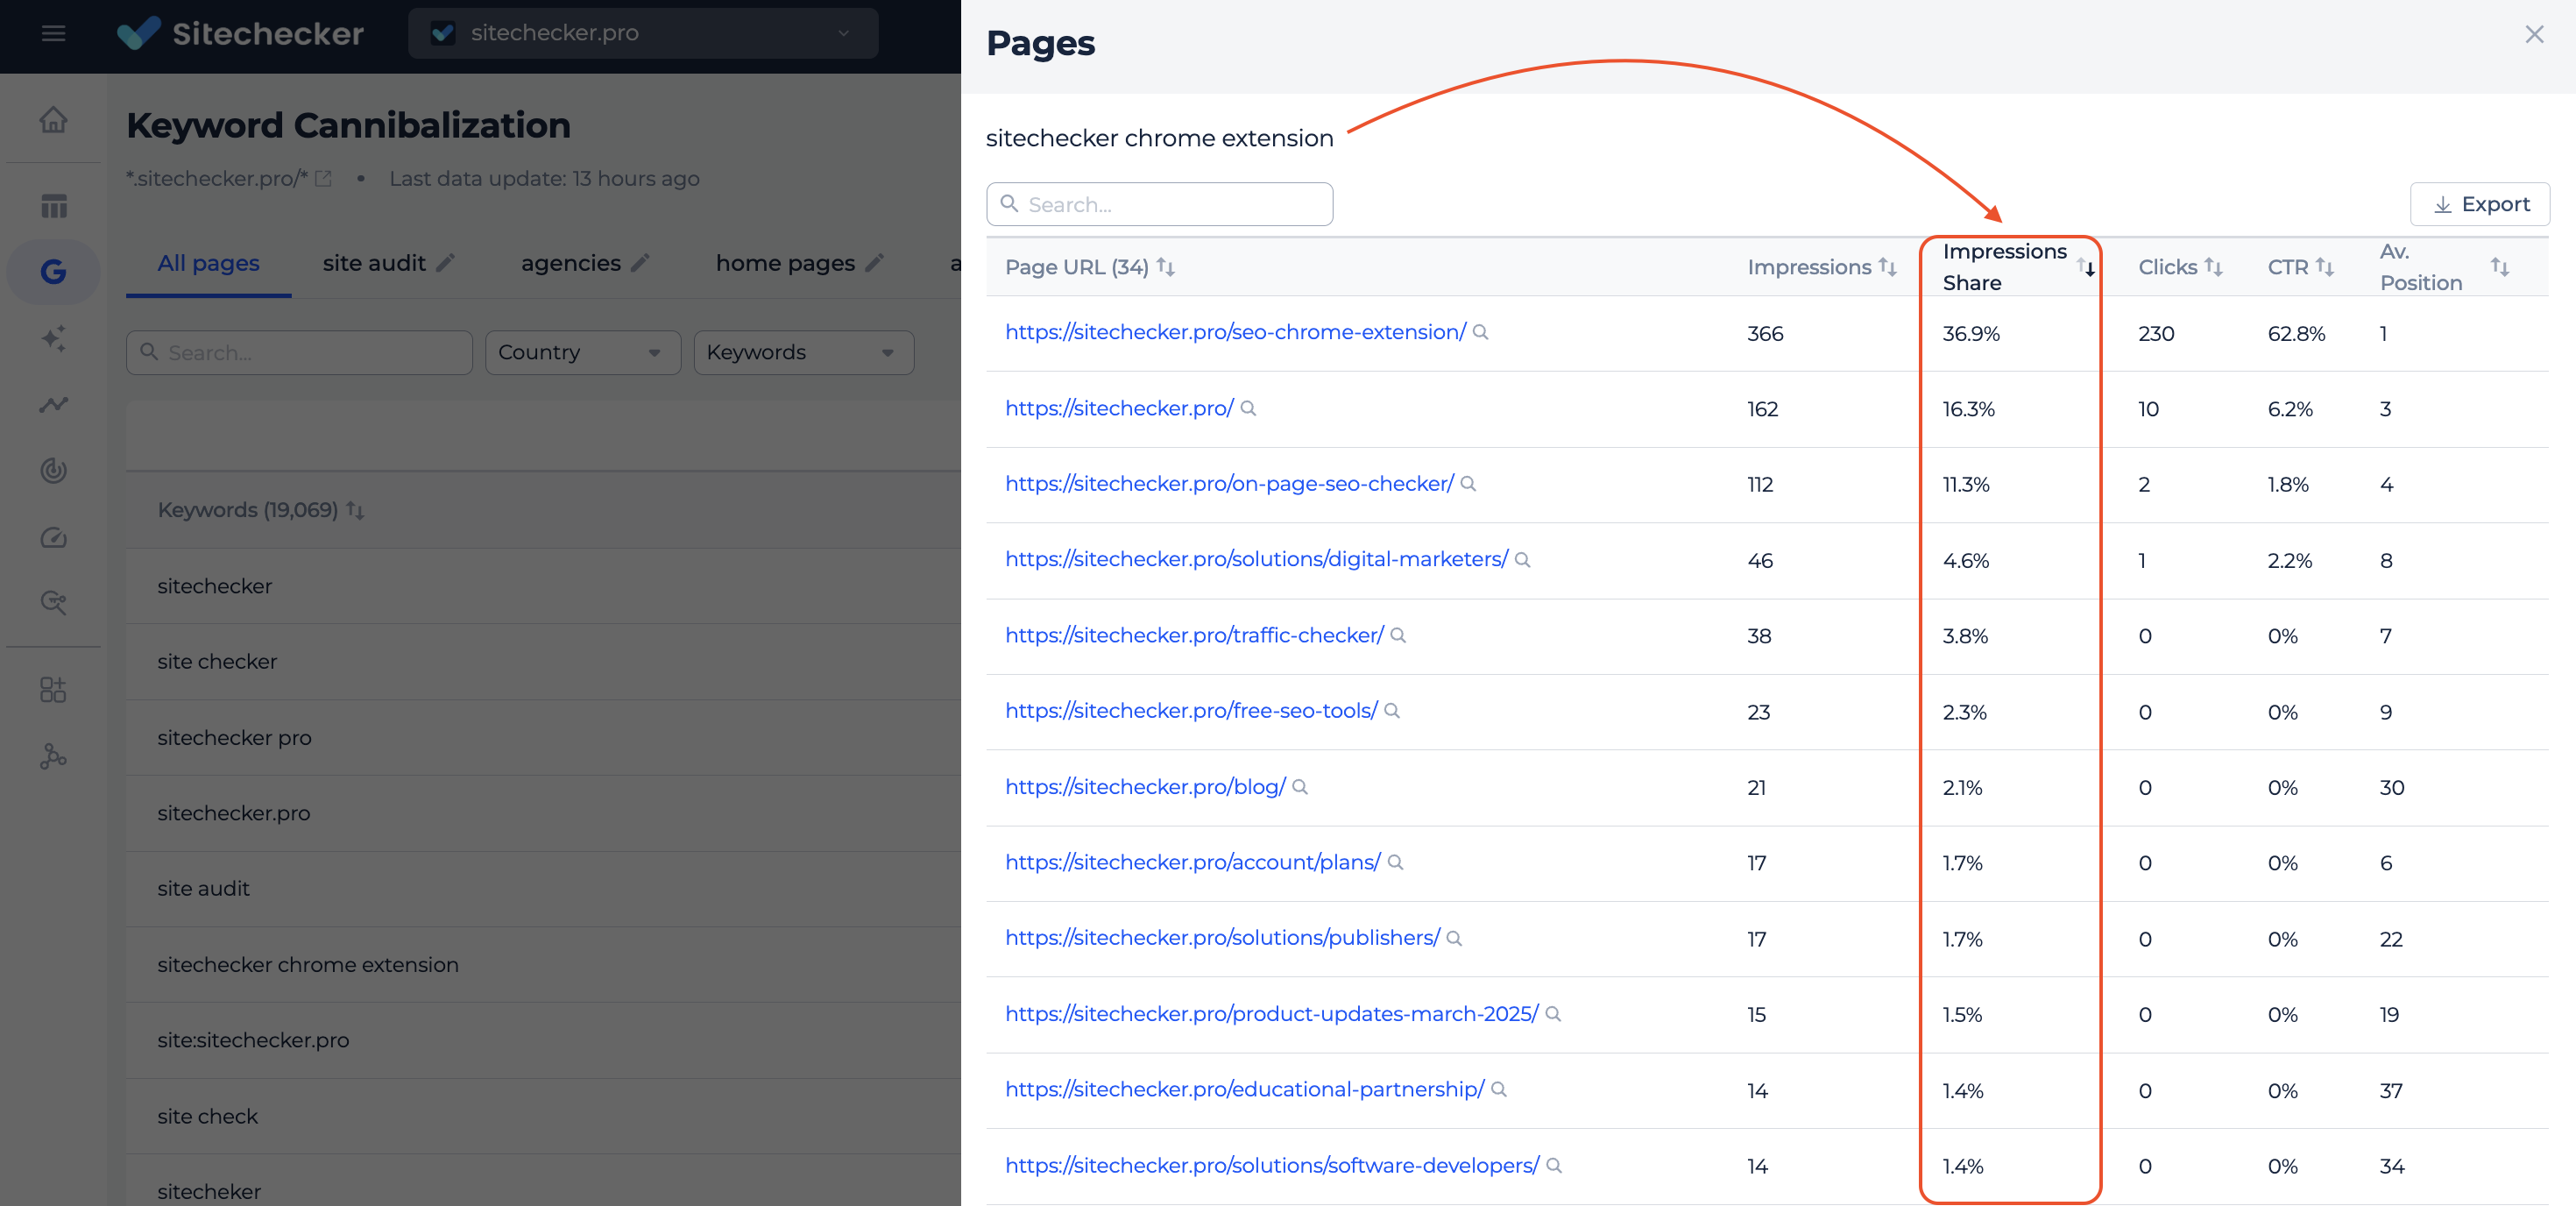
You can click on the page count to open a detailed popup, where you’ll see each ranking page for the selected keyword along with its own search metrics and Impression Share, sorted from highest to lowest. You can also jump directly to Page Details for any URL from within the pop-up.
Keyword gap report
This report will help you understand how well your most important pages are optimized for their most important keywords, and where there’s room to improve.
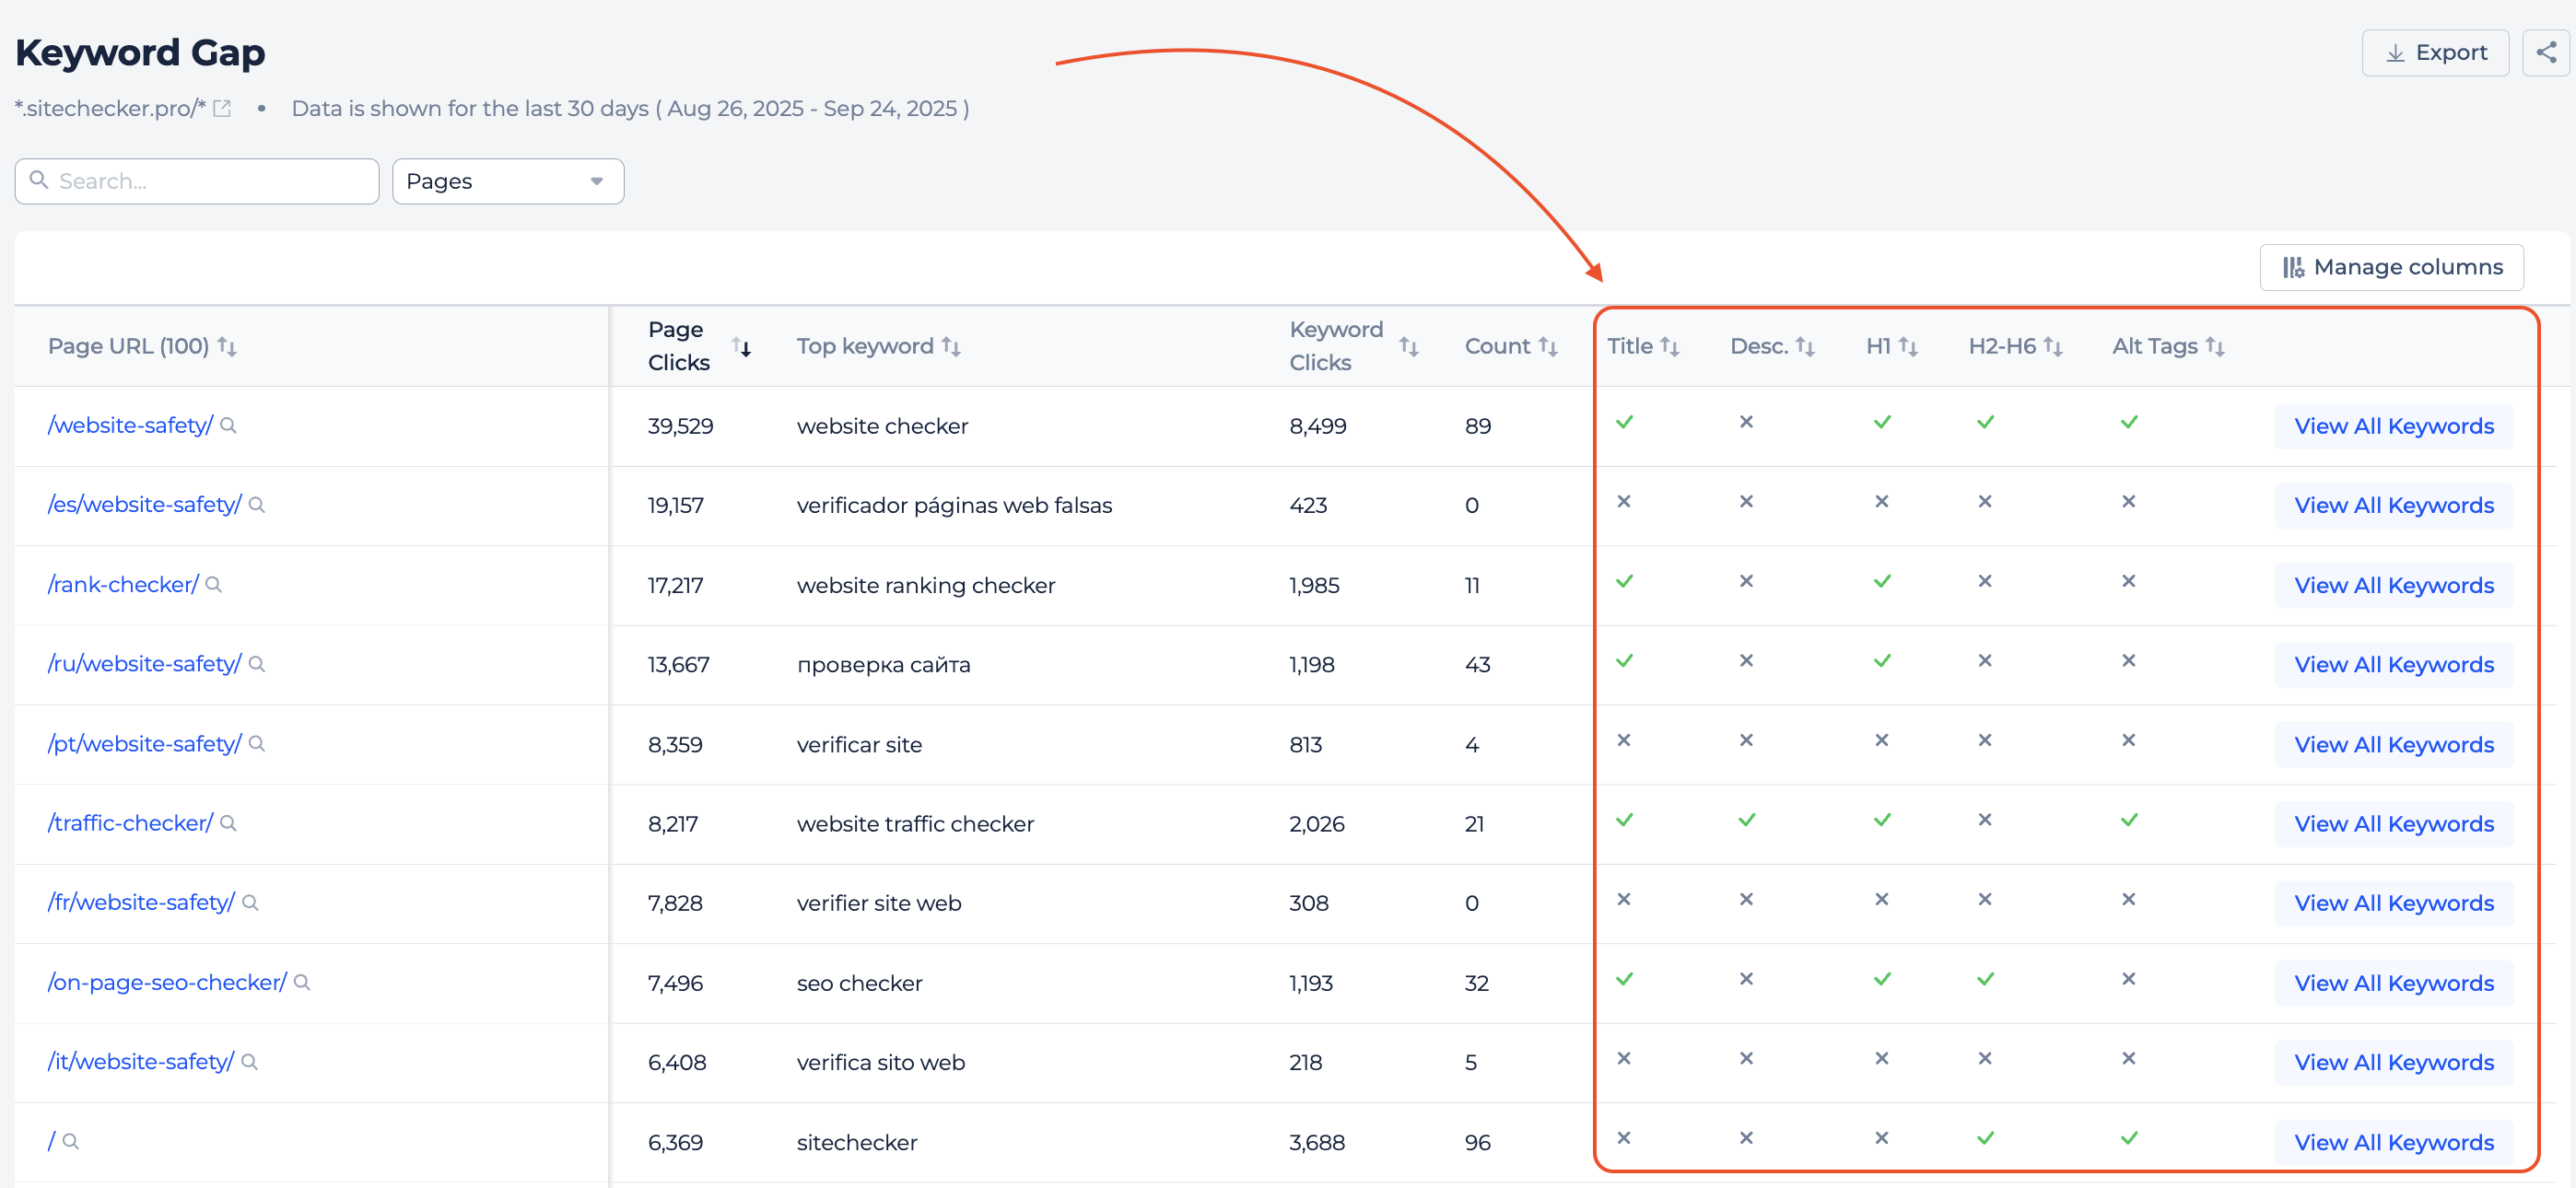
It analyzes the top 100 pages on your site by clicks over the last 30 days (based on GSC data), then pairs each one with its top-performing keyword from the Keyword Gap section inside Page Details.
For each page, we show the key SEO signals that still matter today: whether the keyword appears in the Title, H1, H2–H6 headers of the page or alt tags. You’ll also see all relevant GSC metrics, including clicks and impressions.
For sure one keyword is not enough for you to see the whole picture, so you can click View All Keywords to open a popup with all top 20 queries that drive traffic to that page.
This gives you two things: a quick way to validate whether your top pages are aligned with the queries that bring in traffic, and a fast method to catch under-optimized content that might be missing visibility potential.
New rankings report
Until now, you could only see a snapshot of rankings inside the Dashboard widget. It was helpful, but limited.
This report takes all your keywords from the selected time range (default: 30 days) and automatically packs them into ranking cohorts based on average position.
You can filter by any TOP range you want to focus on (e.g. just keywords in TOP 2–3), and both the chart and table will update accordingly.
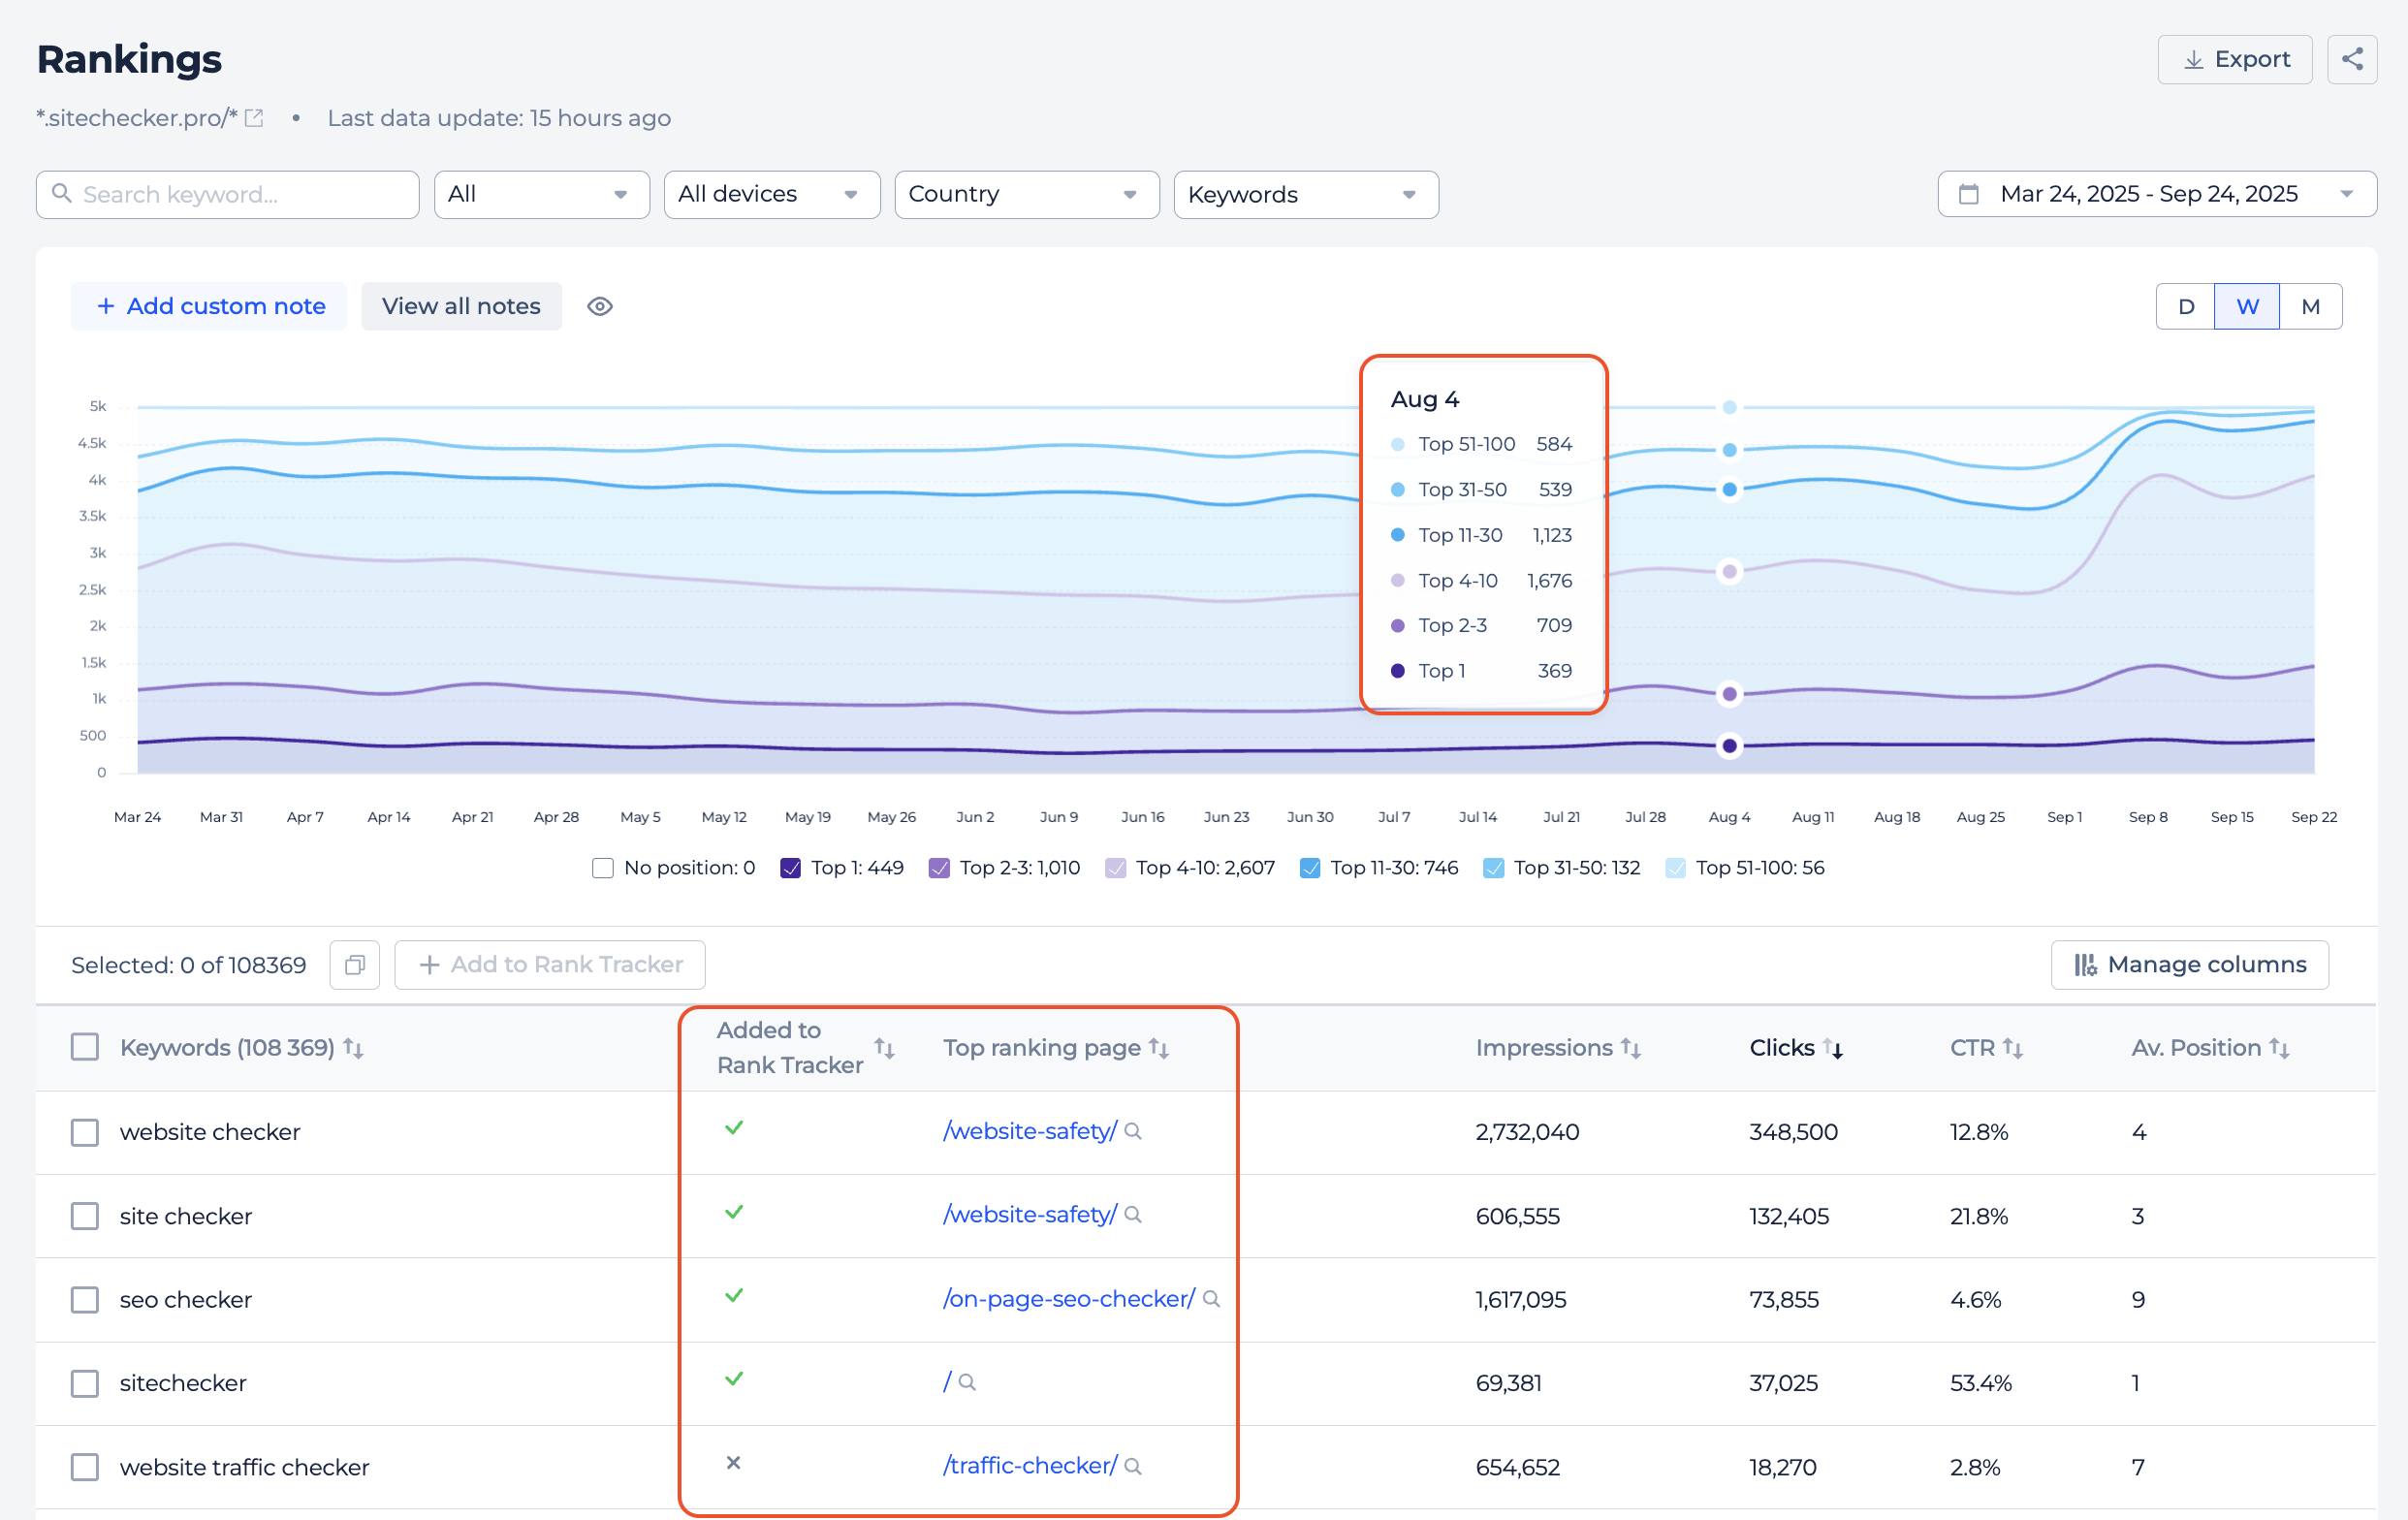
Each keyword includes standard search performance metrics like clicks, impressions, CTR, and average position, plus a few powerful extras like the top-ranking page for that keyword and a button to add selected keywords directly to Rank Tracker.
You can also search and filter keywords by country, device, and position group, or manage visible columns just like in other parts of the app.
For users who want to explore trends visually, the report includes a dynamic chart showing how your keyword distribution changes over time. You can toggle TOP ranges on or off and switch between daily, weekly, and monthly views. All with annotations and tooltips for easier insight discovery.
Last found pages
The Last Found Pages report in GSC Insights is now even more powerful, giving you insights you won’t find in the native Google Search Console.
By combining crawler discovery with GSC performance data, it shows exactly when new pages were found and whether they are already driving impressions or clicks.
If not, you can quickly check if the page is indexable and crawlable in the URL inspection tool.
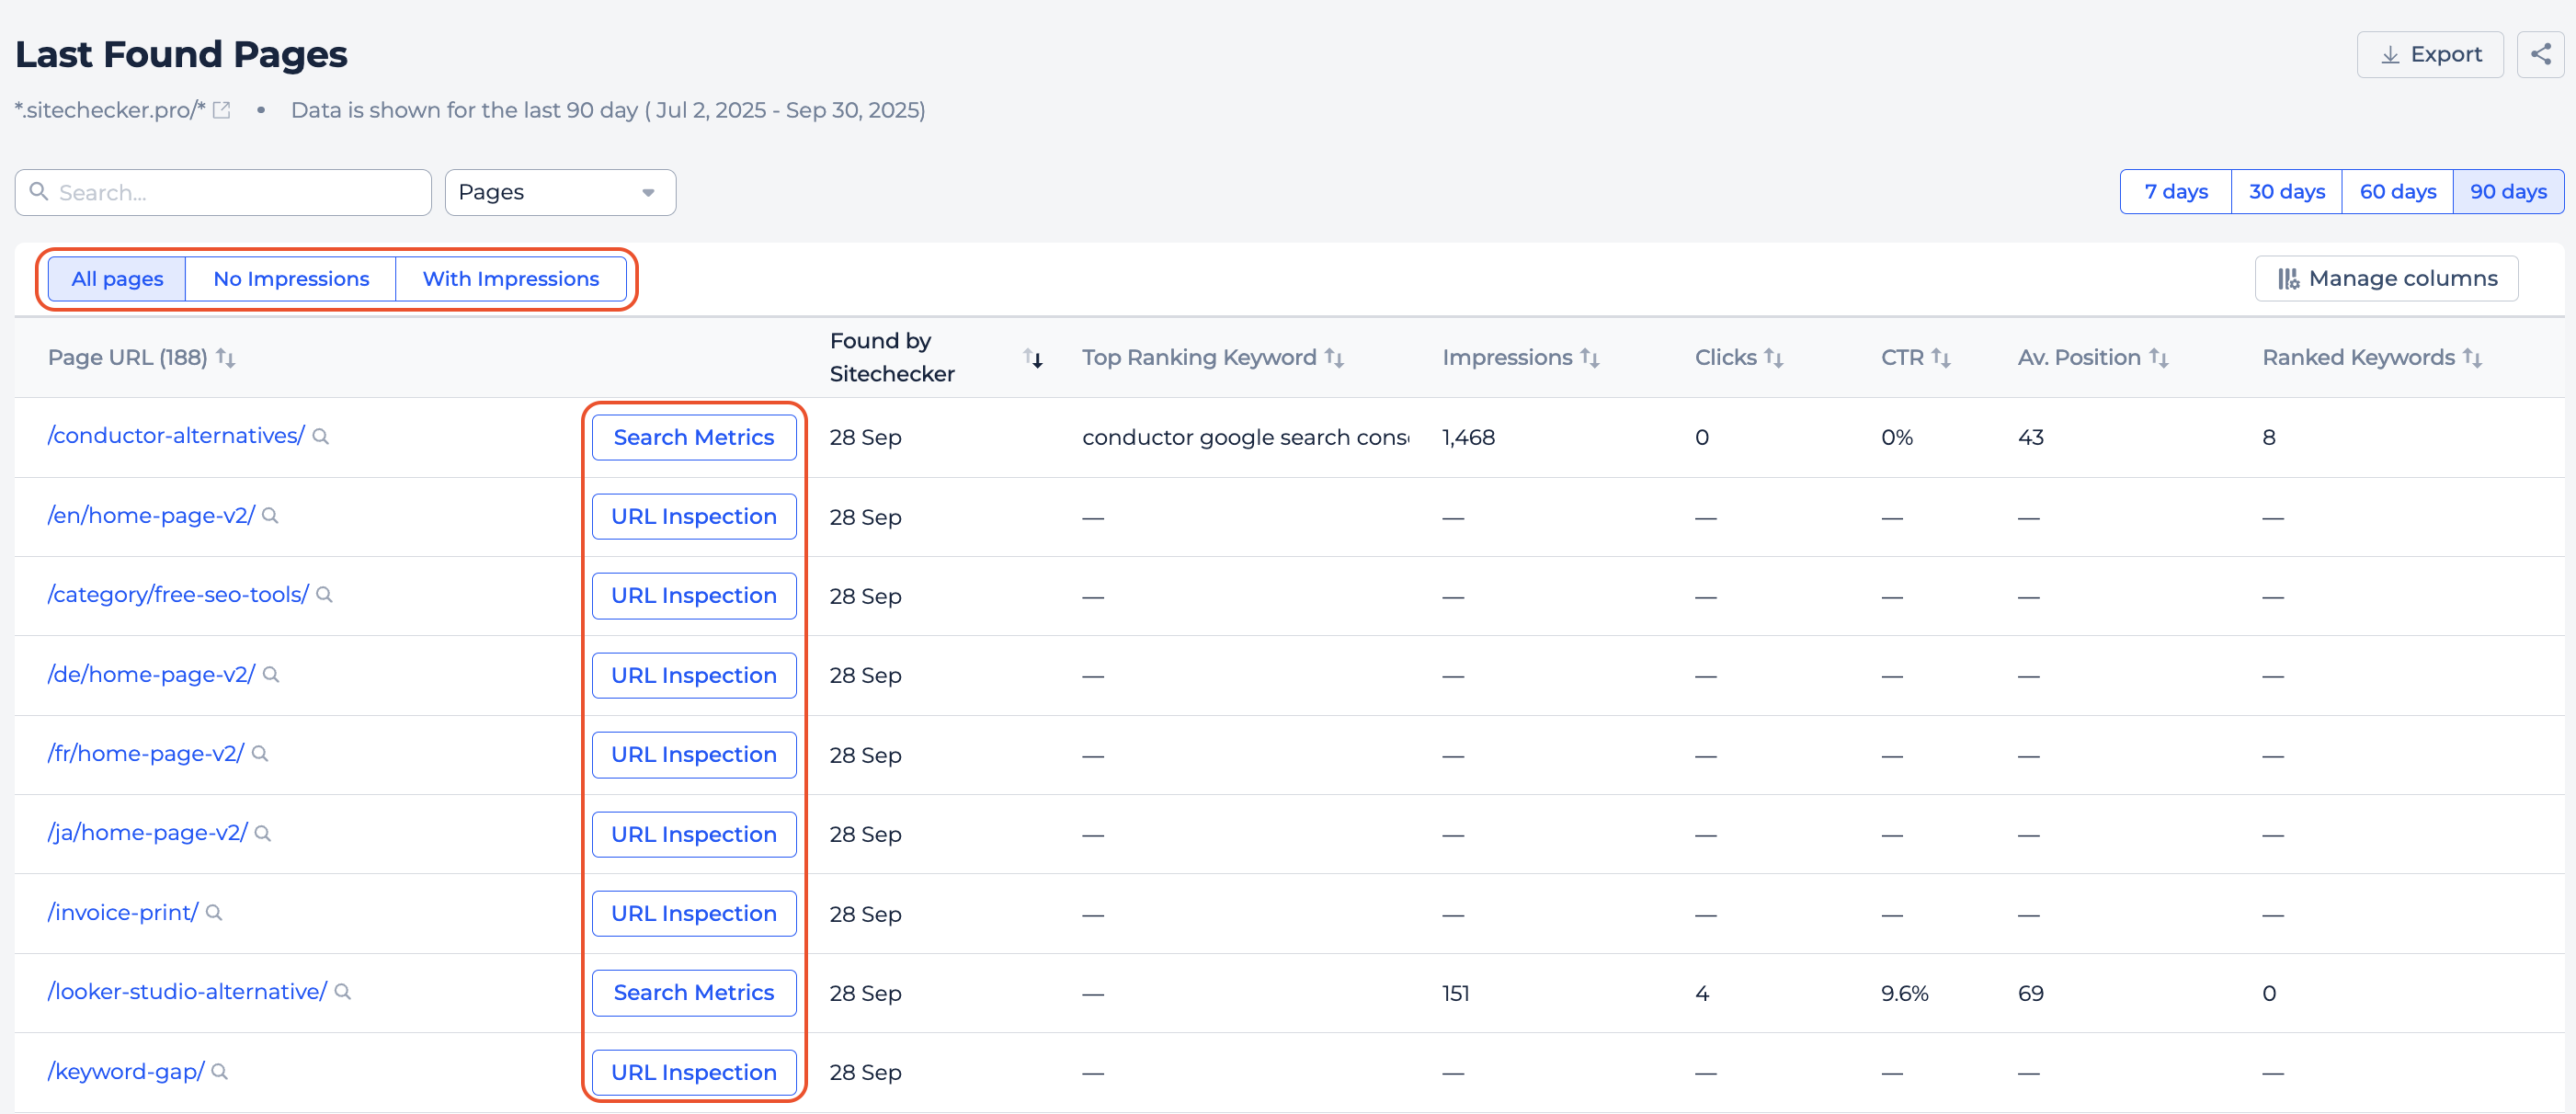
We’ve also added a simple date selector with presets for 7, 30, 60, or 90 days, along with column management and improved pagination.
The Dashboard widget now has a cleaner button that links directly to the full report, helping you focus on your most important new pages.
Winners & losers among pages and keywords
We’ve expanded GSC Top Keywords and GSC Top Pages widgets into full reports, giving you a deeper way to explore search performance directly inside Sitechecker.
From there, you can analyze not only overall performance but also clear winners and losers, with changes shown both in absolute numbers and percentages.
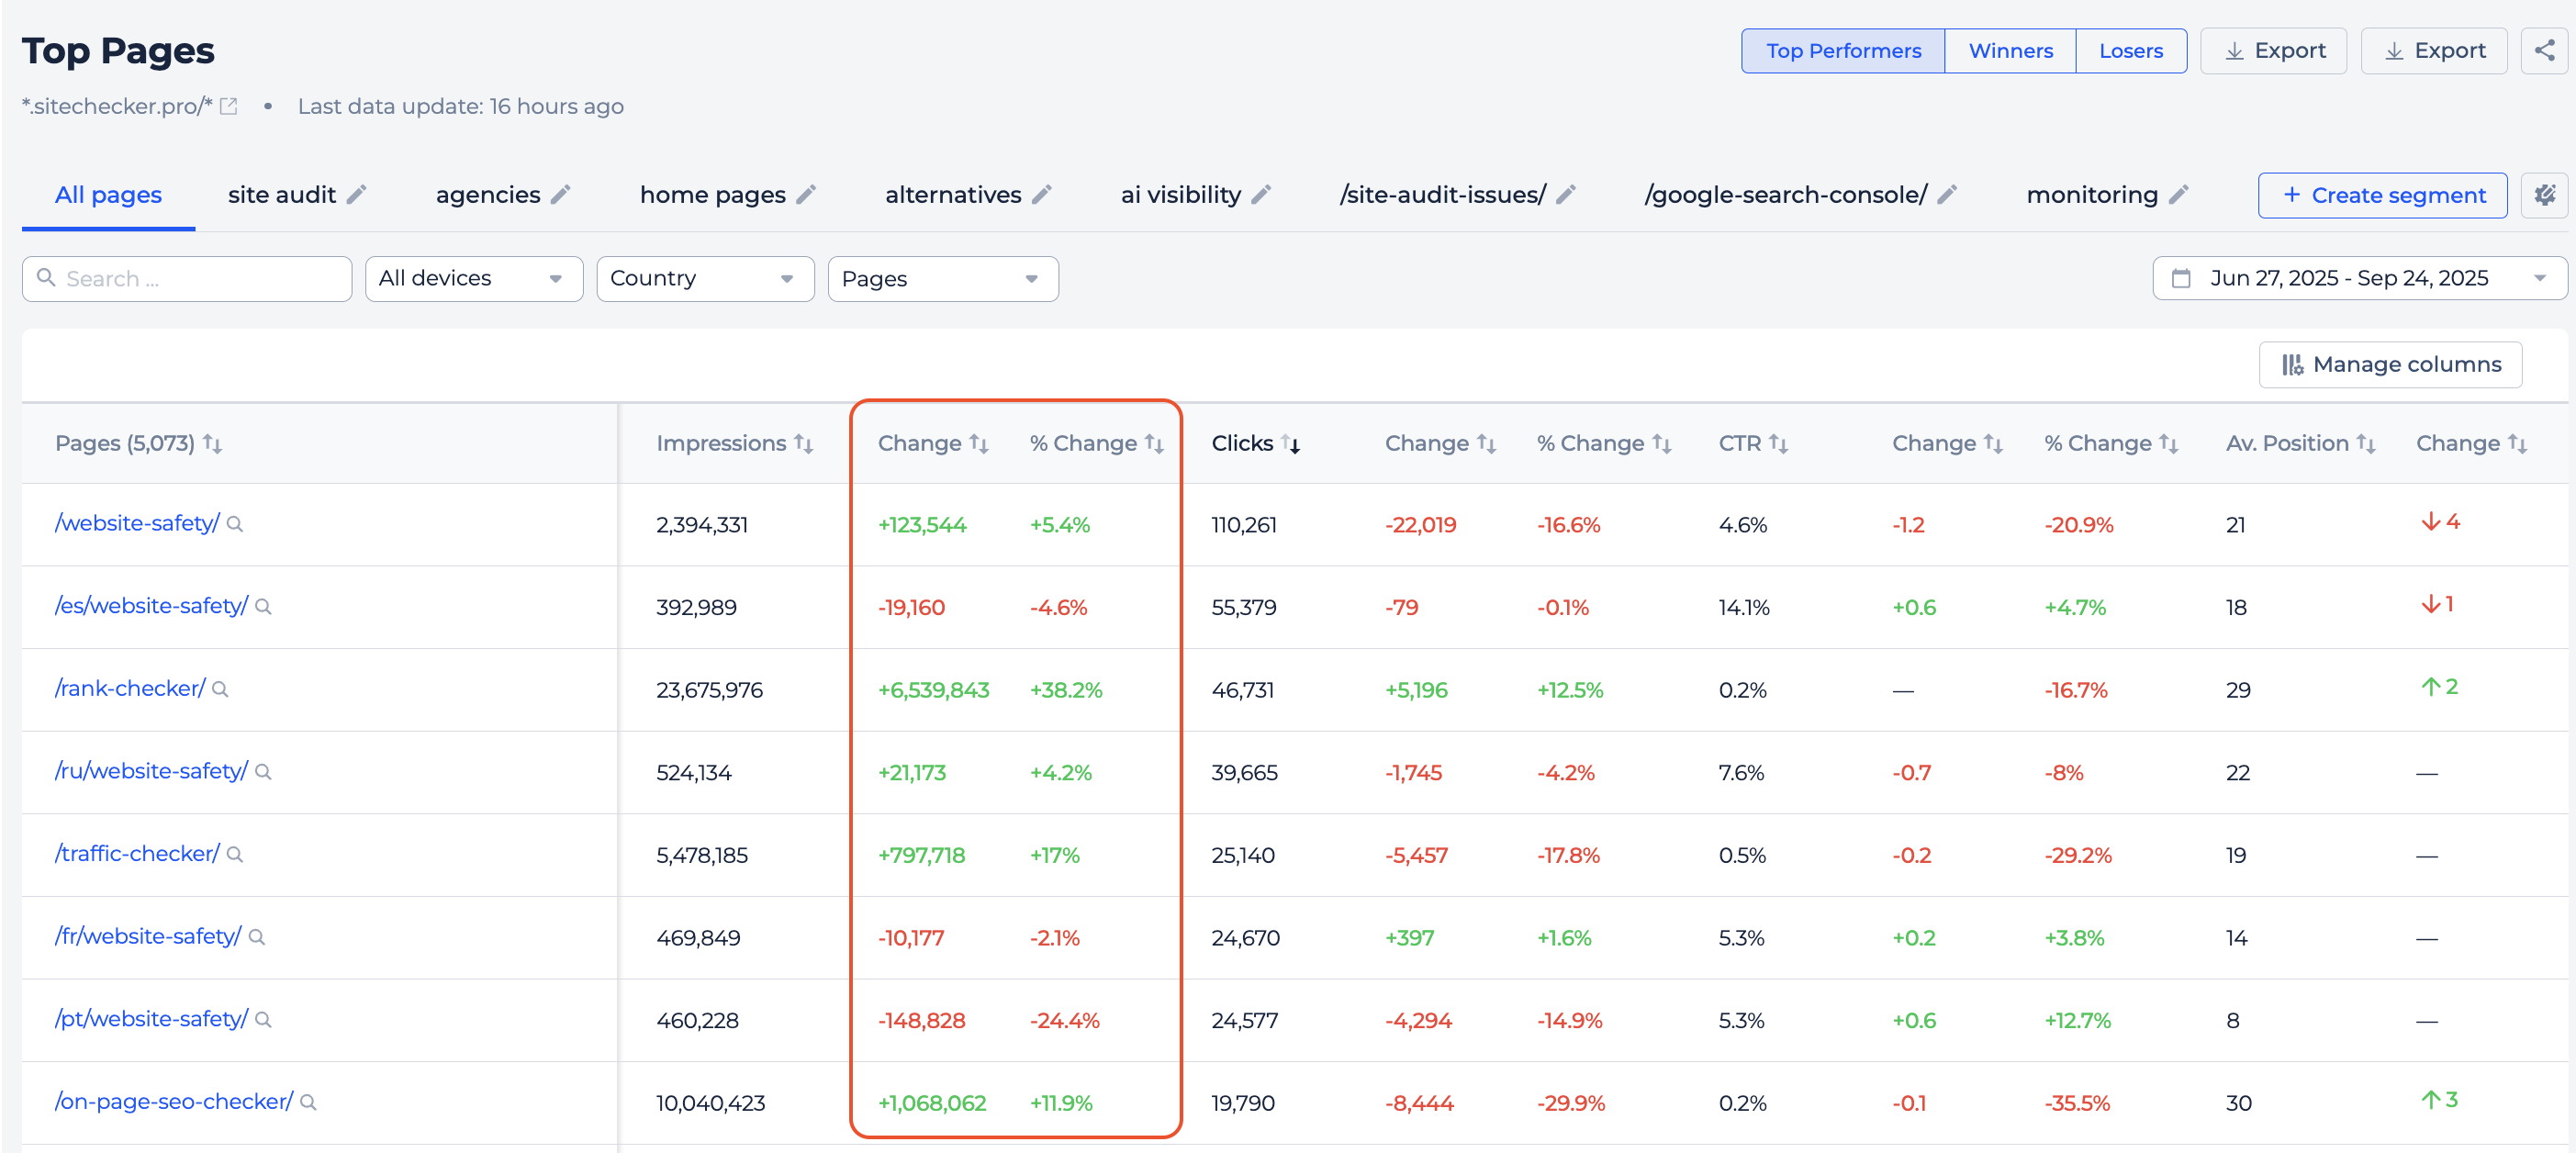
The new reports include tabs for Performance, Winners, and Losers, with a redesigned date picker, fast search, and filters by device, country, and keywords.
Winners show only keywords and pages with positive growth, while Losers list only those that have dropped. Everything is sortable by metric, and column management and pagination follow our standard approach.
For the pages report, you can use search, filters, column management, and pagination are all available, and you can still click any URL to open Page Details in a pop-up.
Both reports are now part of the Insights menu, giving you an end-to-end view of how your keywords and landing pages change over time.
New & lost pages and keywords
Both reports are designed to help you clearly see what has changed between the two periods. Which assets did you gain, and which ones have disappeared from Google’s search results.
The New & Lost Pages report highlights landing pages that started ranking in the selected period compared to the previous one, as well as those that dropped out completely.
You’ll see total clicks, impressions, CTR, and average position for both groups, along with detailed tables of each page.
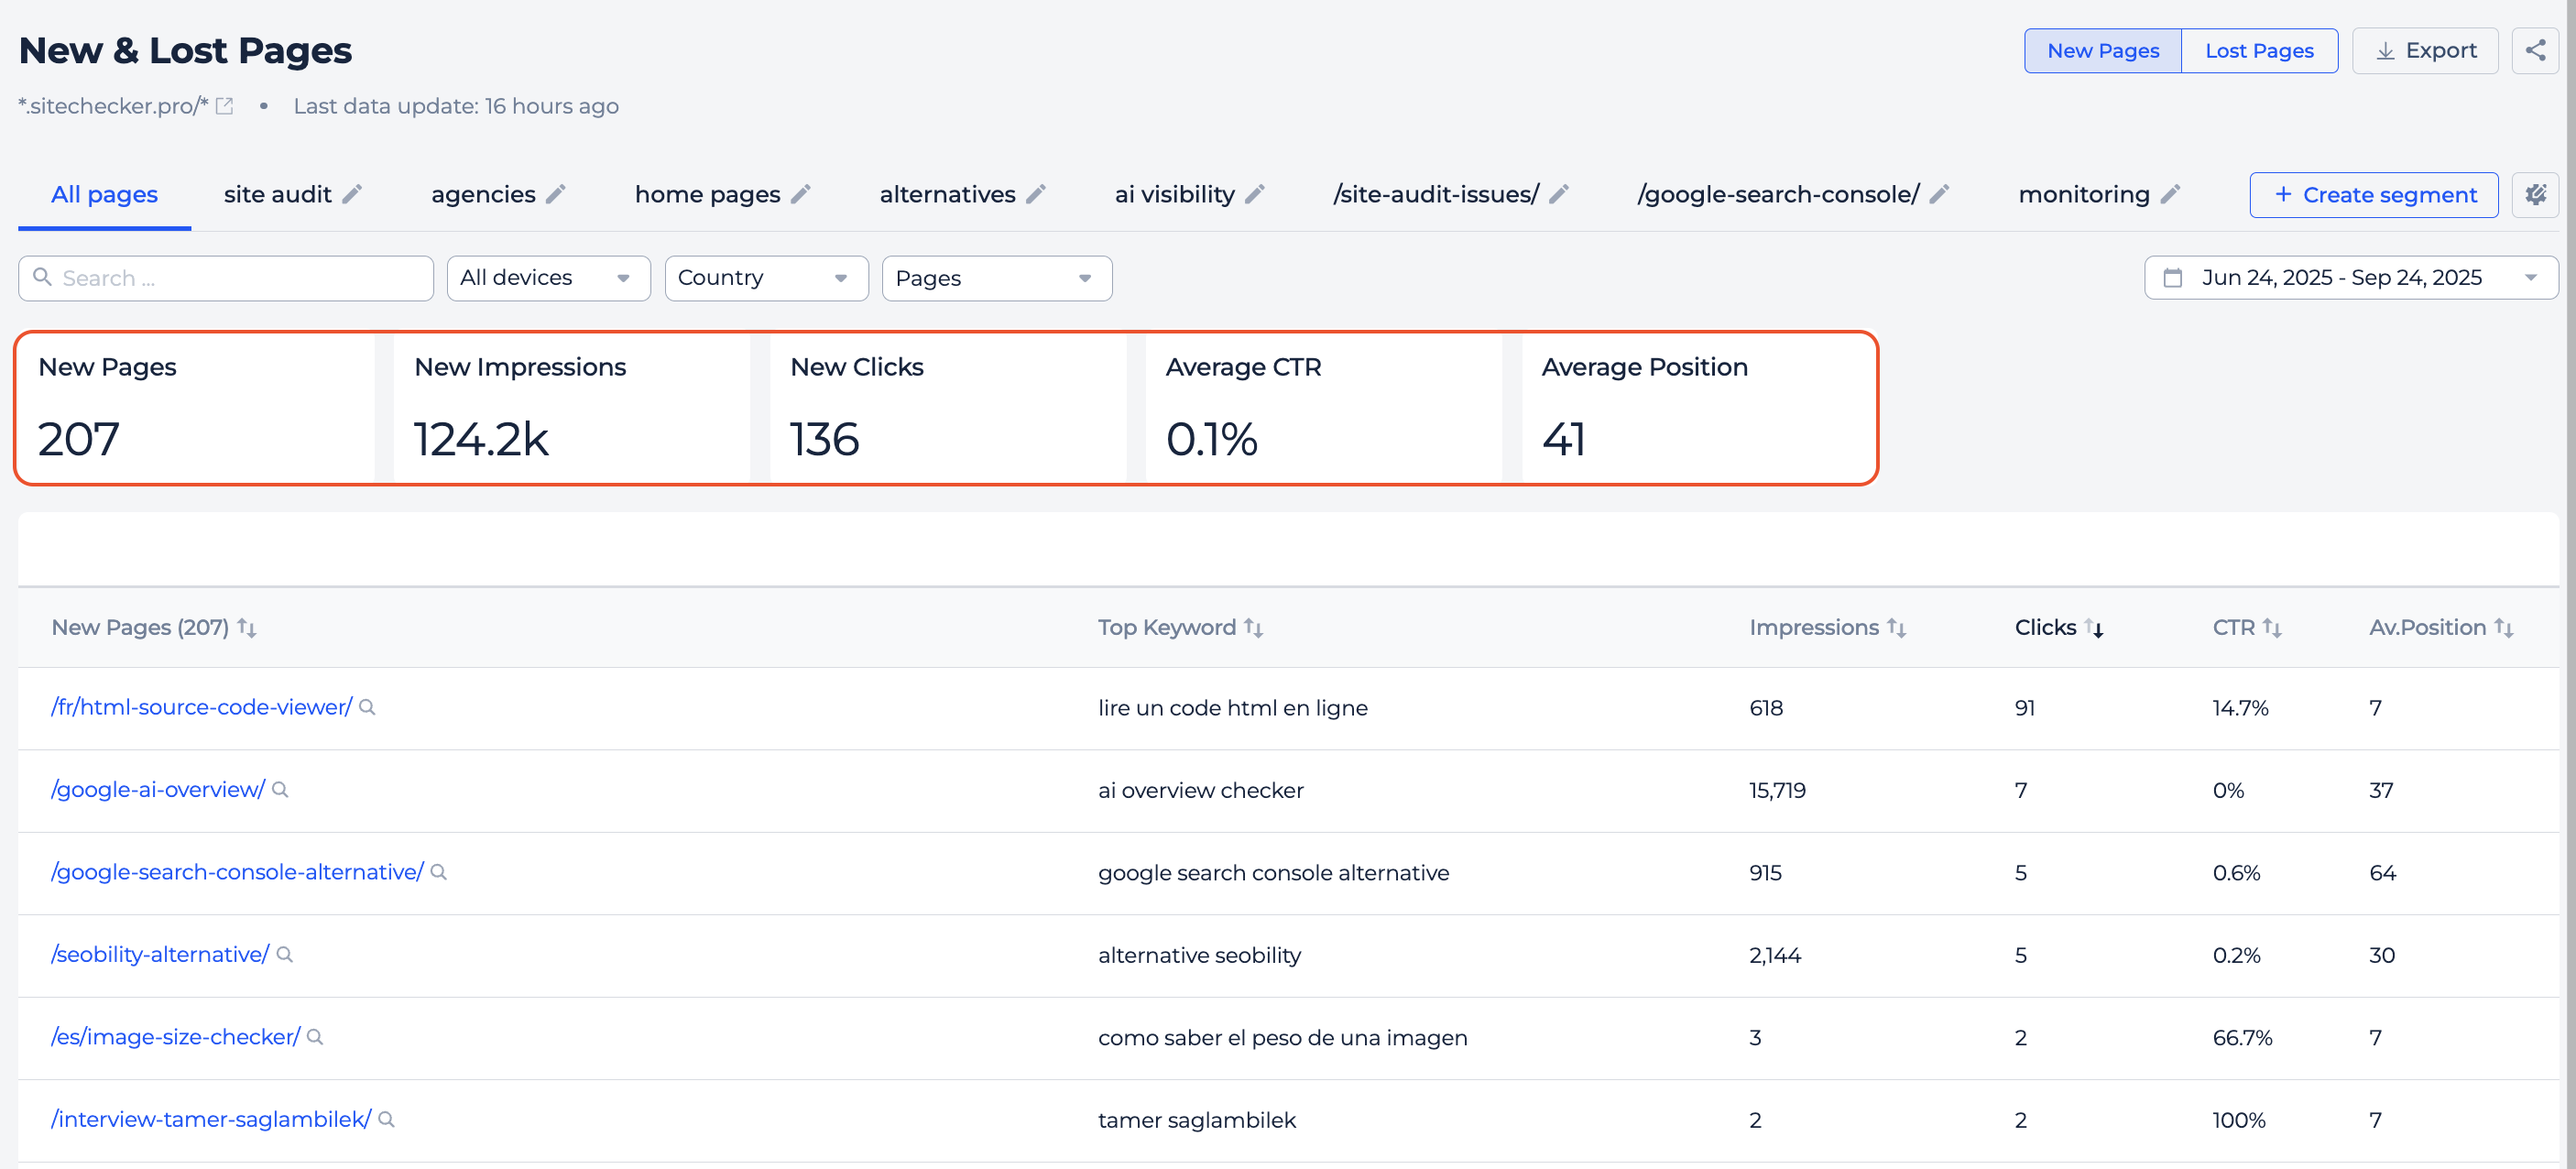
Sorting, search, filters, and full Page Details are all available, and the data can be reviewed for any date range with our comparison date picker.
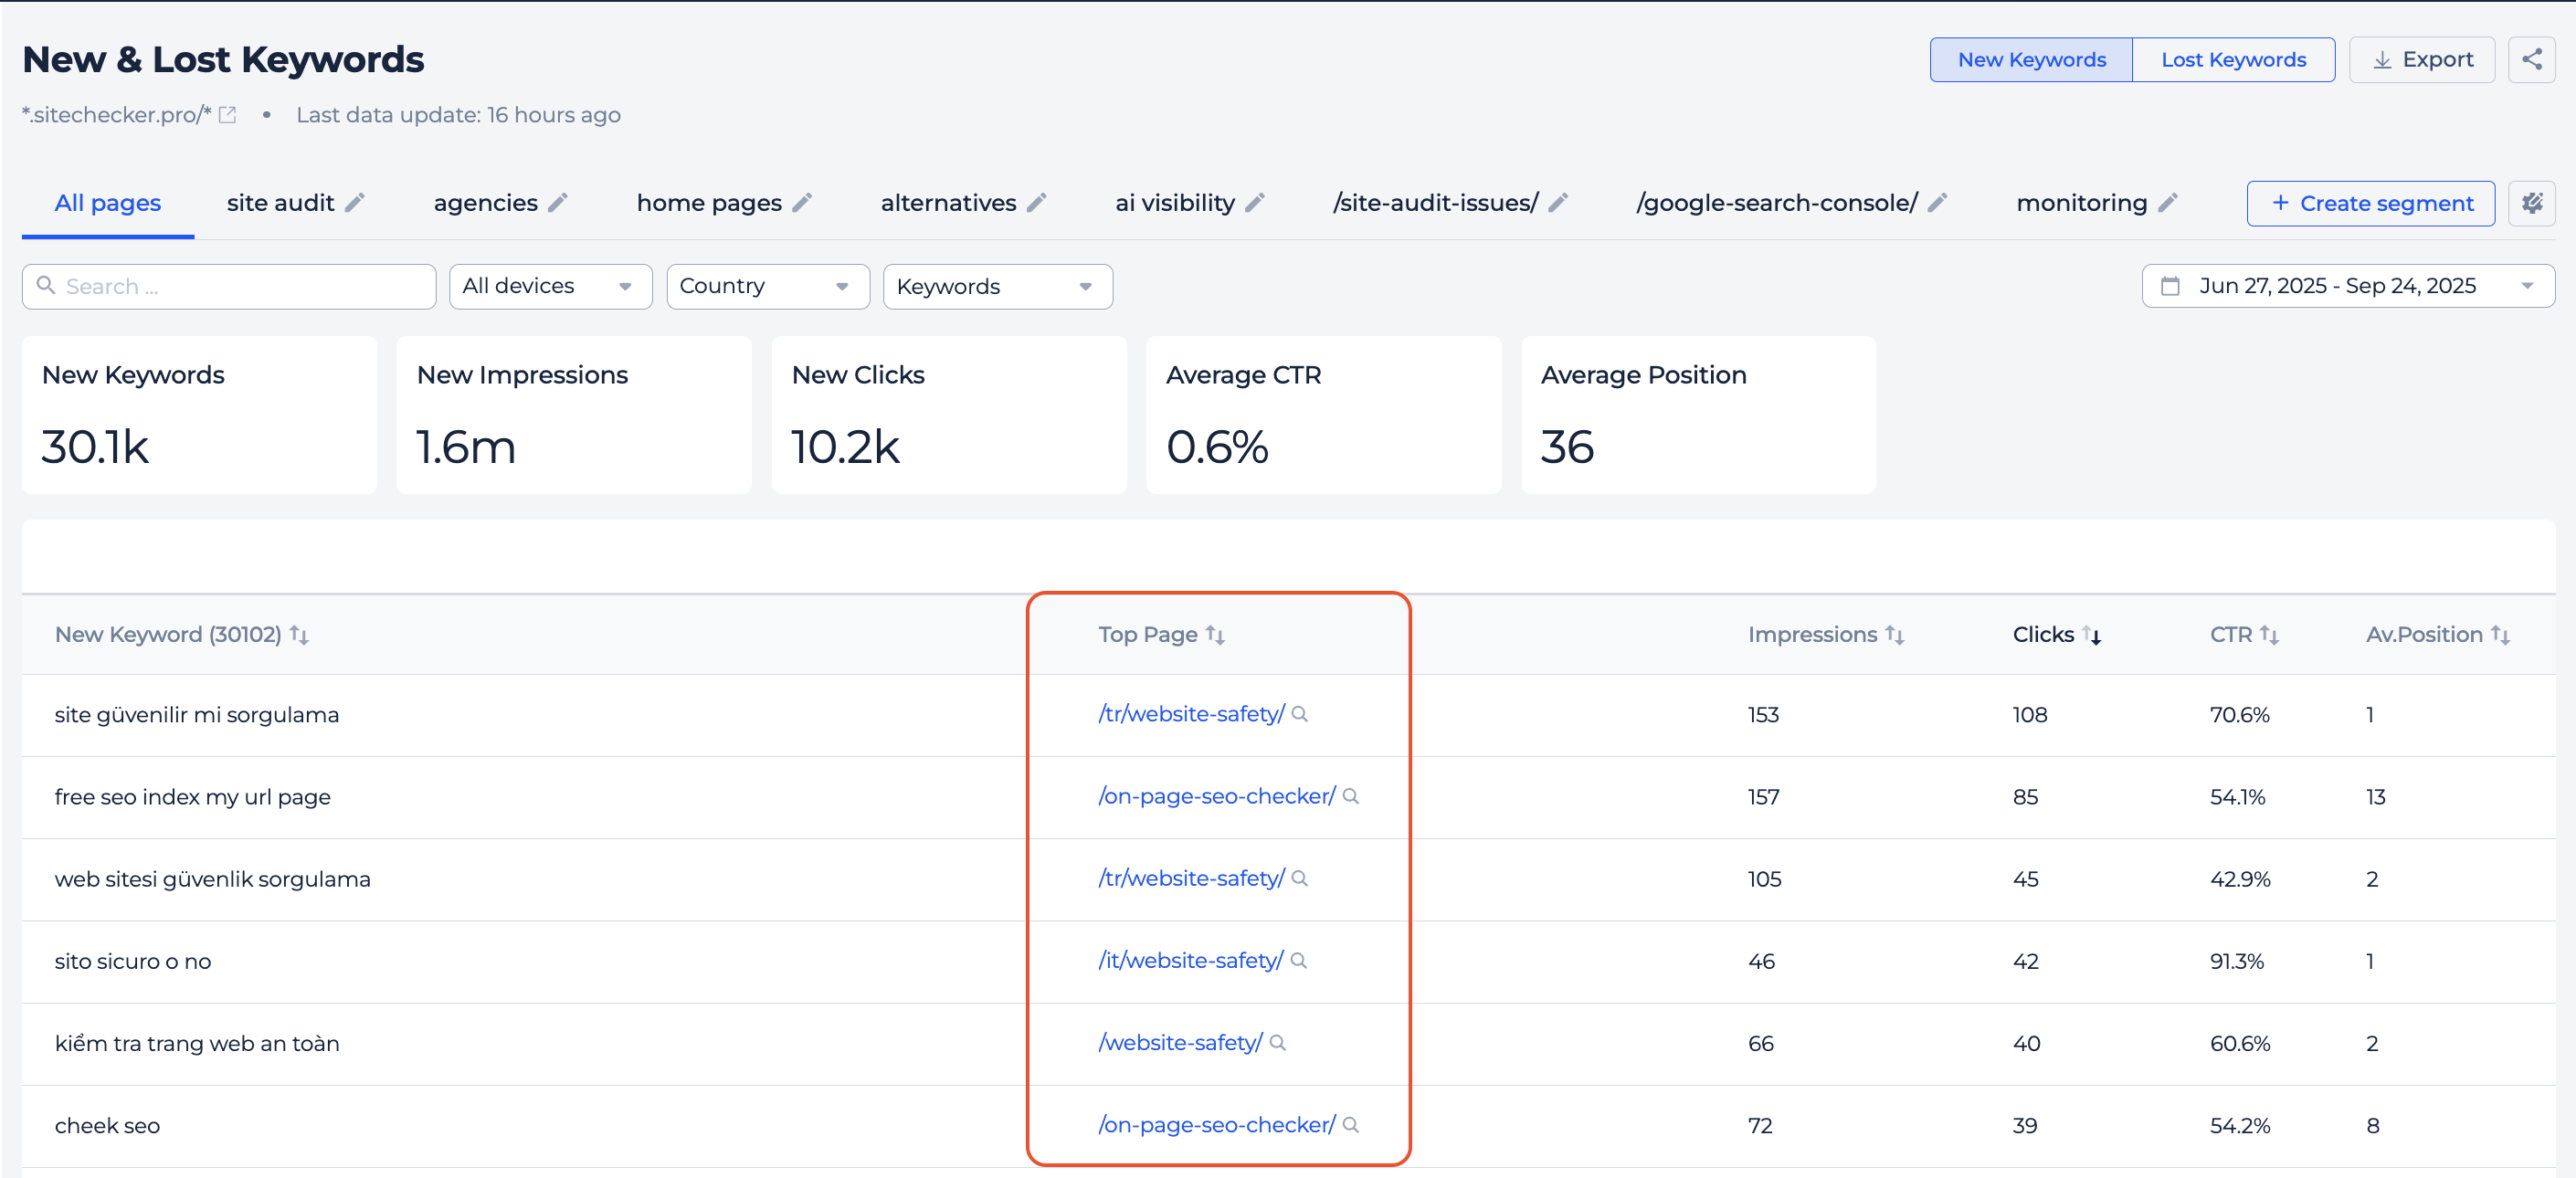
The New & Lost Keywords report works the same way, but for queries. It shows the keywords your site began ranking for, and those you’ve lost visibility on.
For each, you’ll see key metrics and the top landing page associated with the query. Both reports also come with Dashboard widgets that provide quick overviews, with one-click access to the full reports.
3. Saved filters in GSC overview
Segments already let you group pages and analyze them in clusters, but many users rely on the same filtering setups over and over again. For example, always checking Tier 1 countries or excluding brand keywords from traffic.
Until now, this required re-creating filters every time. With the new update, you’ll be able to save these setups once and reuse them in a click.
Saved filters work directly inside the board, without any complex settings. You can create them after applying any combination of rules and give each saved filter a name.
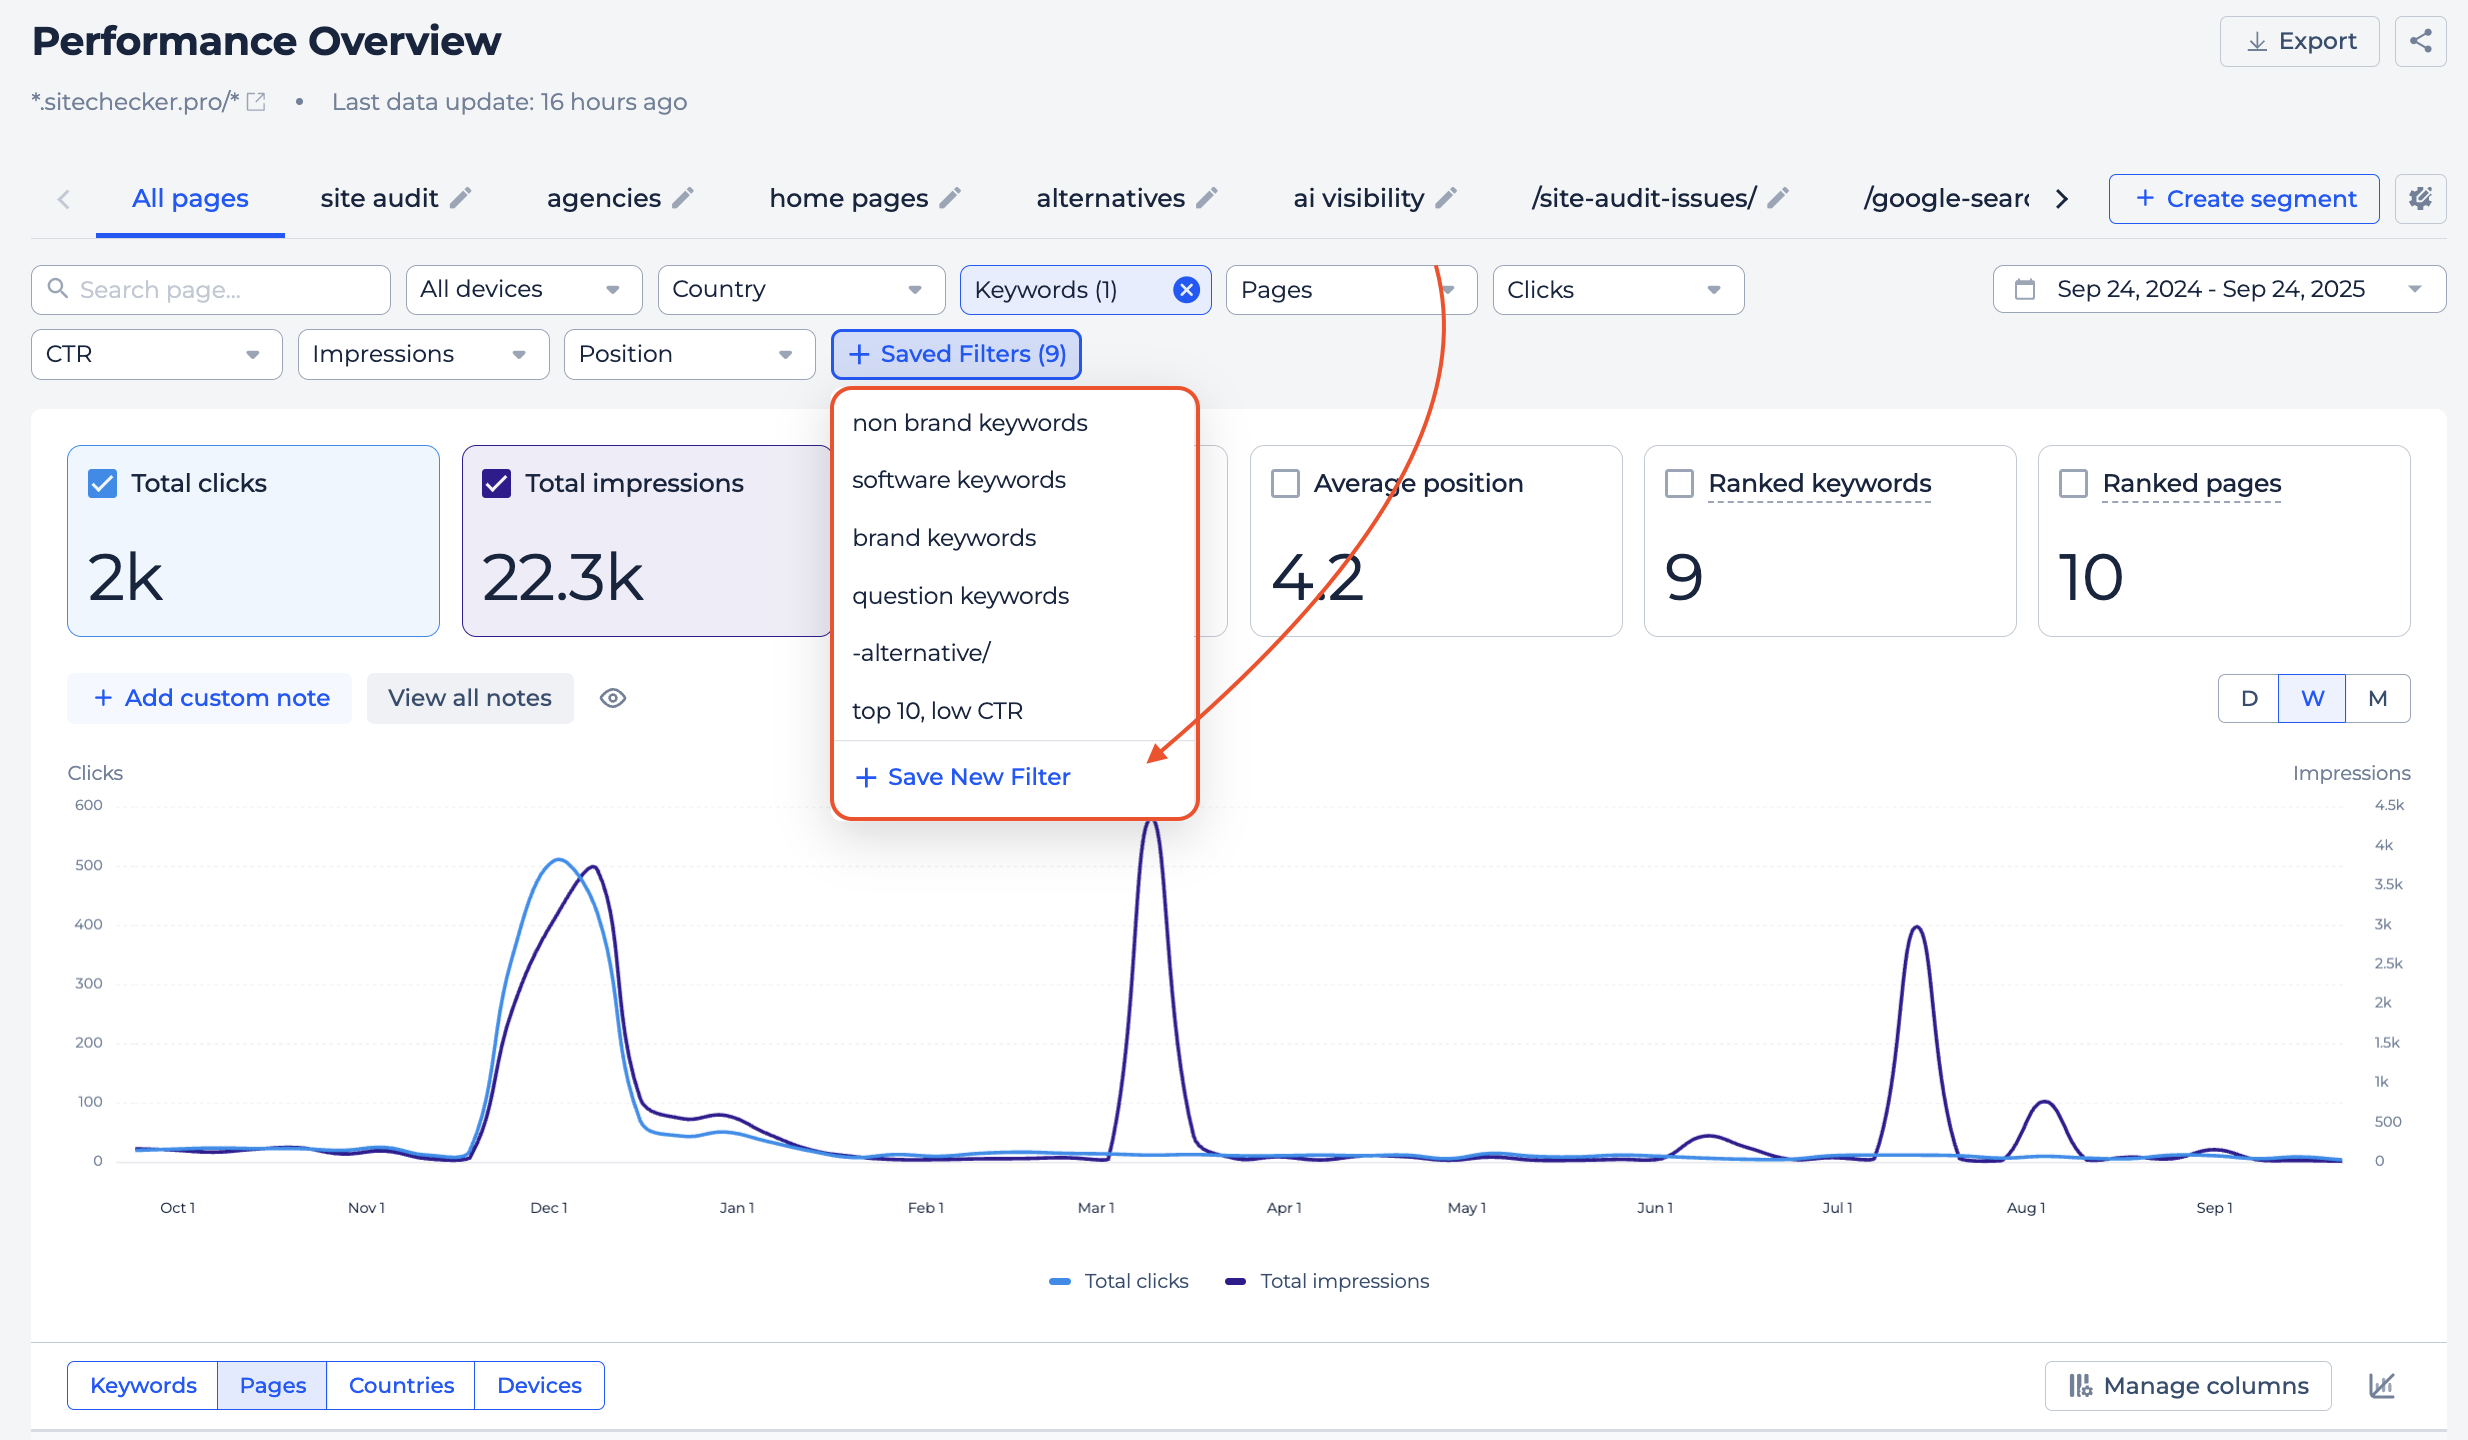
From then on, they’ll be available in your personal list, tied to your project. You’ll also be able to rename or delete them later, but not change their rules, keeping the experience simple and lightweight.
4. Page segmentation
We’re unifying how segments work across Sitechecker so the same rules apply to both crawler and GSC data.
From now on, segments can only be created by a list of URLs or by URL-based rules. This makes the setup consistent and removes the need to duplicate work.
Existing crawler segments with unsupported rules will stay as they are, but only URL-based ones will be migrated to GSC.
Creating and managing segments will also be more convenient. Instead of jumping to settings, everything opens in a pop-up right on the board. We’re splitting the flow into two tabs: Create Segment for adding new ones and Manage Segments for editing, deleting, or reordering.
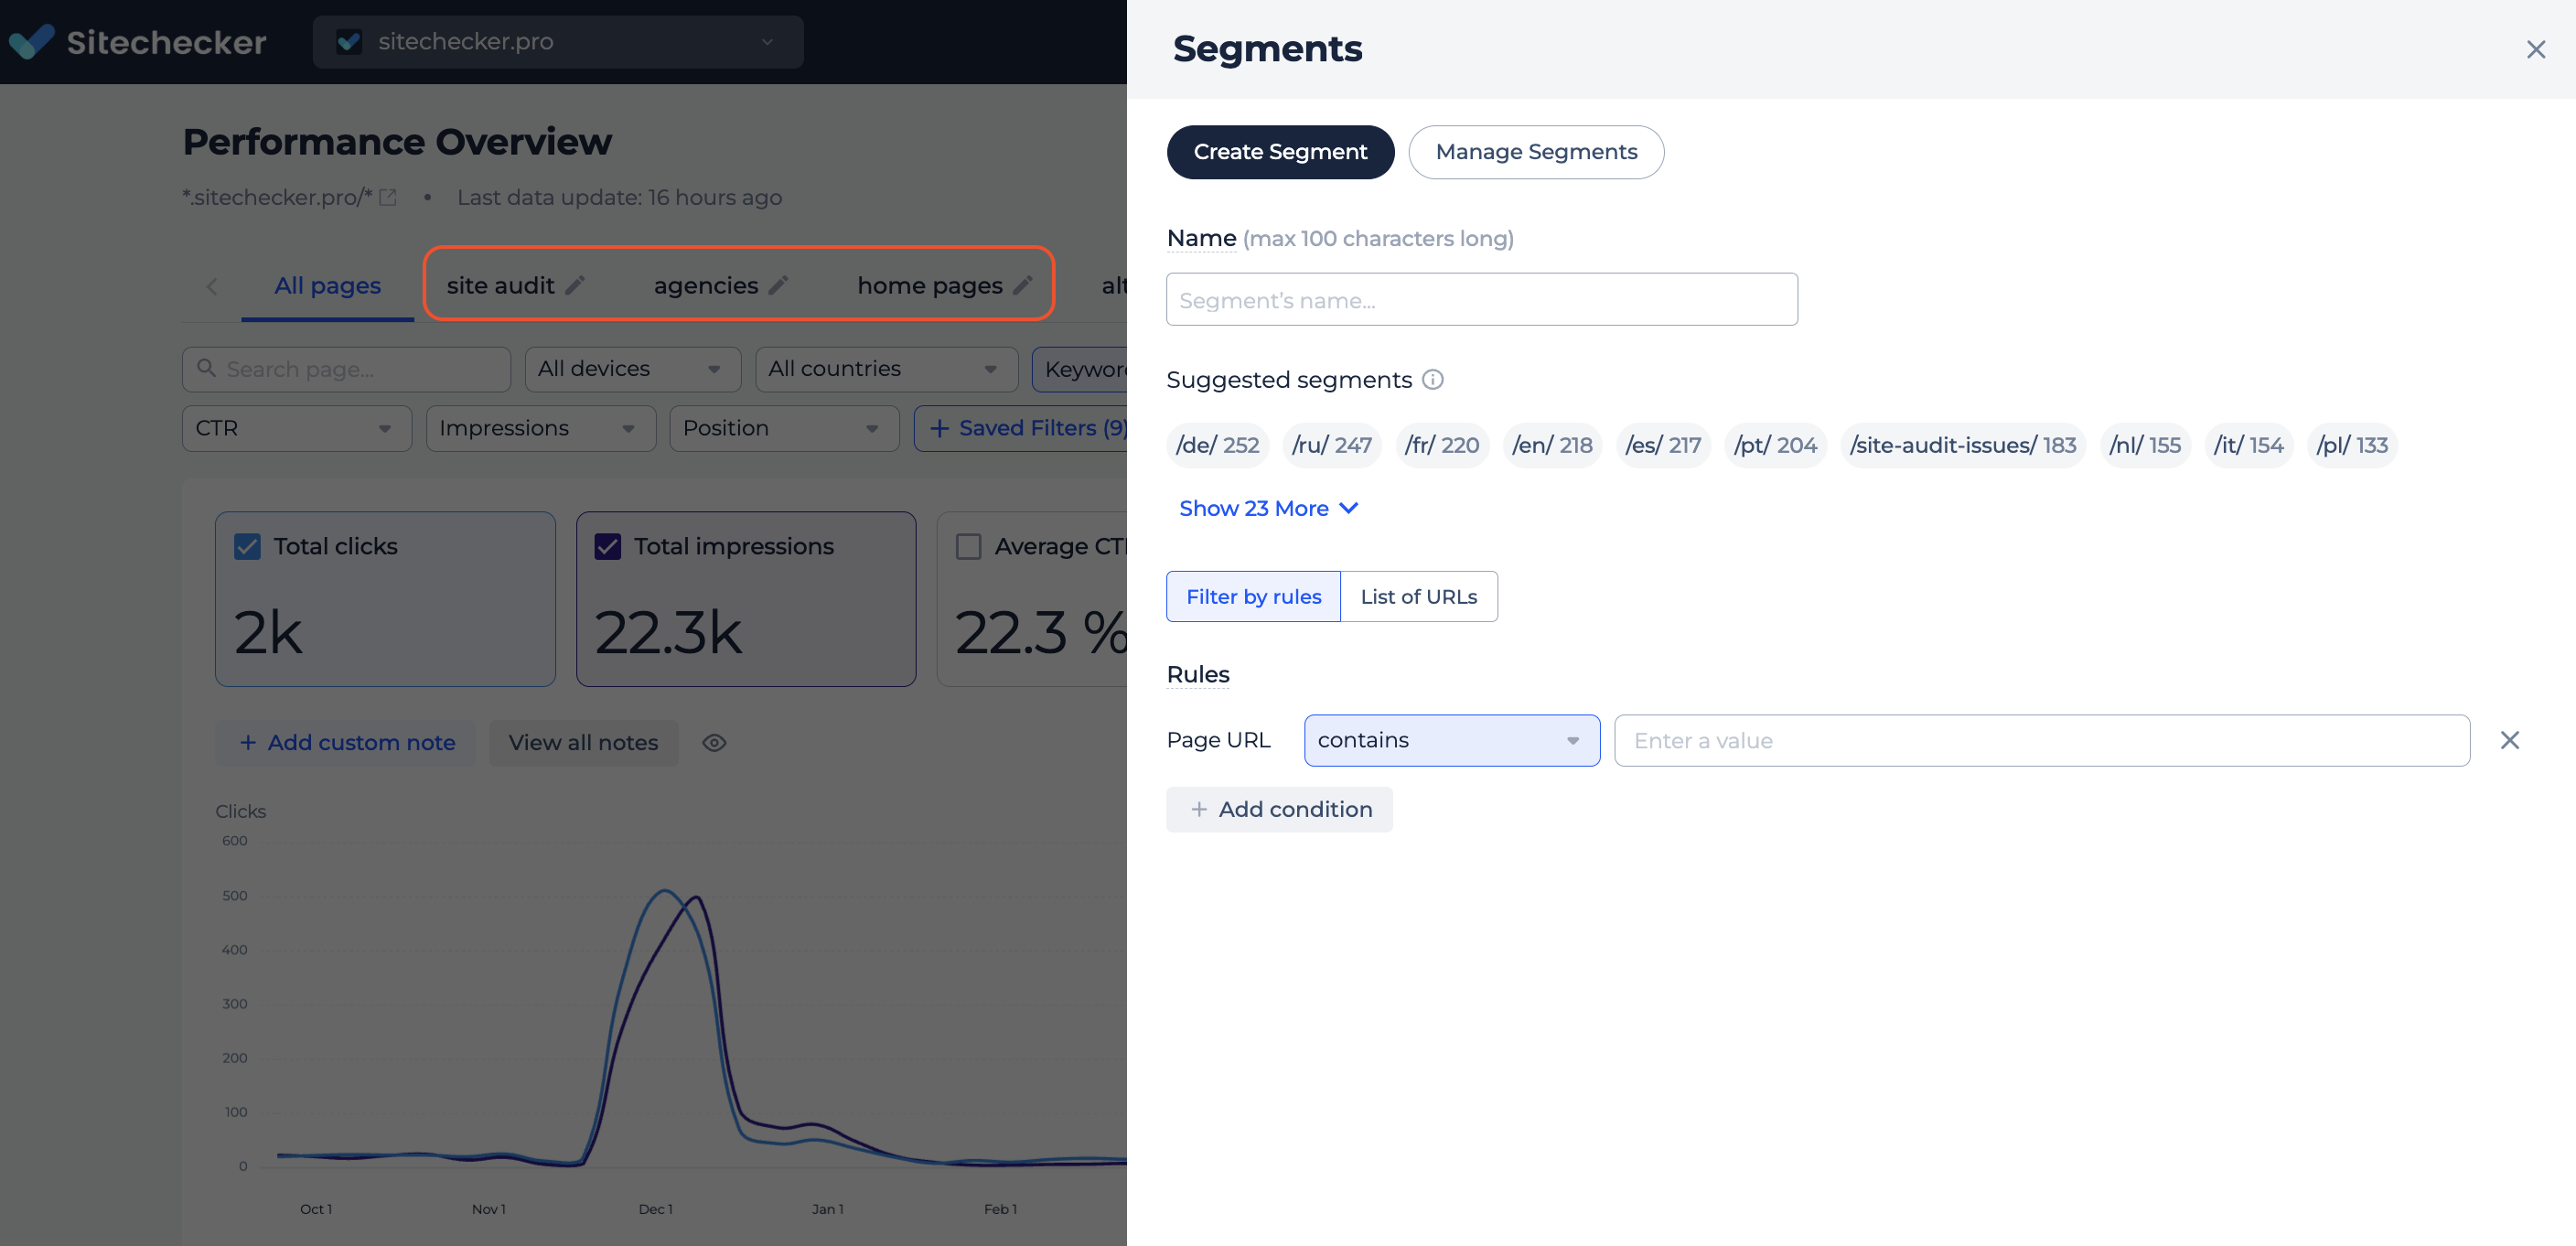
To speed things up, we’re adding suggested segments based on crawler data. Sitechecker will detect folders like /blog/ or /product/ and suggest them automatically. You can accept, rename, or refine them in one click.
Any edits or deletions will trigger a recrawl so the changes apply immediately. This makes segments universal, easier to use, and smarter with built-in suggestions.
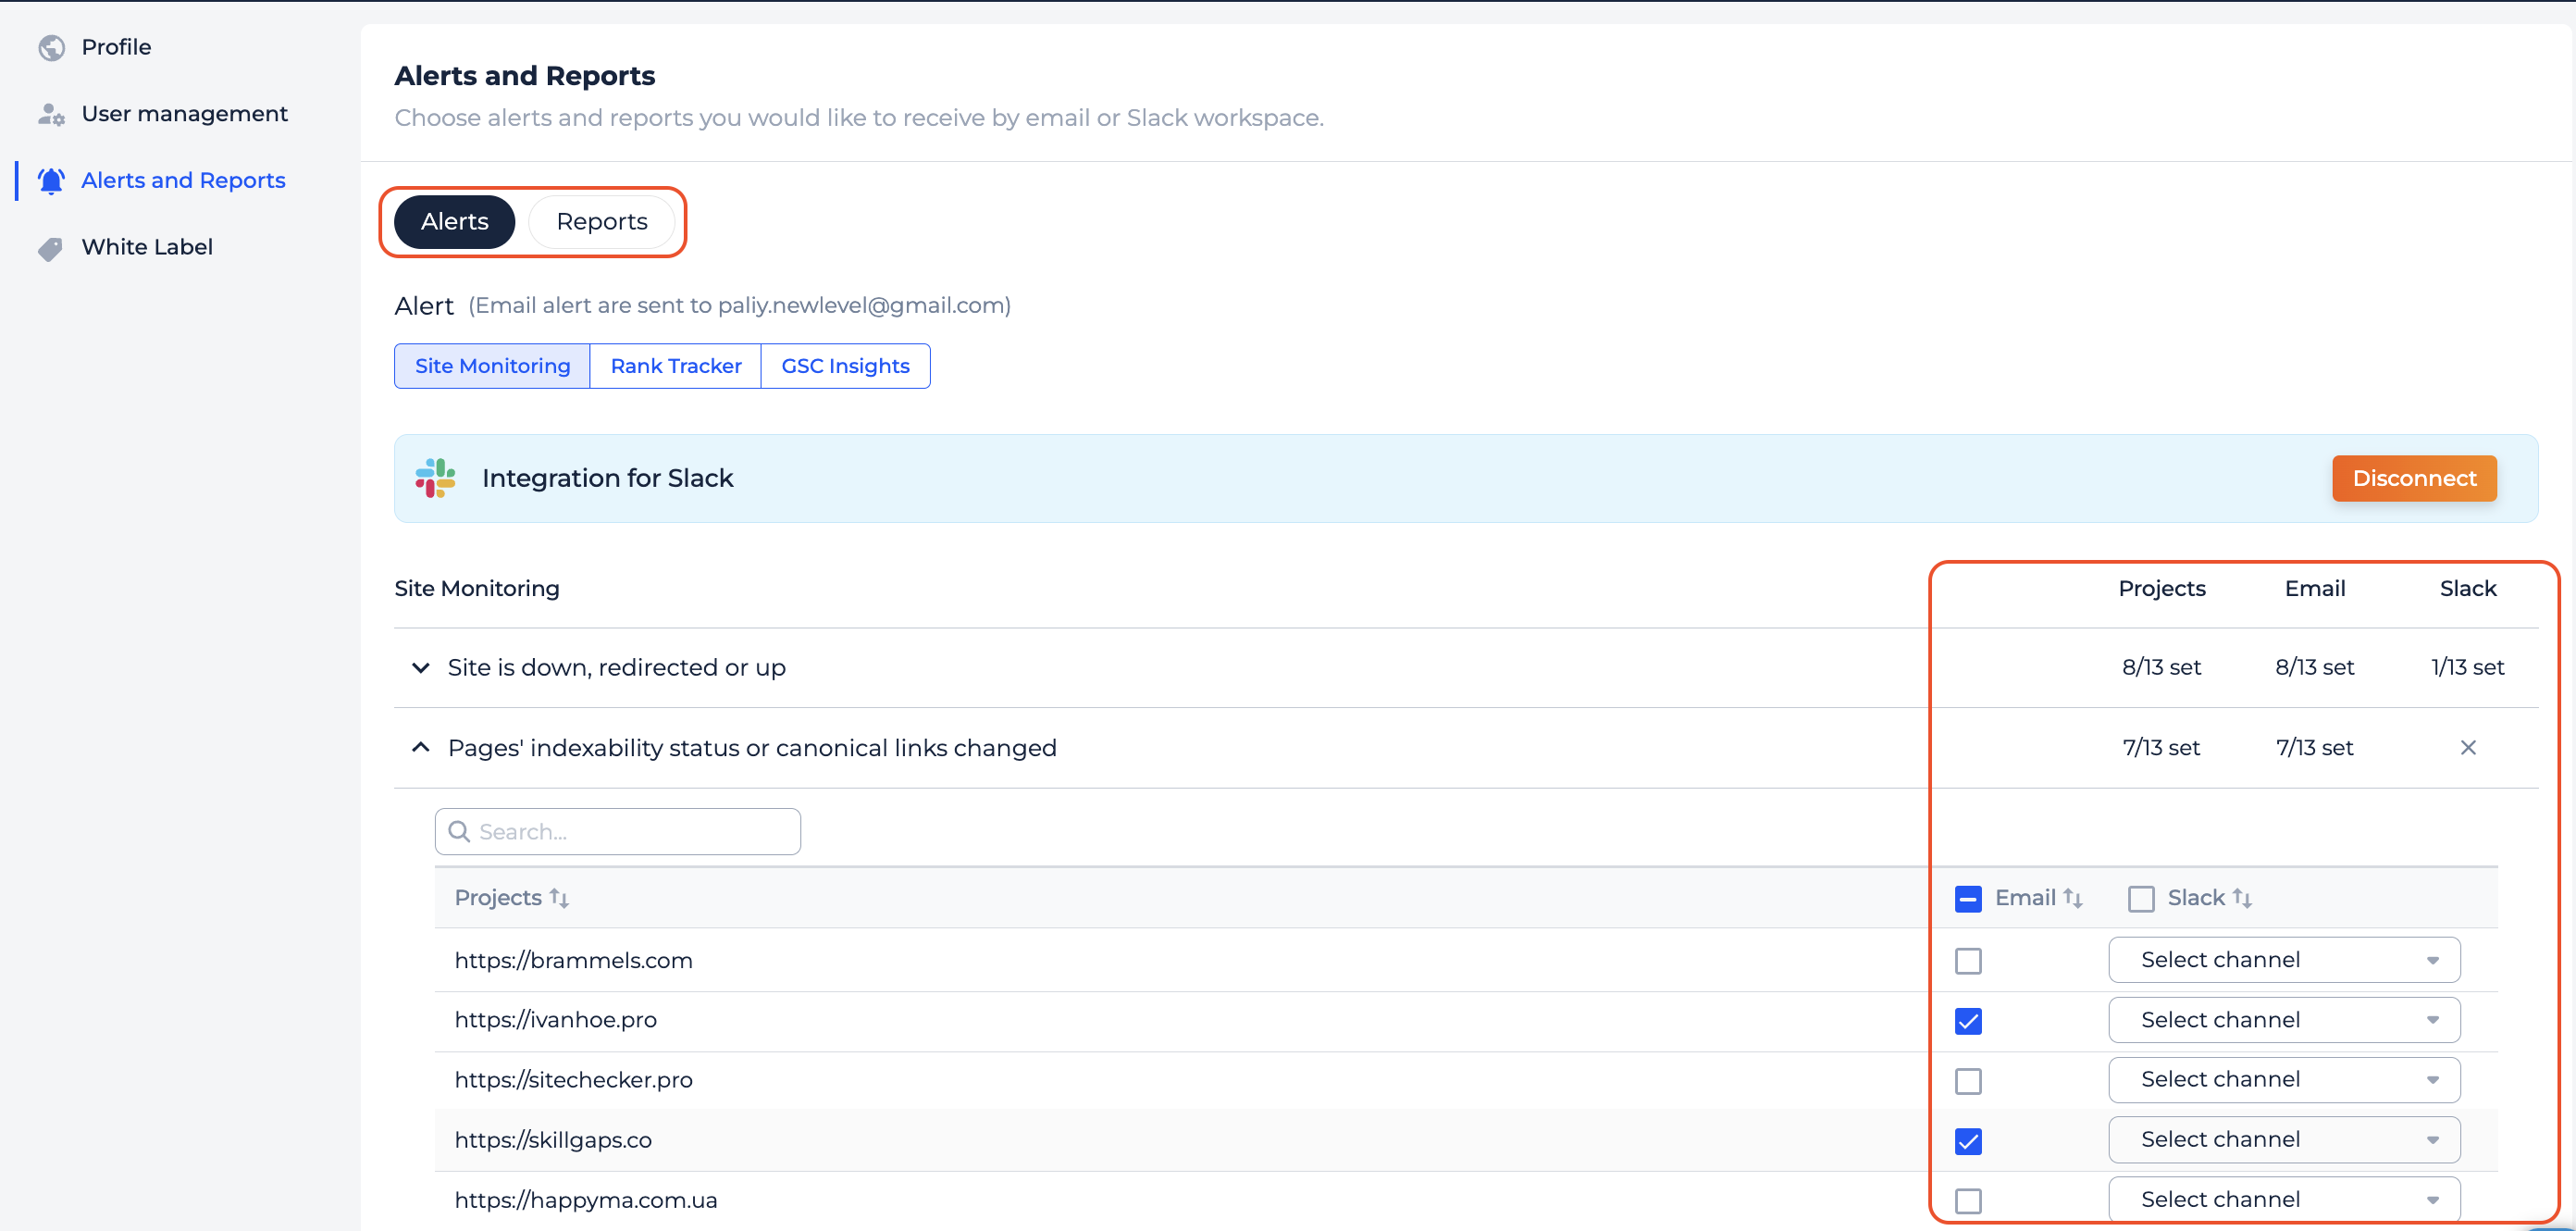
5. Improved Alerts and Reports tab
We’ve redesigned the way alerts and reports are managed to make navigation clearer and the setup more convenient. Instead of being displayed together, they are now separated into two dedicated tabs.
Inside alerts, you can switch between tools like Site Monitoring, Rank Tracker, and GSC Insights, making it much easier to manage notifications.
We’ve also added bulk editing, both on the project and account levels, so you can adjust settings faster across multiple sites.
At the account level, a new Projects column lets you enable or disable alerts and reports across domains in one click, with options for search and “All Projects” to speed things up.
6. Rank Tracker data in the project list
We’re expanding the Projects list to make it more useful for teams running large volumes of one-page websites. Until now, the table only included data from GA4, GSC, and Site Audit, with Rank Tracker limited to Indexed Pages.
With this update, we’re adding Rank Tracker metrics directly into the table. You’ll now be able to track Top 1, Top 3, Top 10, and Top 100 keywords for each site, giving a clear picture of which projects are gaining visibility in search.
Each metric in Manage Columns will also include a data source icon, just like in Dashboard widgets, so you always know where the numbers come from.
")
")