What is the Time To the First Byte?
Time to First Byte, often abbreviated as TTFB, refers to the time taken from the moment a user or client makes an HTTP request until the first byte of the response is received from the server. TTFB is a crucial metric in web performance as it provides insights into the responsiveness of a web server or other network resources. It effectively indicates the latency of server response, and a lower TTFB typically suggests a better-performing server and optimized network conditions. TTFB is composed of three primary components:
1. The time it takes for the request to reach the server
This portion of TTFB represents the network latency involved in the client’s request traveling to the server. It includes all the intermediary steps, such as DNS resolution, TCP handshake, and potential redirects. In a scenario where the client’s internet speed is located far from the server or if there are any network issues, this time can be significant.
2. The time it takes for the server to process the request
Once the server receives the client’s request, it must process it. This processing time includes reading the request, querying databases, generating the response, or any server-side scripting and computations that may be required to fulfill the request. The efficiency of the server, the complexity of the requested resource, and the server’s load can all influence this server response time.
3. The time it takes for the first byte of data to reach the client
After the server processes the request, it starts sending the response back to the client. This component of TTFB indicates the time taken for the server overhead and the first byte of that response to reach the client. Factors influencing this time include server bandwidth, network conditions, and any intermediary systems like Content Delivery Networks (CDNs).
Is TTFB Important?
Time to First Byte (TTFB) is a critical metric in the world of web performance and optimization. Its significance can be understood in various contexts:
| User Experience (UX) | A low TTFB means the server is responding promptly to requests. For end-users, this means the website or application begins to load faster, resulting in a perceived snappier and more responsive user experience. Slow TTFB, on the other hand, can make a website feel sluggish, even if subsequent resources load quickly. |
| Initial Feedback | TTFB serves as an early indicator or “first feedback” to the user that something is happening after they’ve requested a web page. If this takes too long, users may feel the site is unresponsive and might choose to navigate away, leading to higher bounce rates. |
| SEO Impact | Search engines, such as Google, consider website speed as one of the ranking factors. While TTFB is just one aspect of website speed, a consistently high TTFB can negatively impact search rankings. Faster sites are considered to provide a better user experience, which search engines want to promote. |
| Server and Network Diagnosis | A high TTFB can point to several potential bottlenecks. It can be a result of server inefficiencies, slow database queries, network congestion, or a myriad of other reasons. By monitoring TTFB, web administrators can identify and troubleshoot potential issues in the infrastructure. |
| Content Delivery and Third-party Integrations | If a site relies on third-party content, such as advertisements or widgets, TTFB can be crucial in determining the efficiency of these external resources. A slow TTFB from third-party integrations can drag down the performance of the entire site. |
| Mobile Experience | With the rise in mobile browsing, TTFB has gained even more prominence. Network conditions on mobile can be more variable than on traditional desktop connections, making a quick server response even more vital to ensure content starts loading promptly on mobile devices. |
In conclusion, while TTFB is not the only metric to consider when evaluating web performance, it plays a pivotal role. A site with optimized TTFB not only ensures better user experience but also positions itself favorably in search engine rankings and offers better mobile responsiveness. As a result, it is undeniably an essential metric for website owners, developers, and SEO professionals to monitor and optimize.H2 What causes a slow TTFB?
1. Long Redirect Chain
Redirect chains occur when one URL redirects to another, which in turn redirects to yet another URL, and this pattern continues for multiple steps in connection process. Each redirect introduces additional server and network overhead, thus extending the time it takes to reach the final destination URL.
The implications of long redirect chains include:
- Delayed Content Delivery: Each redirect step means the browser has to make an additional HTTP request, adding to the total time before the desired content starts to load.
- Increased Server Load: Each redirect requires server processing, thereby unnecessarily consuming server resources.
- SEO Impact: Search engines view excessive redirects negatively. It can dilute the “link juice” or authority passed from one page to another. Additionally, search bots might waste crawl budget navigating these chains instead of indexing valuable content.
To optimize TTFB and overall site performance, it’s essential to minimize the use of redirects and especially long chains. Tools like redirect path analyzers can help identify and rectify these chains.
2. Connection Issues
Connection issues can significantly influence TTFB. These encompass a broad range of factors, such as:
- Network Latency: The physical distance between the server and the client, network congestion, or suboptimal routing can result in high latency, delaying the initial connection.
- DNS Resolution Delays: Slow or unresponsive DNS servers can lead to extended times in resolving domain names to IP addresses.
- TCP Handshakes: The process of establishing a TCP connection involves a handshake that, if inefficient or faulty, can introduce delays.
- SSL/TLS Negotiation: Websites using HTTPS need to establish a secure connection, which involves an additional set of handshakes. If not optimized, this can extend the TTFB.
Regular monitoring and employing diagnostic tools can help identify and rectify connection-related issues, ensuring a swift and robust internet connection to your server.
3. Insufficient Server Resources
The resources and configurations of the hosting provider of server play a critical role in determining TTFB. Insufficient server resources can result in:
- Slow Processing Times: If the server CPU is overloaded or if there’s inadequate RAM, processing client requests can become sluggish.
- Database Bottlenecks: For dynamic websites, database queries might be necessary to generate content. An overburdened or misconfigured database can be a major TTFB culprit.
- Disk I/O Limitations: Slow disk reads/writes, especially on sites with heavy content or high traffic, can increase response times.
- Concurrency Issues: If too many users are trying to access a site simultaneously, and the server isn’t equipped to handle this traffic, it can result in slow responses or even timeouts.
It’s crucial to monitor server health metrics regularly and scale resources or optimize configurations as necessary. Employing server monitoring tools and conducting regular stress tests can provide insights into how well the server is handling traffic and where bottlenecks might be occurring.
What is a Good Time To First Byte?
Time to First Byte (TTFB) serves as an early indicator of web server performance and the efficiency of the network in delivering the first piece of information of the requested content to the client.
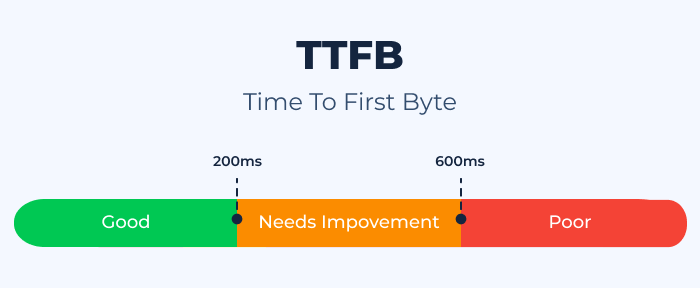
But what constitutes a “good” TTFB can vary based on industry standards, the nature of the website, and user expectations. Here’s a general guideline:
- Excellent TTFB: Below 200 milliseconds (ms)
- Good TTFB: 200-500 ms
- Average TTFB: 500-1000 ms
- Poor TTFB: Above 1000 ms (1 second)
Here’s a breakdown of what each range implies:
- Below 200 ms: This is an ideal TTFB for most websites. Achieving such a low TTFB indicates optimized server response, efficient network delivery, and minimal or no redirects. Websites in this range often provide a smooth and responsive user experience.
- 200-500 ms: While not perfect, this is an acceptable range for many websites. Minor optimizations, such as database tuning, might be necessary to further improve response times.
- 500-1000 ms: This range is considered average. Websites with TTFB in this bracket might be experiencing some server slowdowns, network latency, or other issues affecting performance. It’s worth investigating potential bottlenecks and implementing improvements.
- Above 1000 ms: Websites with a TTFB exceeding 1 second should prioritize diagnosing and resolving the causes of delay. Such extended response times can lead to higher bounce rates and reduced user satisfaction.
However, it’s essential to note that while TTFB is an important metric, it shouldn’t be viewed in isolation. It’s one of many performance metrics, and the overall user experience depends on other factors as well, like the full page load time, the time to interactive, and visual stability.
Additionally, the context plays a role. For example, a content-heavy news website with lots of dynamic content might inherently have a slightly longer TTFB compared to a static, lightweight landing page.
Regularly monitoring TTFB and using it in conjunction with other performance metrics provides a more holistic view of a website’s health and user experience.
How to Measure TTFB
Understanding Time to First Byte (TTFB) is crucial for optimizing web performance, but equally important is knowing how to measure it accurately. Several tools, both for lab testing and real-world field analysis, allow for precise measurements of TTFB. Let’s delve into them:
Lab Tools
Lab tools are designed for controlled environments, providing consistent results which are ideal for debugging and iterative development.
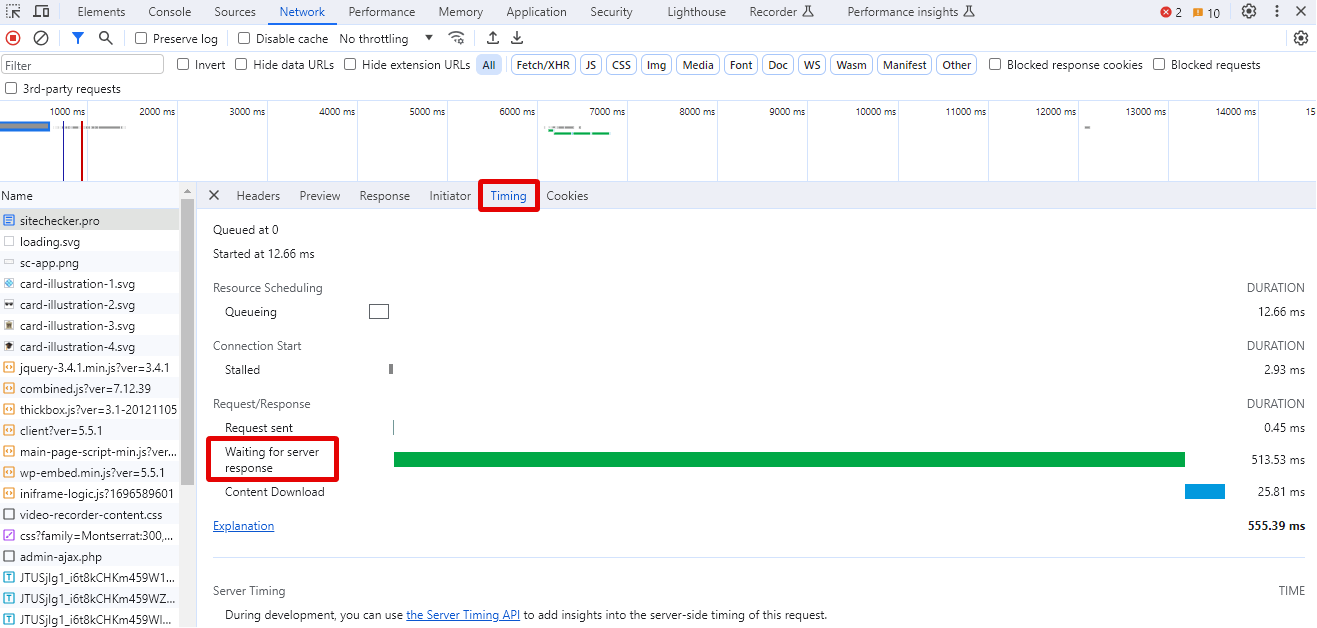
Chrome DevTools
Google Chrome’s built-in developer toolset offers a convenient way to measure TTFB:
- Open the website you want to test in Chrome.
- Right-click on the webpage and select “Inspect” or use the shortcut Ctrl+Shift+I (Cmd+Option+I on Mac).
- Navigate to the “Network” tab.
- Refresh the page (F5 or Ctrl+R) to start capturing network requests.
- Click on the main document request (usually the website’s URL).
-
In the “Timing” tab, the “Waiting (TTFB)” time represents the Time to First Byte.
WebPageTest
WebPageTest is an open-source tool that offers a detailed analysis of website performance, including TTFB:
- Visit WebPageTest.org.
- Enter the website URL you wish to test.
- Choose a test location and browser.
- Click “Start Test.”
-
Once the test completes, view the “First Byte Time” under the “First View” results.

GTmetrix
GTmetrix provides an easy-to-understand interface for website performance insights:
- Visit GTmetrix.com.
- Enter the website URL and click “Test your site.”
-
In the resulting report, under the “Page Details” section, you’ll find the TTFB listed.

Field Tools
Field tools measure real-world user experiences, offering insights into how actual users experience TTFB under various conditions.
KeyCDN
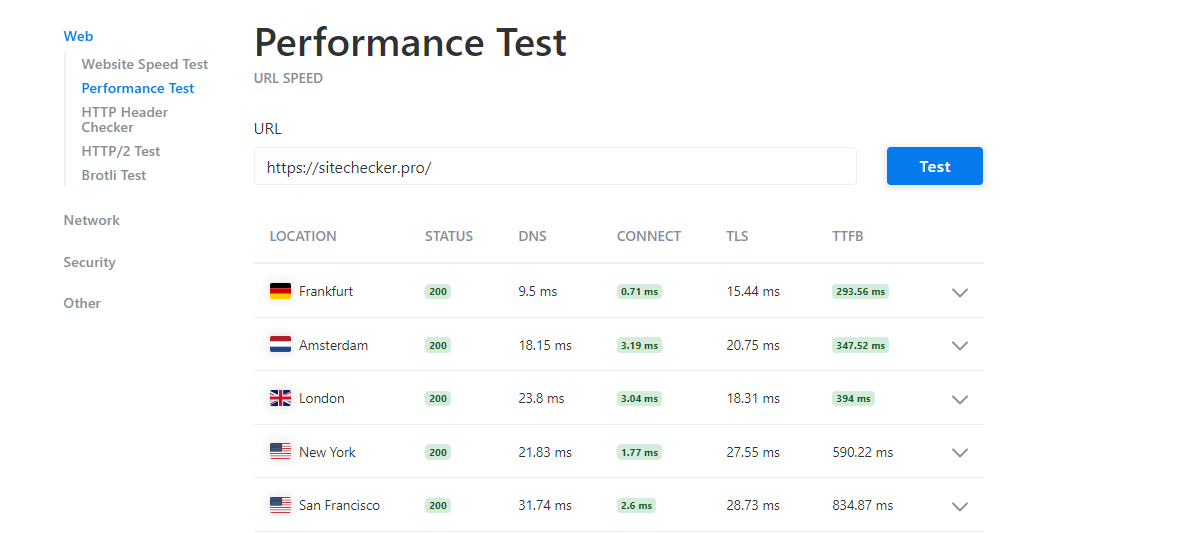
KeyCDN’s Performance Test tool allows for real-time TTFB measurements from multiple global locations:
- Visit KeyCDN’s Performance Test tool.
- Enter the website URL and click “Start.”
-
The resulting report provides TTFB measurements from various locations, offering insights into global performance.
In conclusion, while lab tools help identify potential optimization opportunities in controlled environments, field tools reflect real-world user experiences. Combining insights from both types of tools ensures a comprehensive understanding of TTFB and overall website performance.
Website Speed Test to Check Page Speed for Entire Website or Specific Page
The Website Speed Test tool by Sitechecker is an invaluable resource for anyone looking to optimize their site’s performance. In today’s digital era, a website’s load time can significantly impact user engagement, conversion rates, and even search engine rankings. With this tool, users get an immediate assessment of how quickly their site loads, pinpointing potential bottlenecks and areas for improvement.
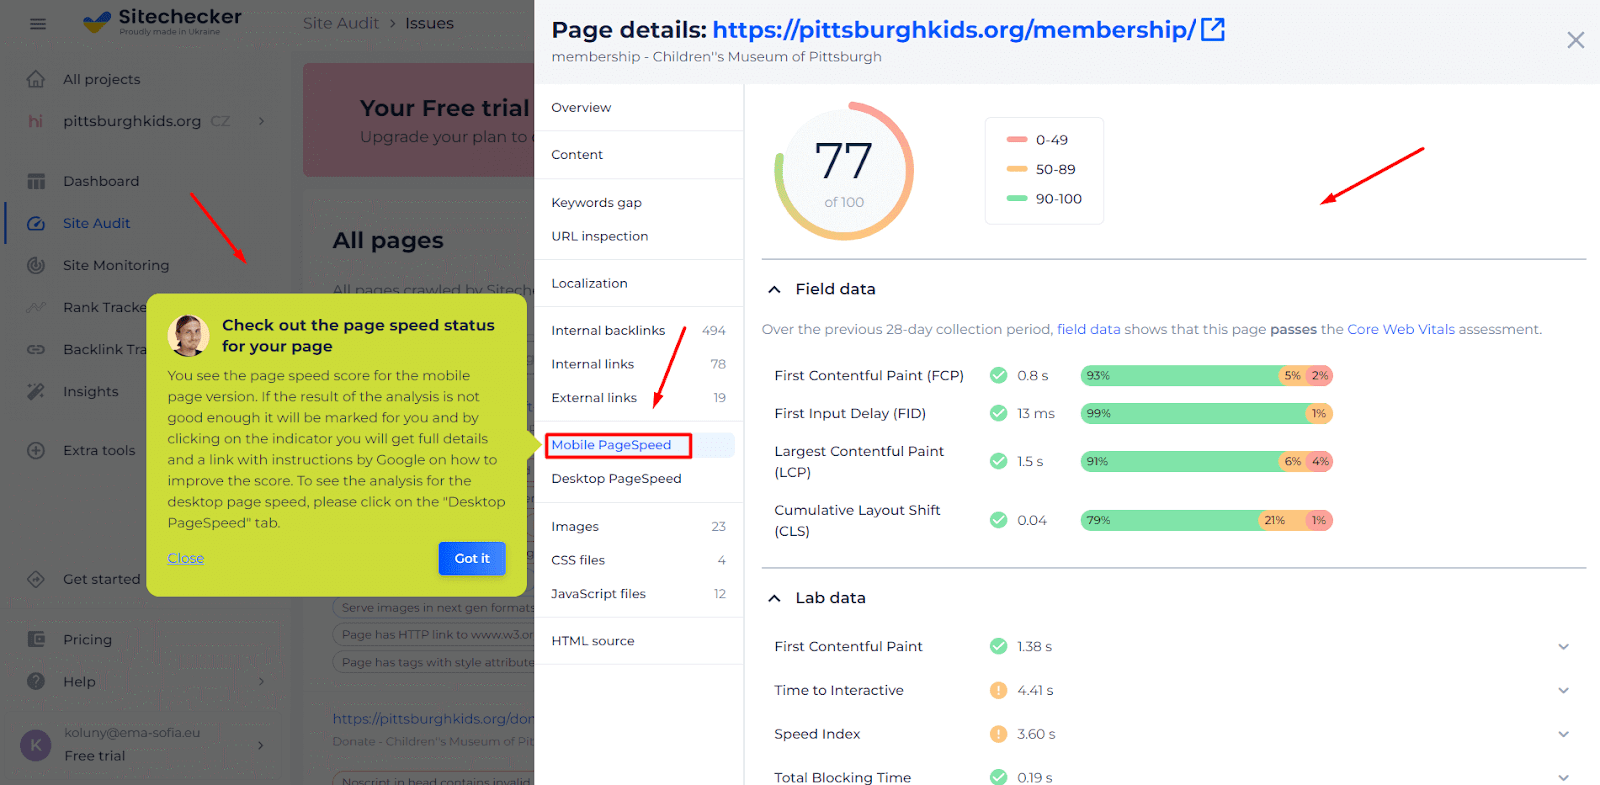
What sets this tool apart is its comprehensive analysis. Not only does it provide an overall speed score, but it also dives into specific elements that might be slowing down your site. From server responses to image optimizations, the tool offers actionable insights and recommendations, ensuring that you have all the information you need to enhance your site’s speed and overall user experience.
Unlock Peak Website Performance!
Discover what's holding you back and optimize it for the best user experience.
Conclusion
Measuring and understanding Time to First Byte (TTFB) is a cornerstone in the quest for web performance optimization. This critical metric offers a glimpse into server responsiveness, network efficiency, and early user experience. While a variety of tools, ranging from browser-specific utilities like Chrome DevTools to specialized platforms such as WebPageTest or GTmetrix, help in gauging TTFB, it’s the synthesis of these insights that leads to actionable improvements. Remember, in the digital realm, every millisecond counts, and optimizing TTFB is a step towards creating a faster, more responsive, and user-friendly web presence.


