")


1. GSC Dashboard
Overview
We’ve just launched Performance Overview, a new report inside Sitechecker that finally solves two main issues SEO professionals face with Google Search Console.
Data limitations and poor usability. GSC often restricts users to just 1,000 rows of data and lacks user-friendly filtering when handling large projects. We fixed that!
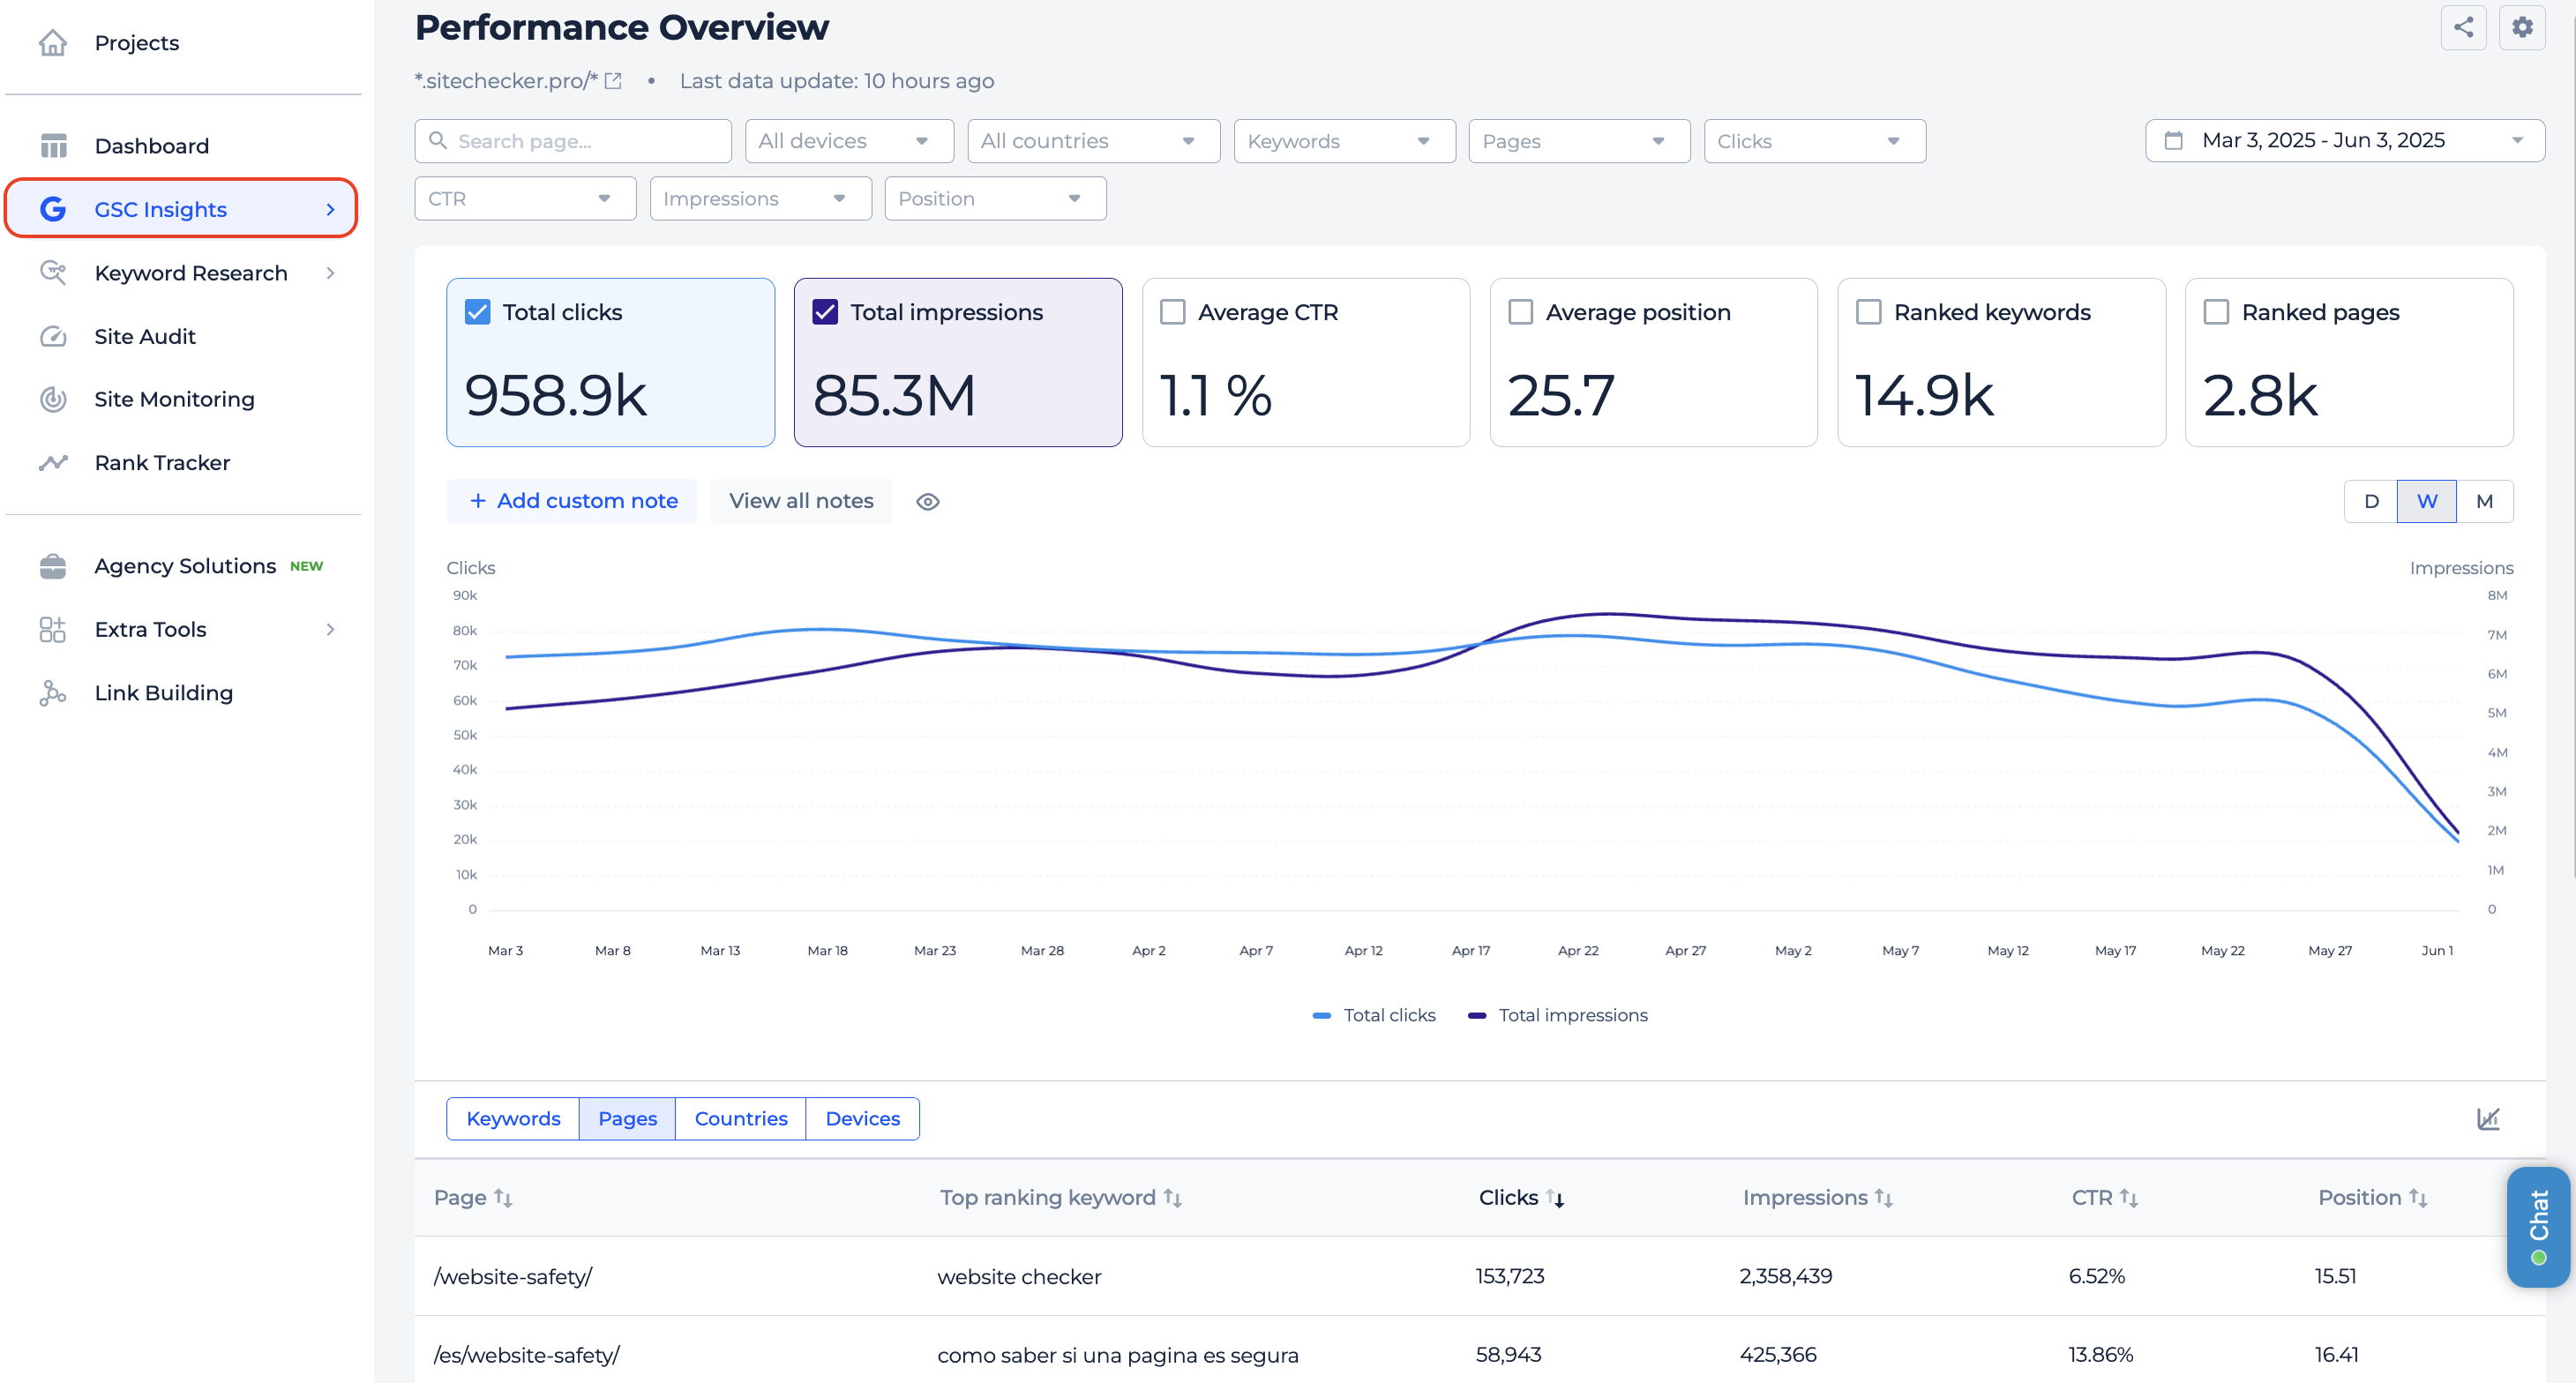
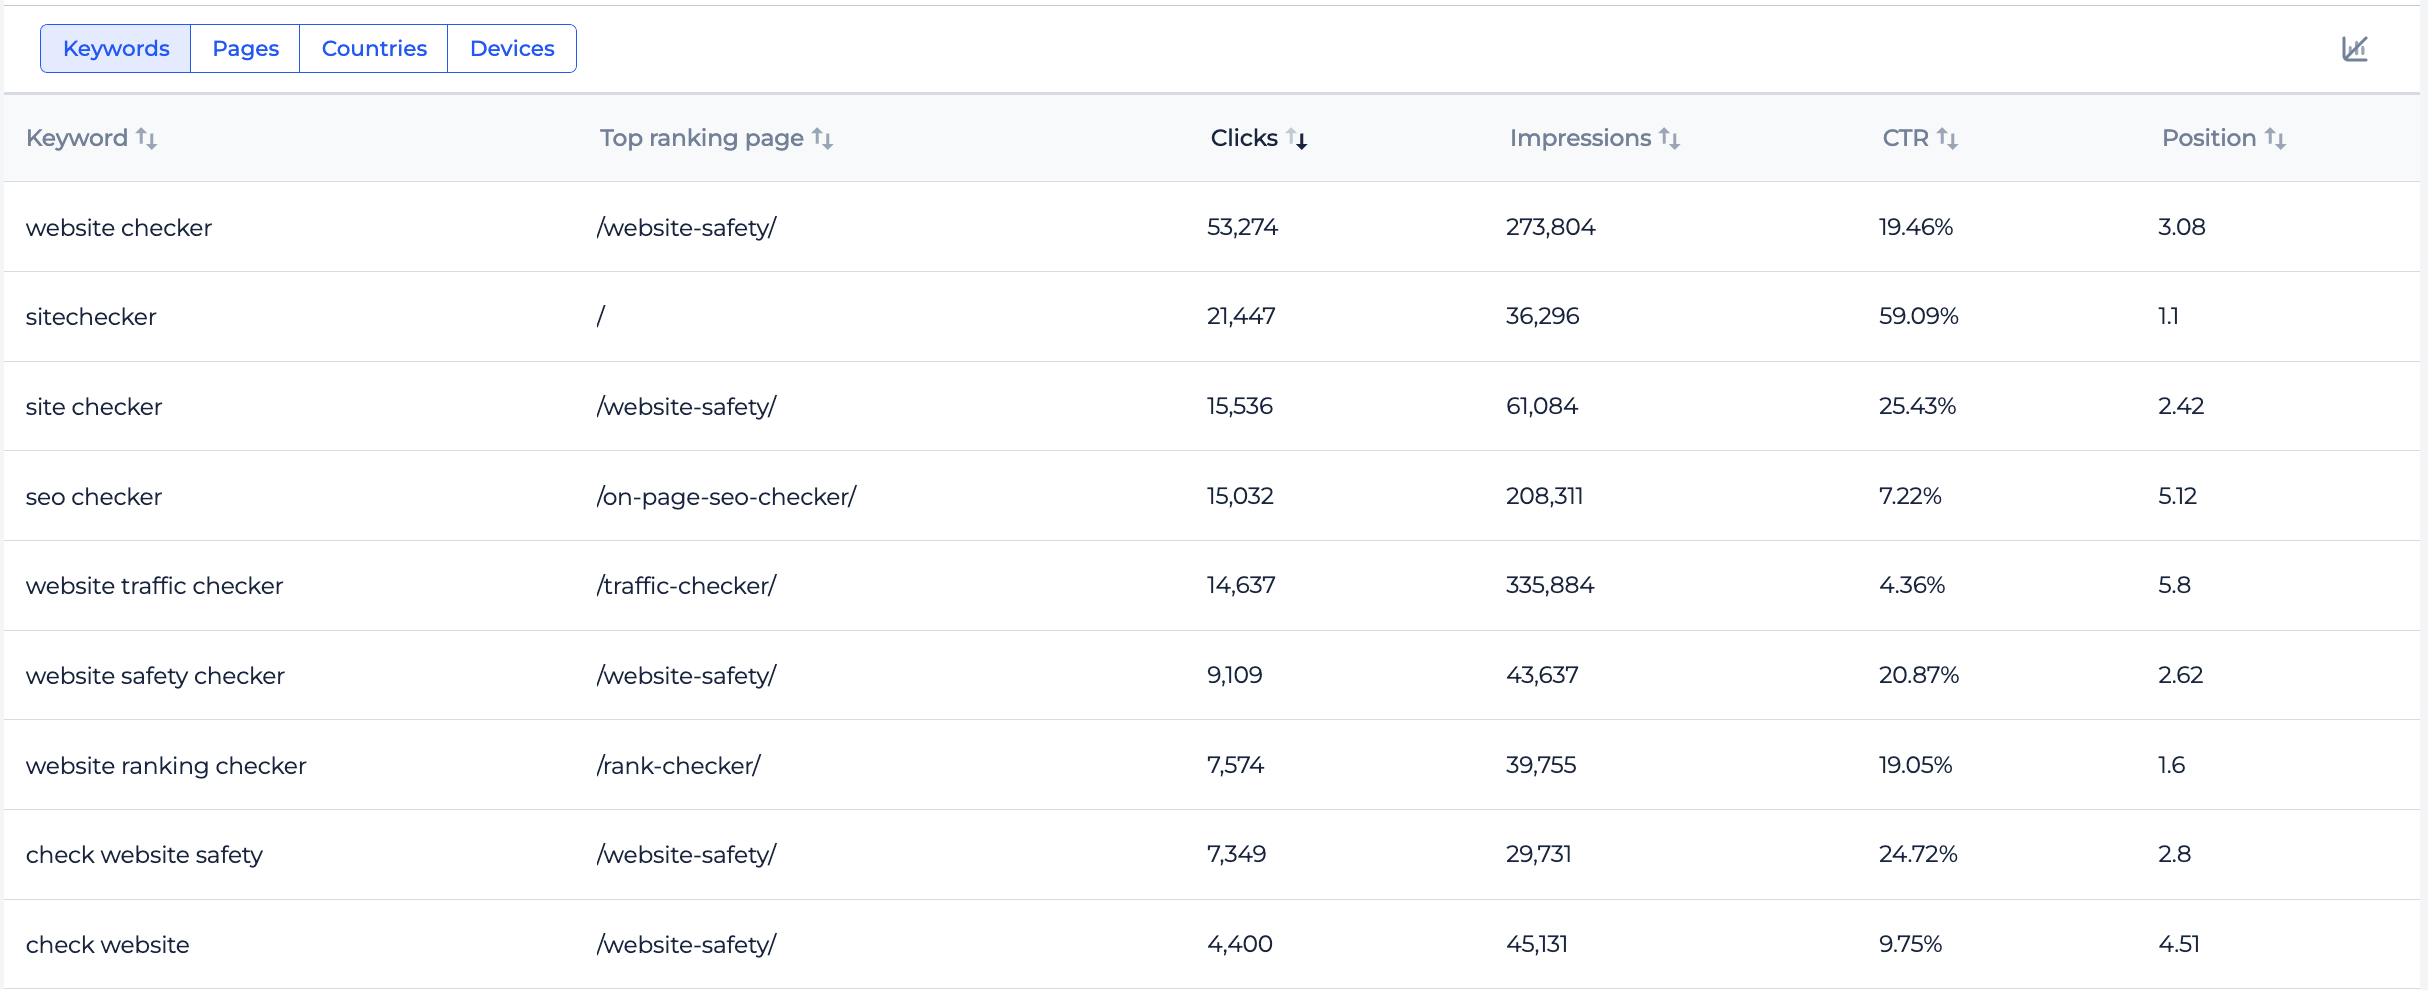
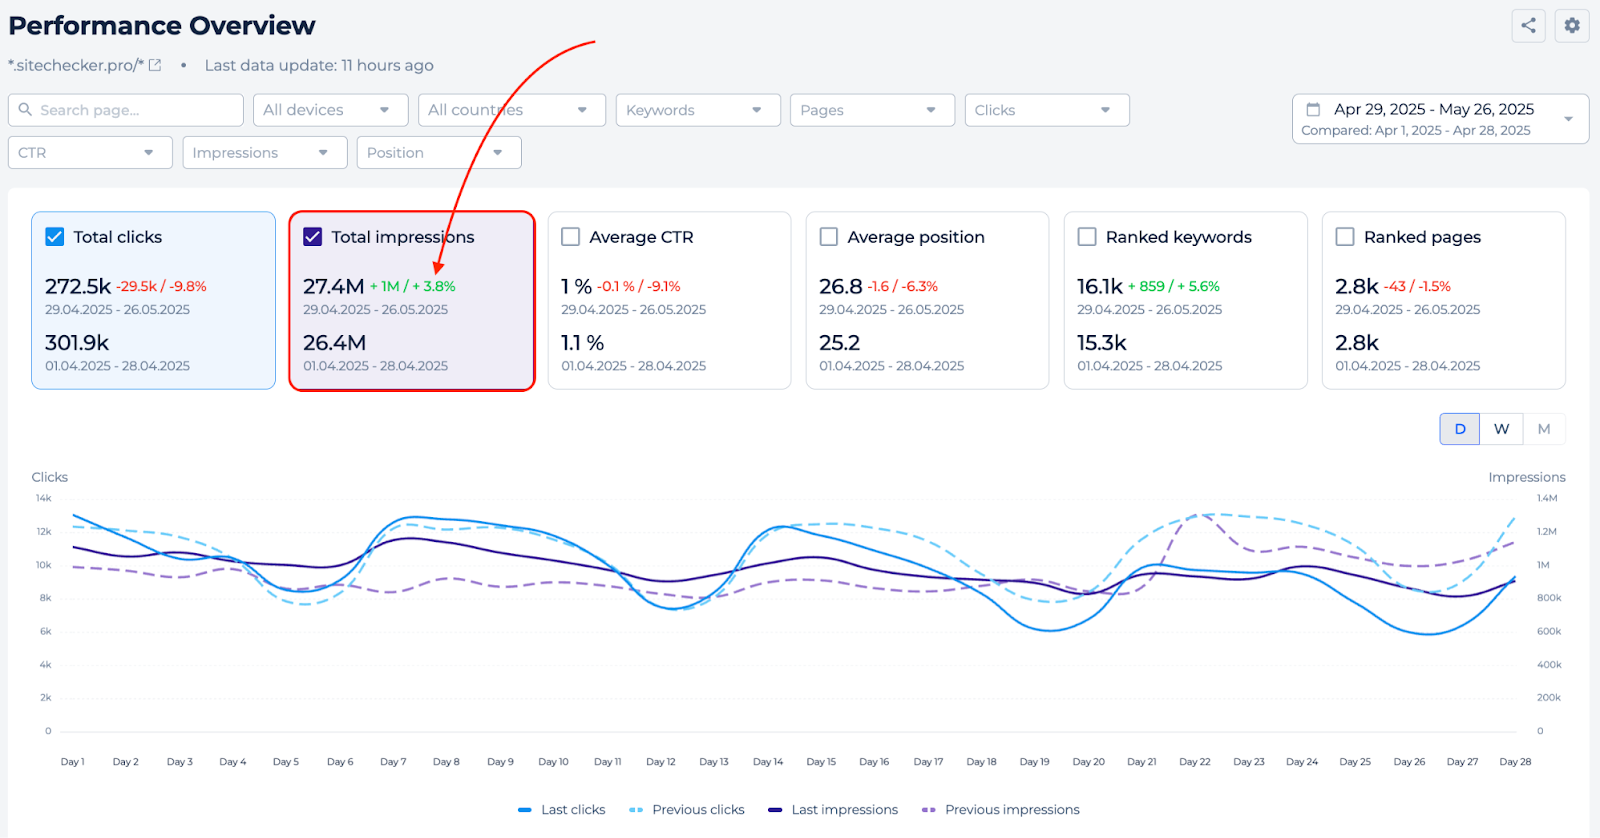
Sitechecker now stores up to 16 months of data and lets you analyze every keyword and page that brings you traffic. Once your data is synced, you’ll see a clean interface showing your total clicks, impressions, CTR, and average positions.
All sorted by keyword, page, country, or device. You can switch between daily, weekly, or monthly trends, depending on the selected time range.
Additionally, you can apply multi-condition filters and filters by metrics. You can filter them by pages or by keywords at the top of the page to get even more detailed insights.
Compare
Comparison report built specifically to help you track growth and spot drops with more clarity.
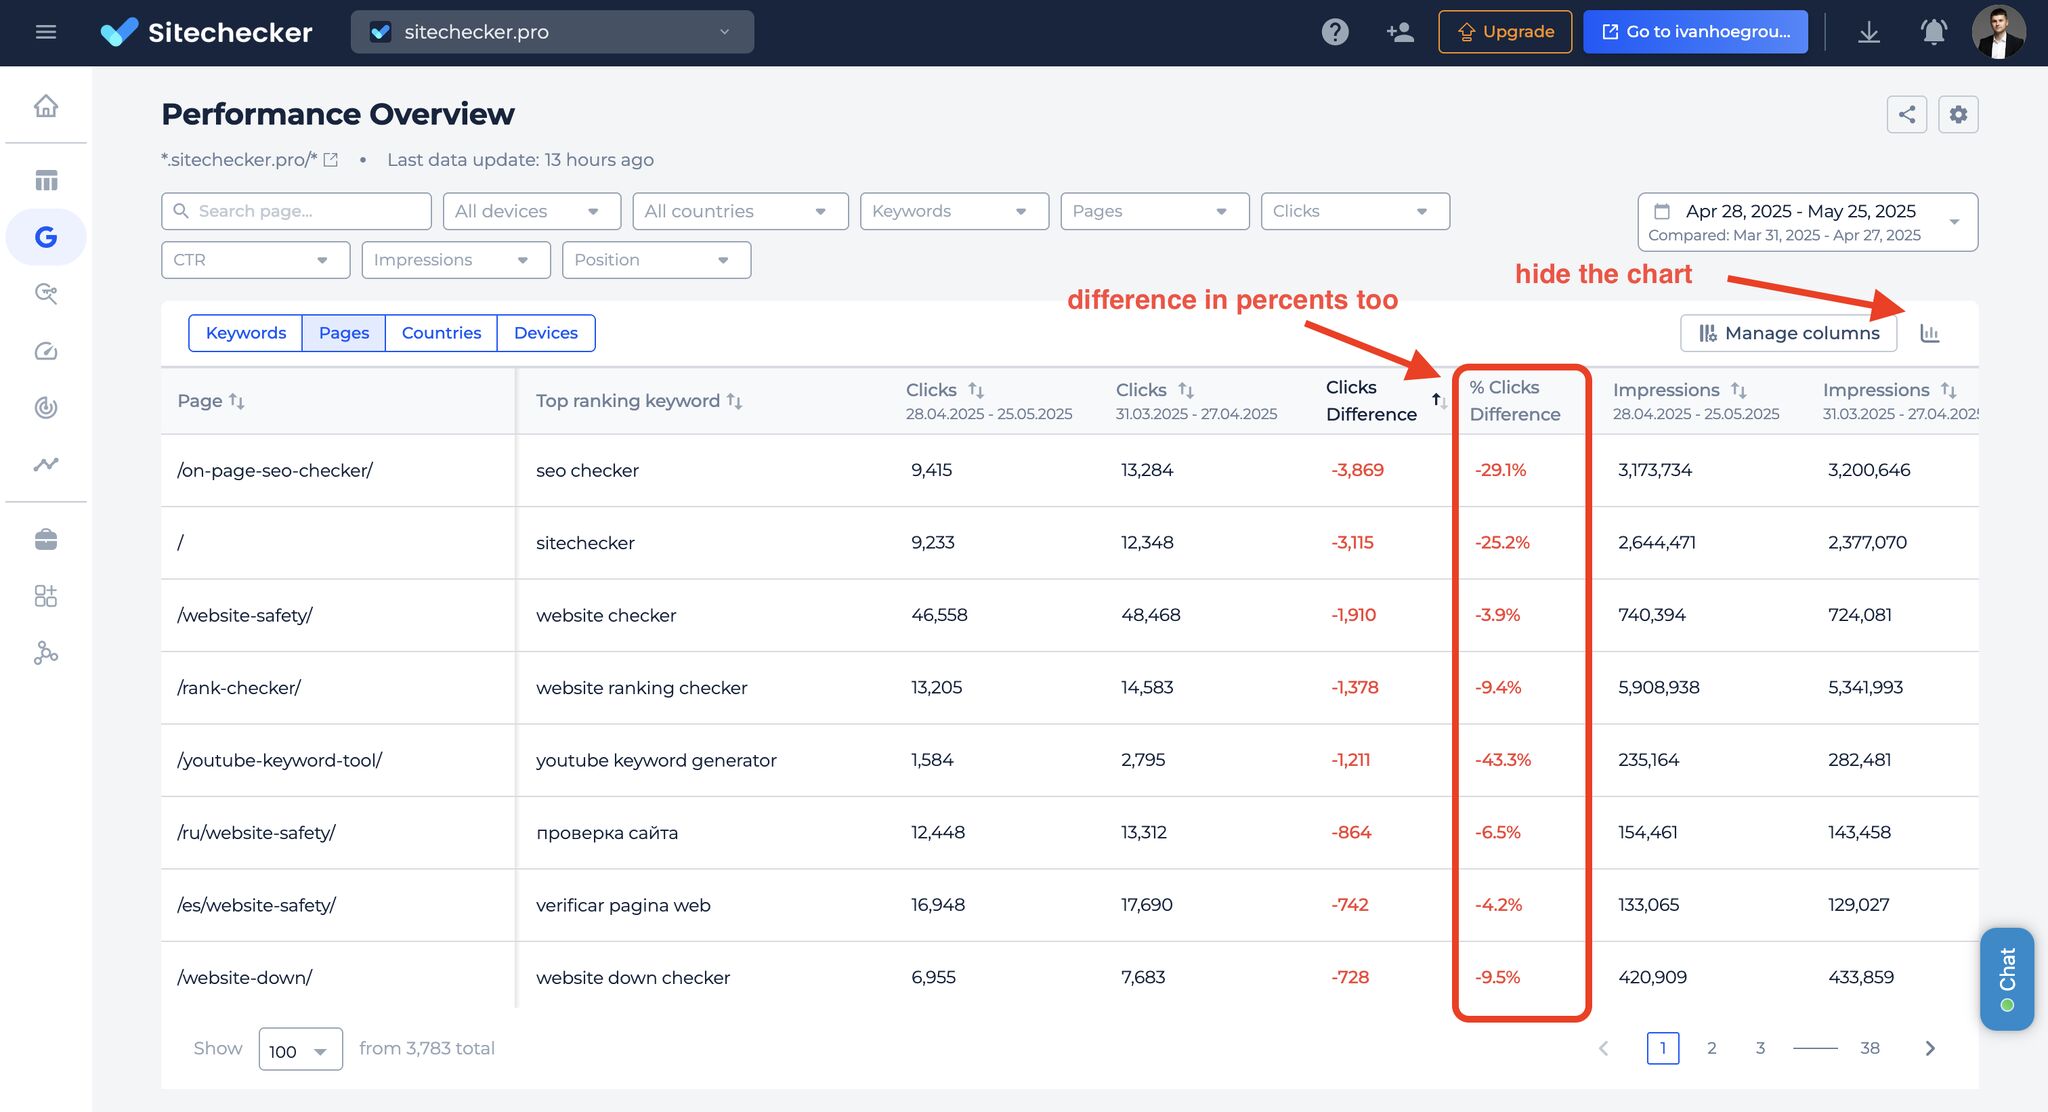
This new report includes all the key features of the standard Performance overview. But now you can compare two periods side by side.
Two things that make it a better version of GSC native report:
Built-in calculator that shows both % change and absolute delta on the chart.
Additional column in the table for measuring metric difference in percentage.
You will get a chart that will show the previous and the current period. And also the table with both absolute and percentage change shown in separate columns.
Search performance of last found pages
The new Last Found Pages report automatically finds pages that were most recently discovered by Sitechecker’s crawler and checks how they’re performing in search.
This way, you can easily keep track of how your latest added URLs are doing in terms of clicks, impressions, average position, and other GSC metrics.
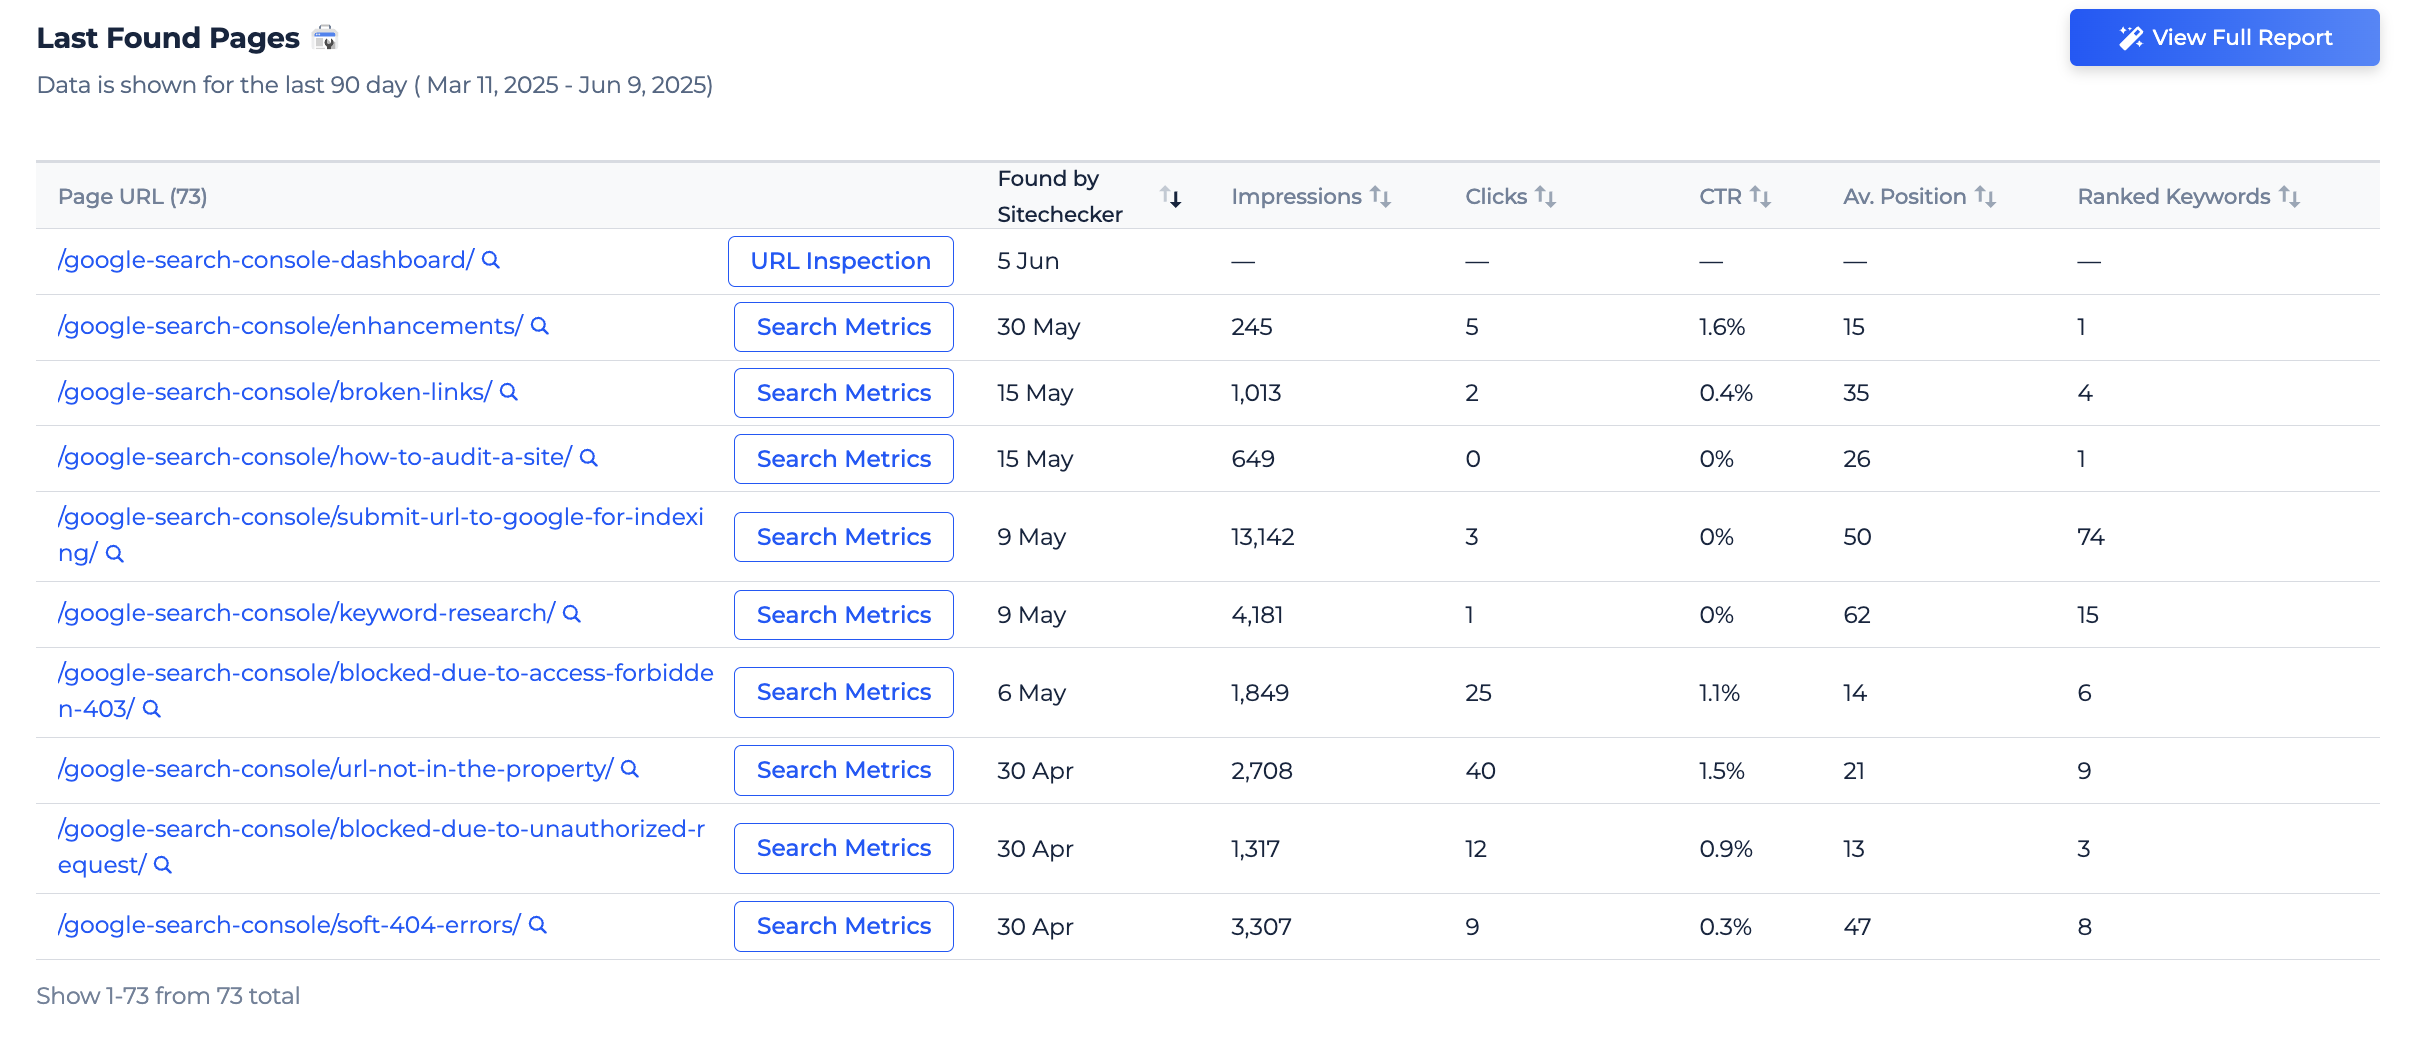
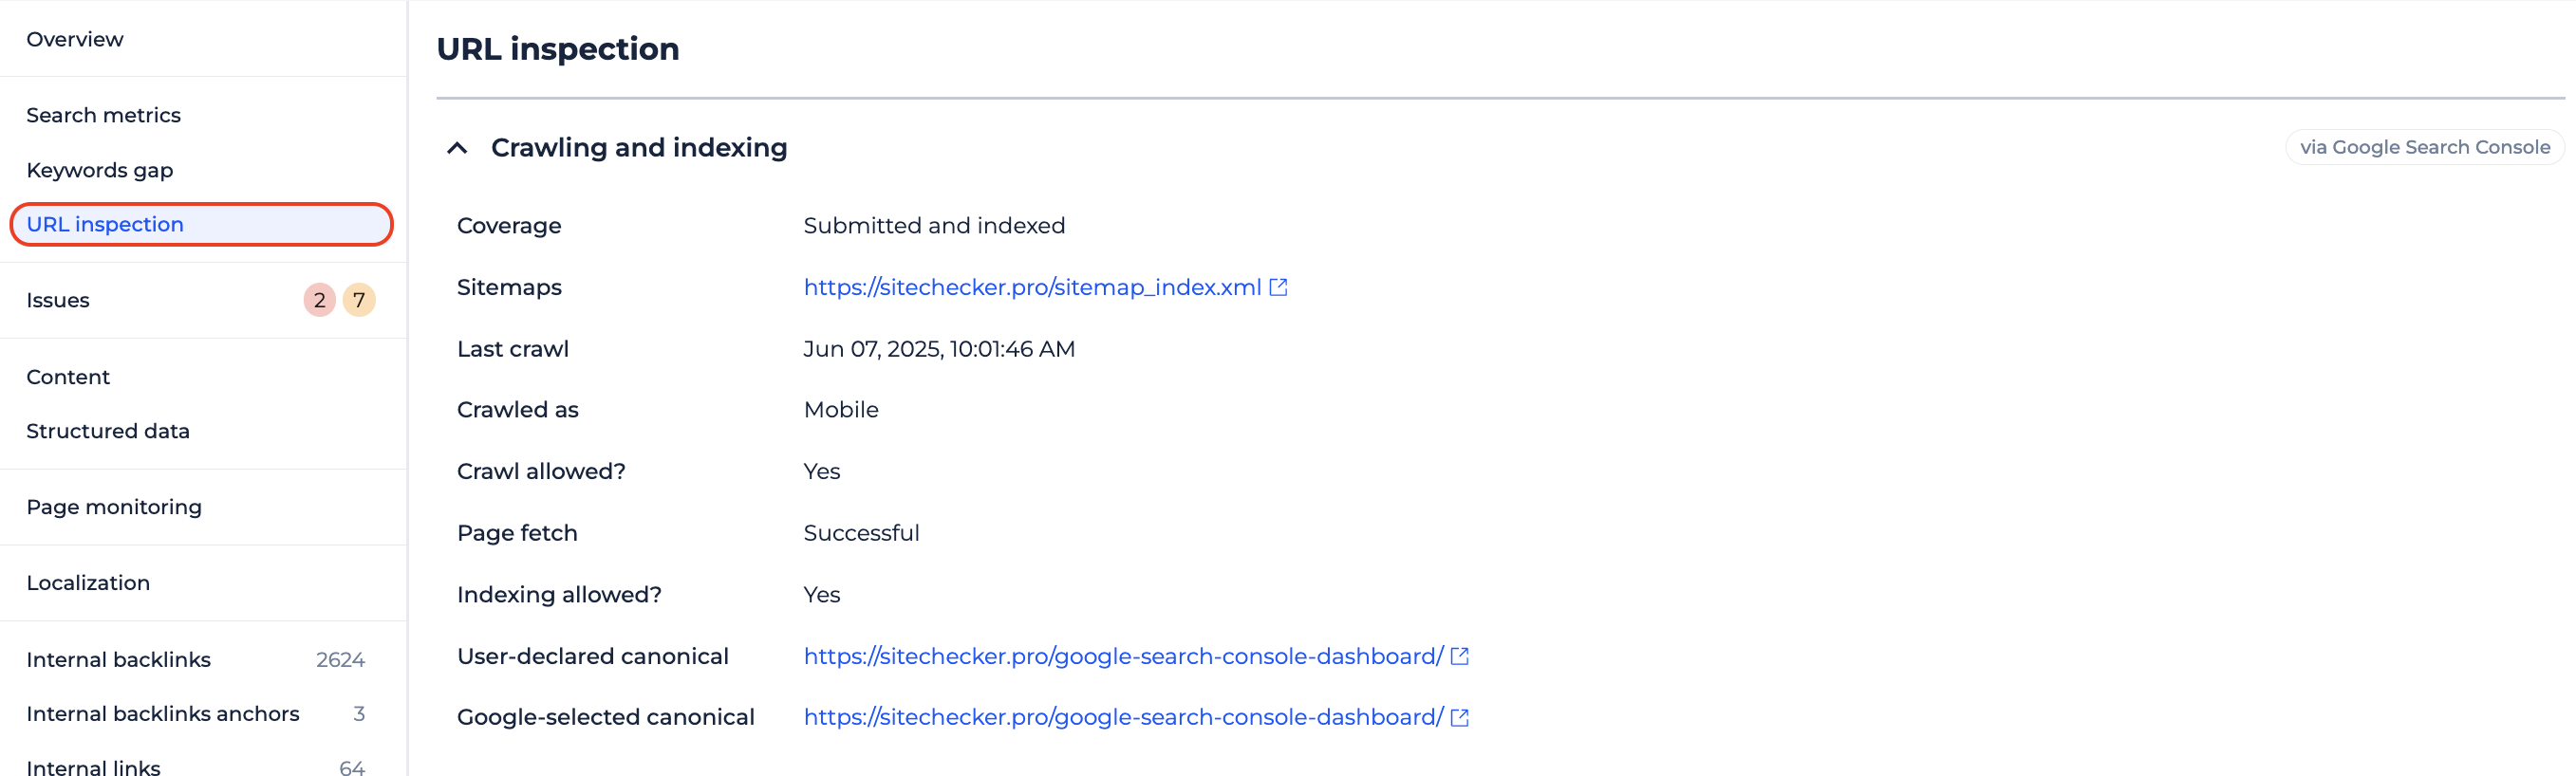
If there’s no GSC data for a page, we offer a quick link to run URL Inspection, so you can check indexation status right away.
This report helps you stay updated about your fresh content and gives you a faster way to identify which pages are already gaining impressions and clicks and which ones still need your attention.
This is just a first iteration. In the next weeks, wait for:
– Comparison report
– Keyword cannibalization report
– Keyword gap report
– New and lost keywords
– New and lost pages
– Performance by page segments
– Performance by keyword segments
– Brand / non-brand filter and more.
2. Chrome extension charts
We’re giving more clarity to our GSC performance metrics tab in the Chrome extension.
Based on user feedback, we’ve added a graph to the GSC Insights tab so you can quickly spot trends in clicks, impressions, CTR, and average position, all in one place.
You can toggle metrics on and off, use presets to change the date range, and interact with each point to see exact values.
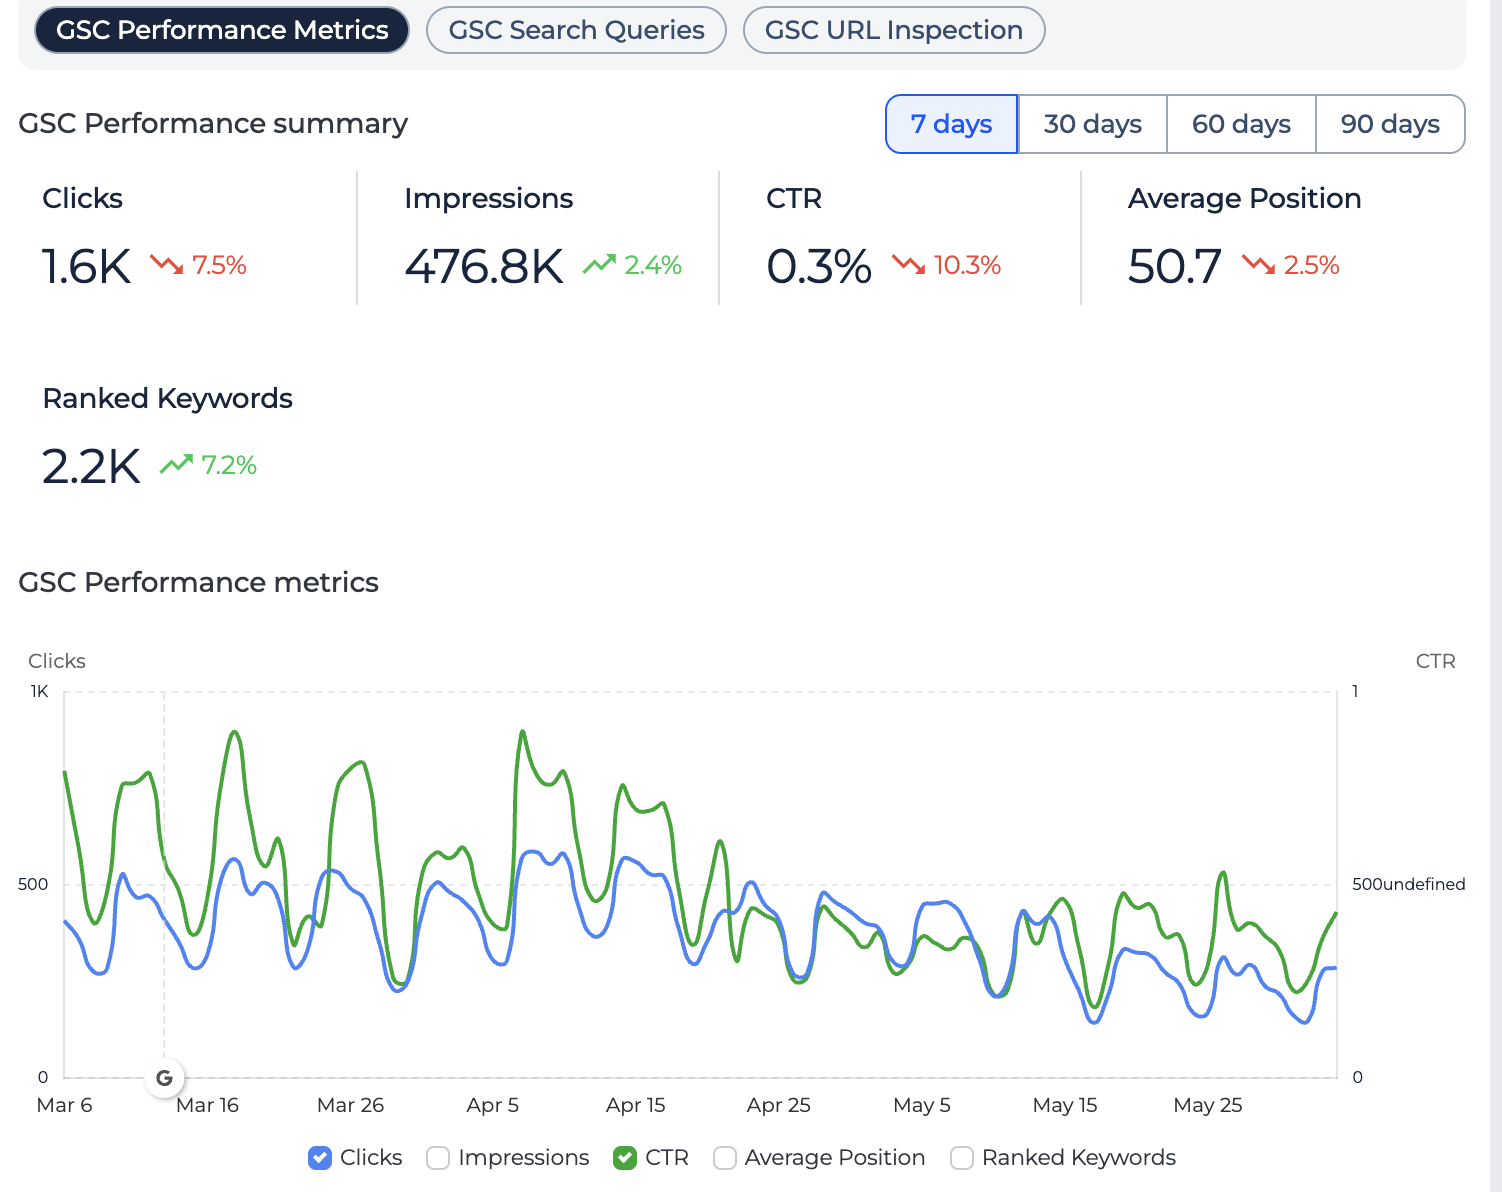
Now, you can see all your on-page data from GSC without leaving the page you want to analyze.
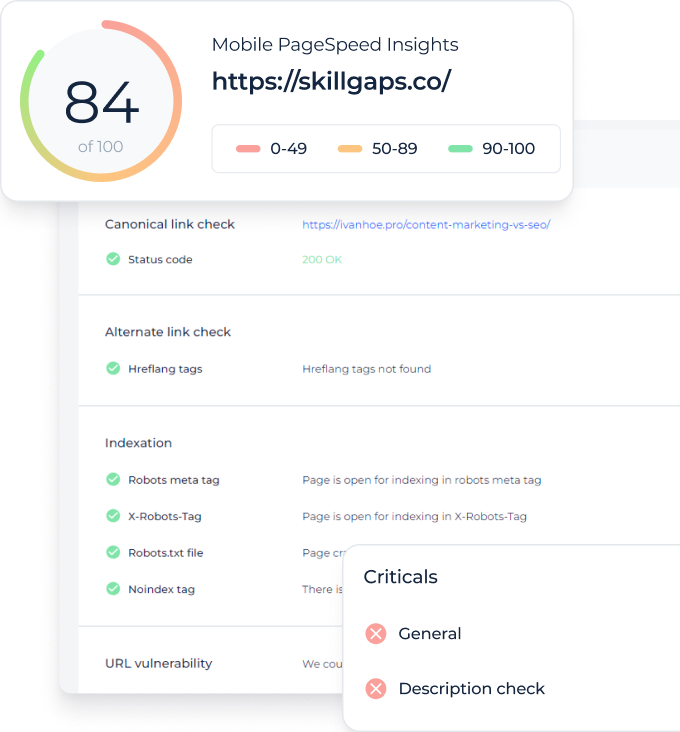
3. Content changes on the GSC chart
We’ve rolled out a new feature to the Search Metrics tab in Page details that makes it much easier to understand how changes on a page affect its performance in search.
From now on, if Sitechecker detects content changes on a page, you’ll see special event icons appear directly on the two graphs inside the Search Metrics tab.
These markers help you visually connect changes to page titles, headings, meta tags, and indexation status with shifts in clicks, impressions, or rankings.
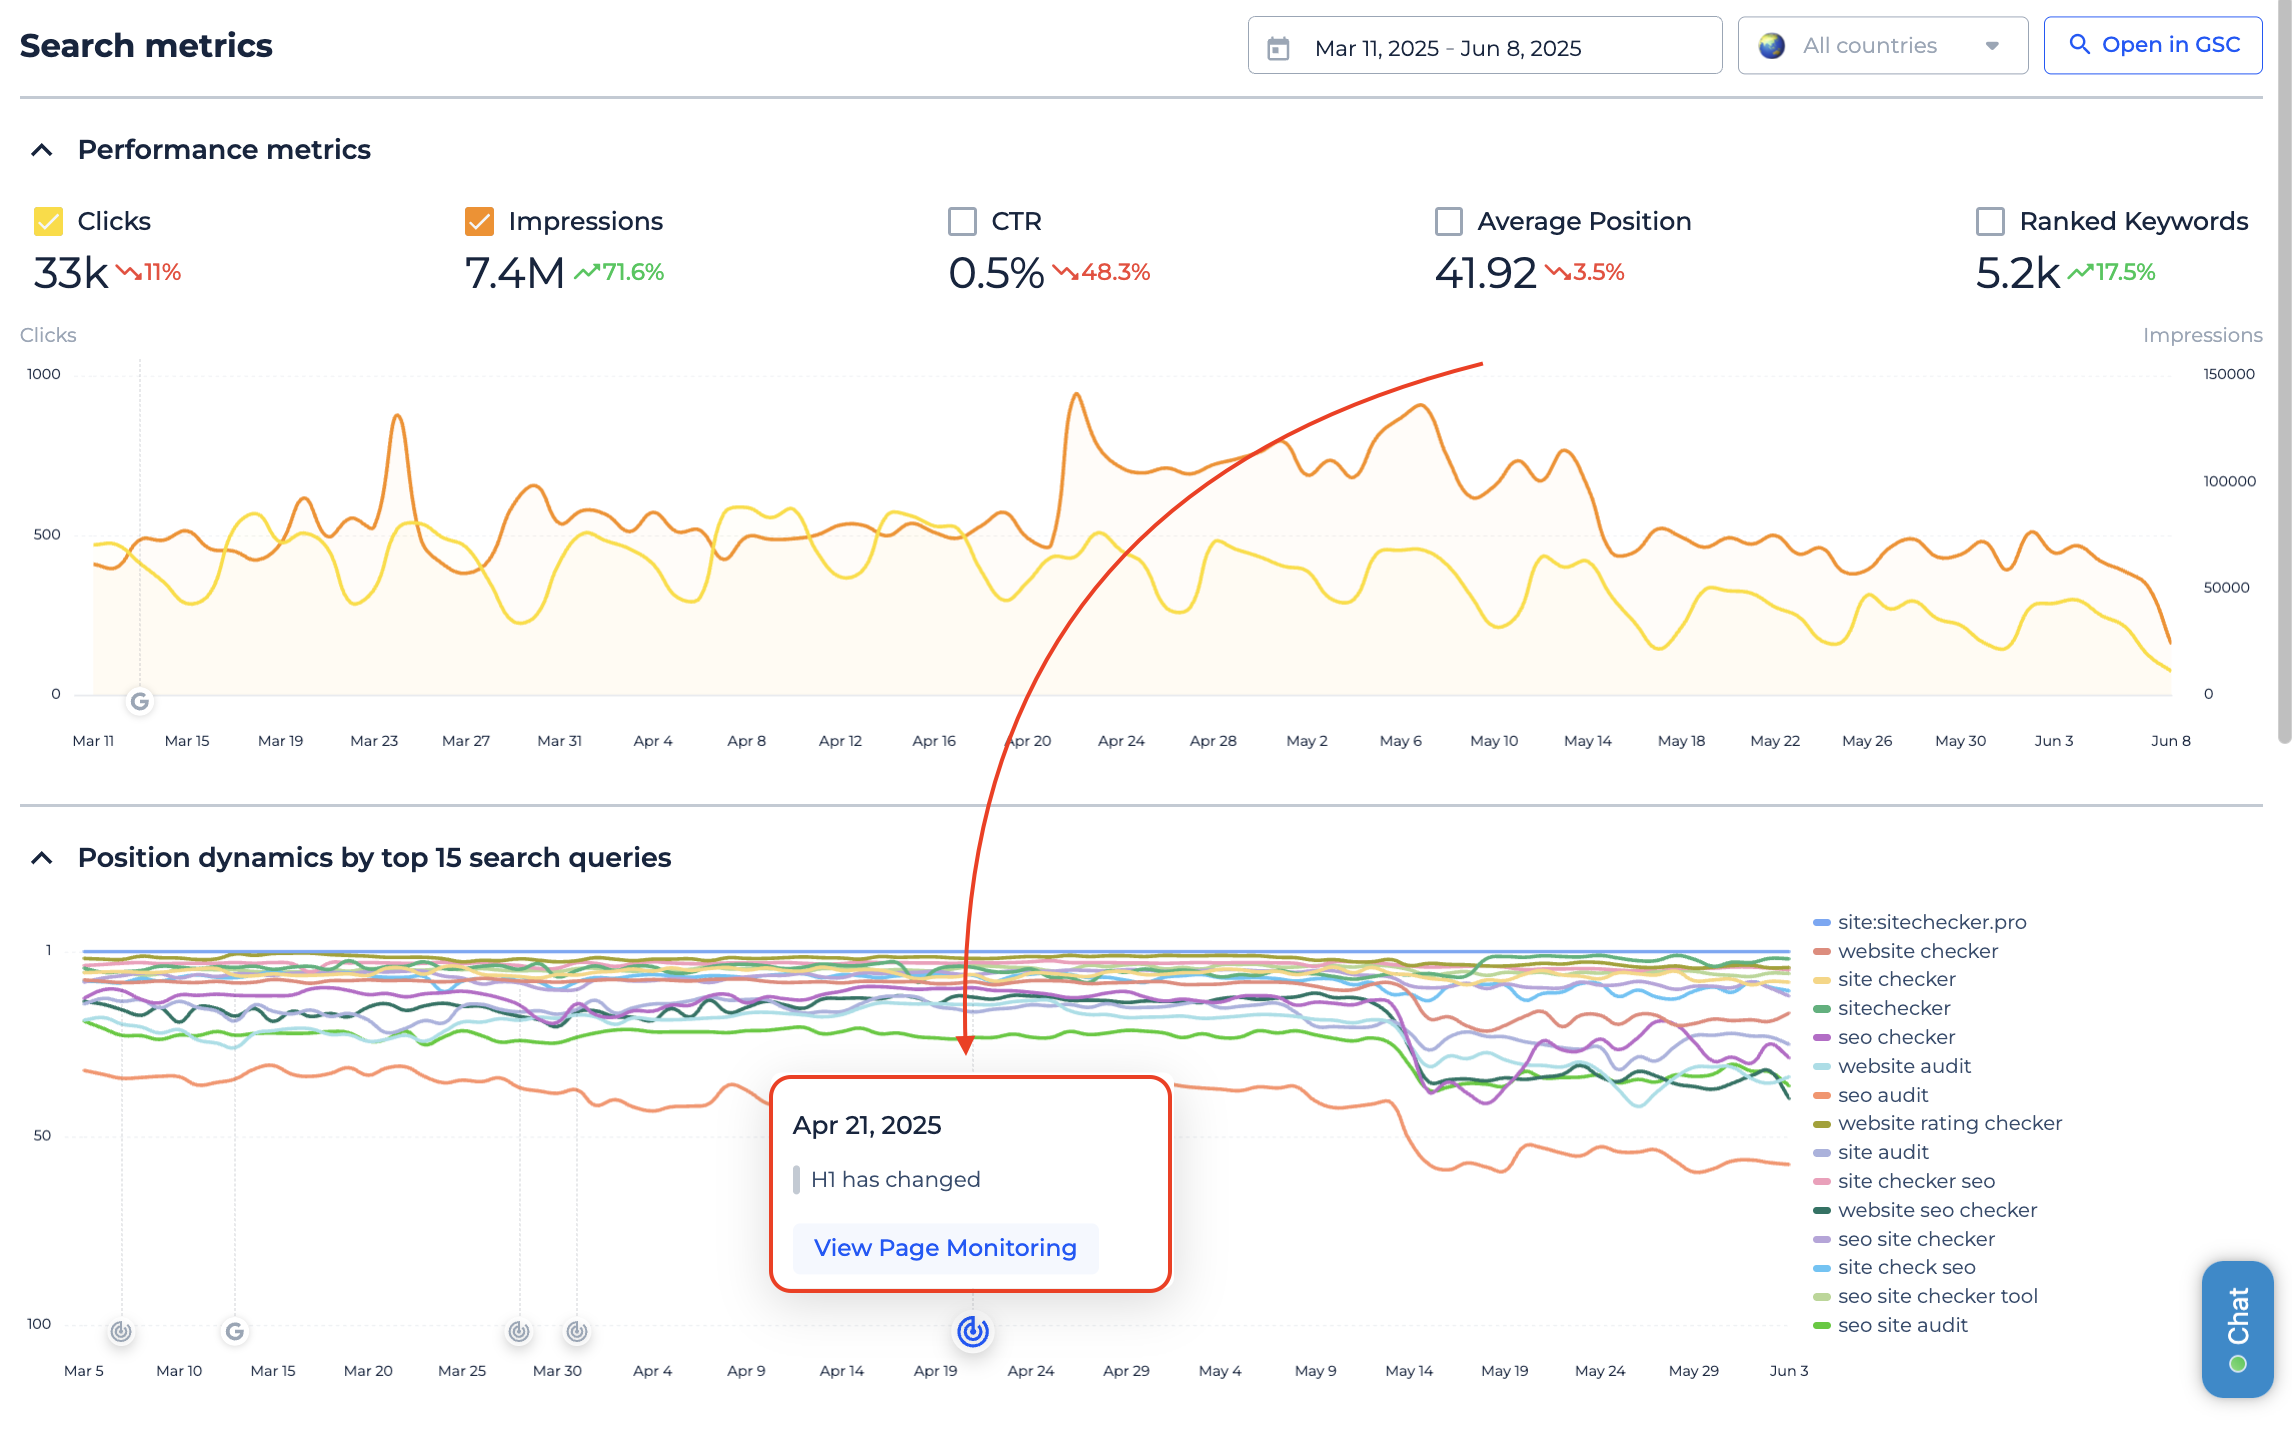
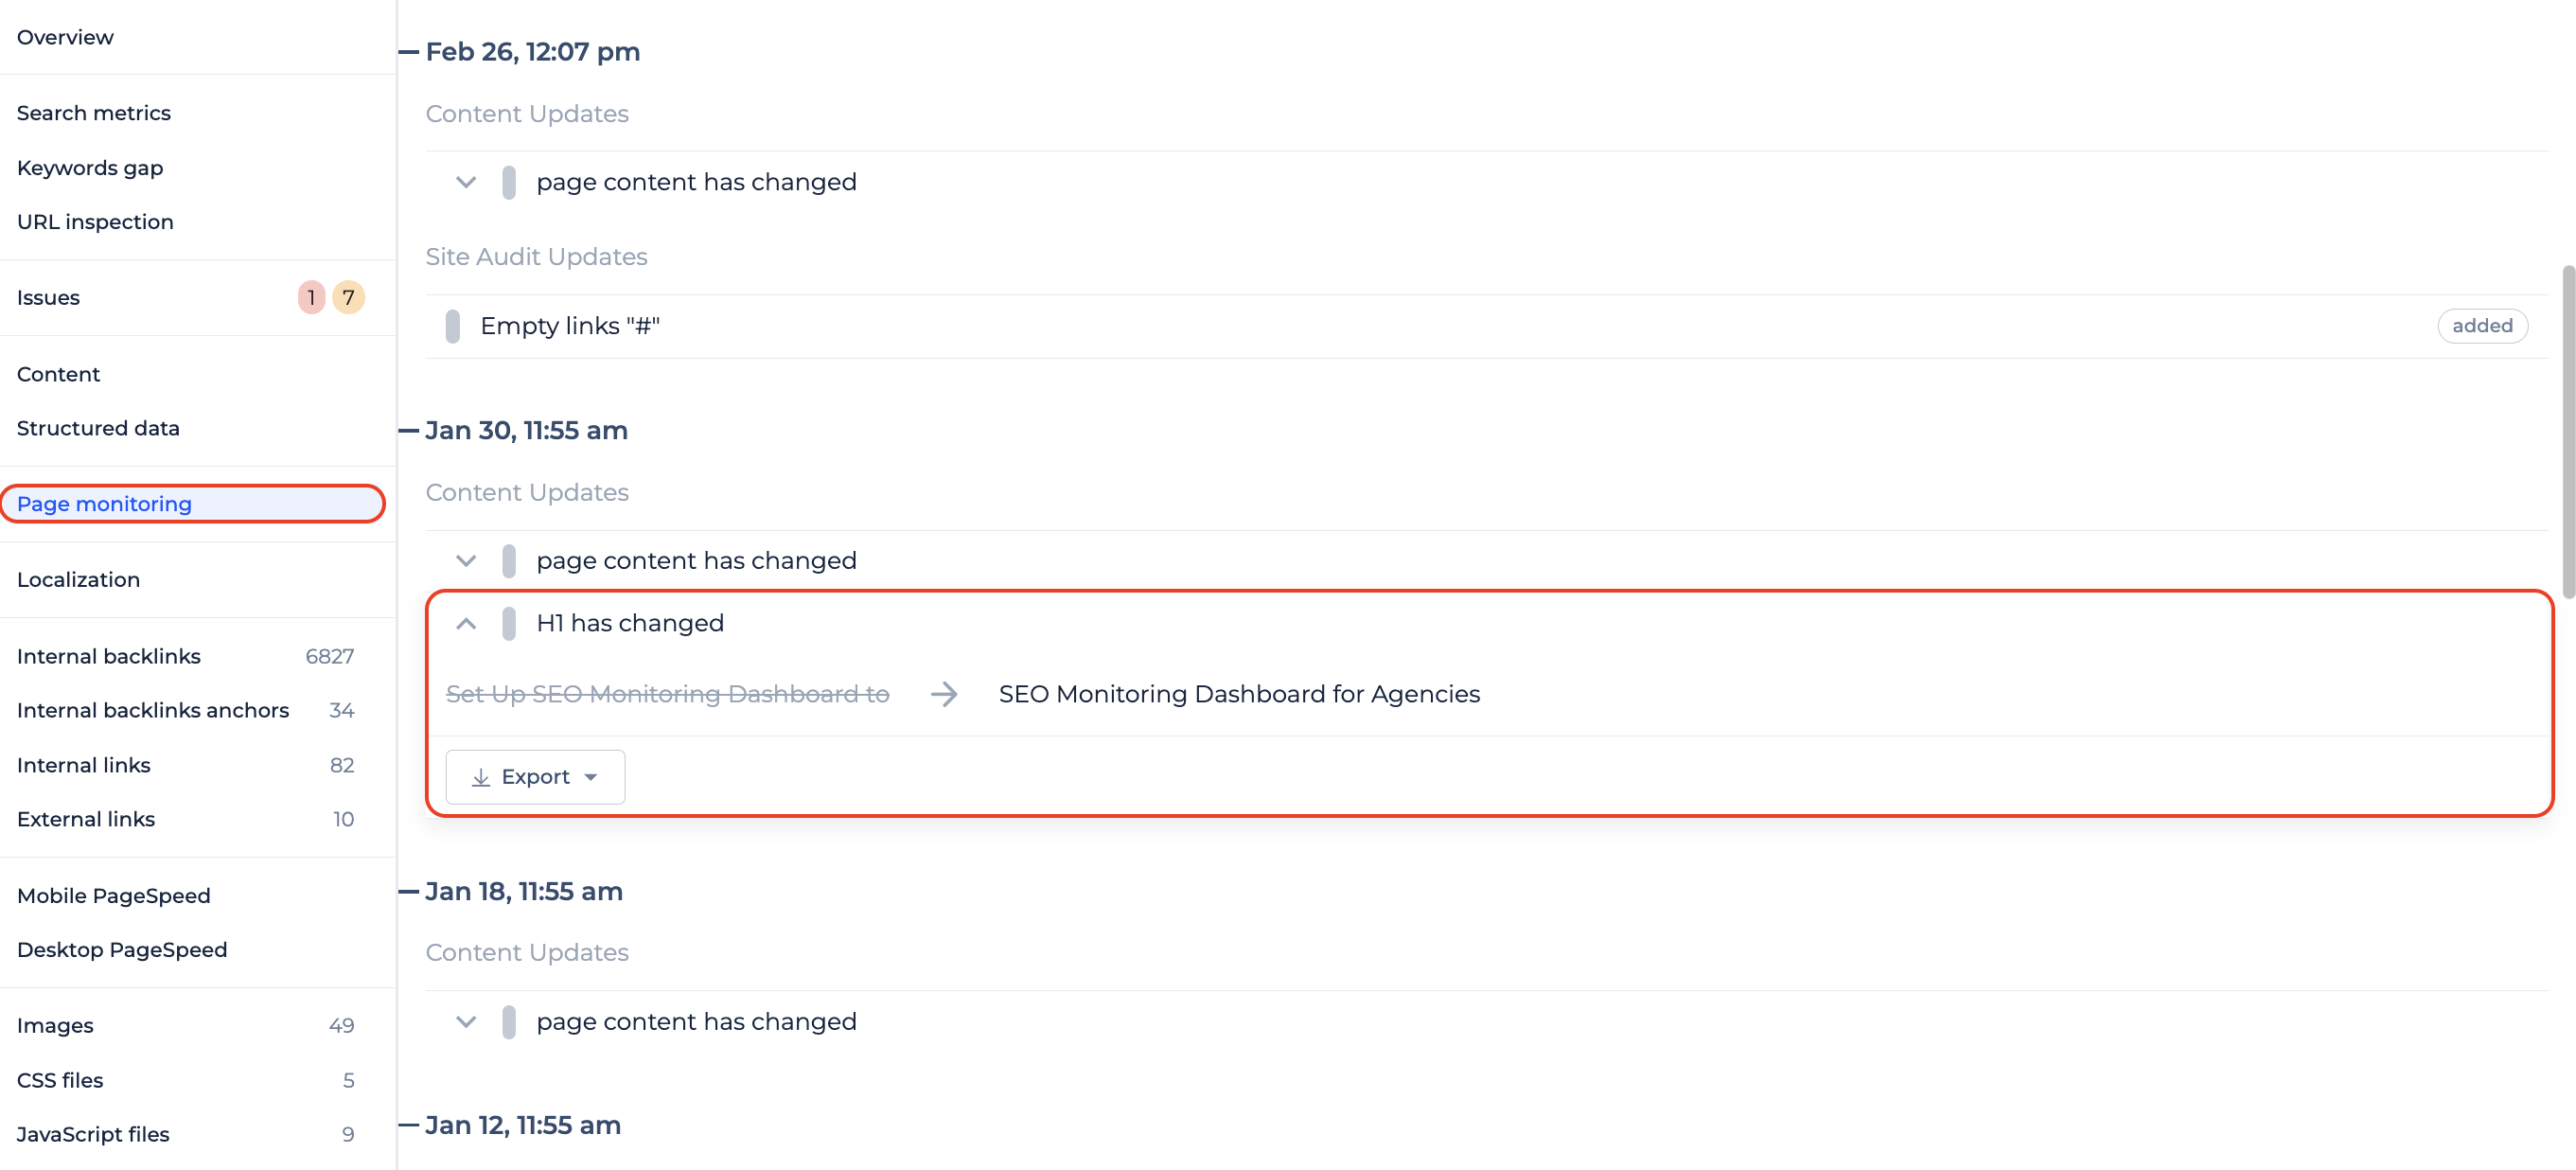
When you hover over the icon, a popup shows exactly what changed that day. If you want to go deeper, clicking the View Page Monitoring link will take you straight to the full timeline of changes for that page.
Even if your site is crawled weekly or less often, most use cases will still benefit from this insight. The marker reflects the day the change was first detected, giving you a clear signal to start your investigation.
4. Dashboard updates
Top pages widget
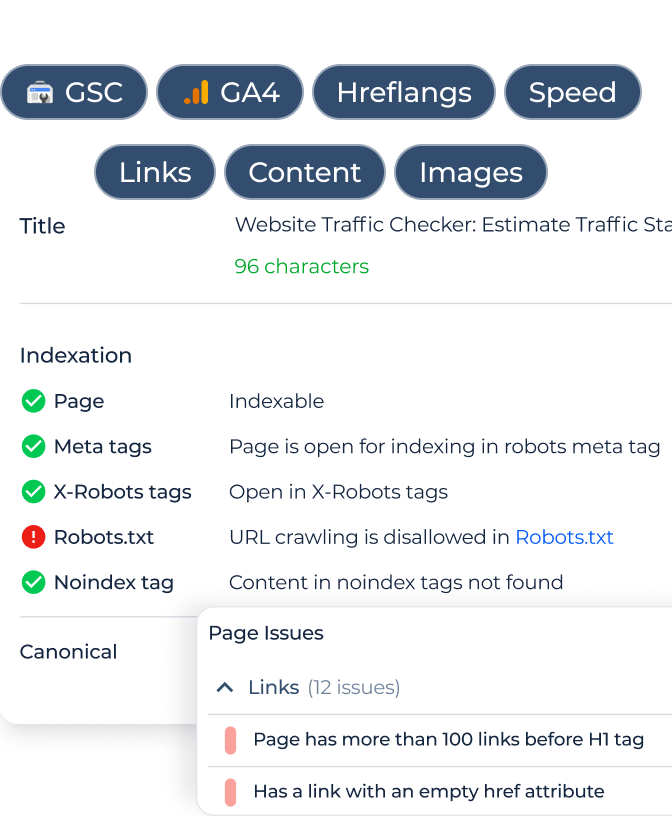
We’ve added a new widget called Top Pages Audit to help you quickly identify which pages on your website are the heaviest and the most problematic from a technical SEO perspective.
This widget shows the top 100 pages from your Site Audit report. Next to them, you’ll see all the familiar columns from Site Audit, including URL, Page Score, Indexability, and more.
After clicking on the page URL or the View Issues button you will go straight to the Issues tab for that page, so you can start fixing right away.
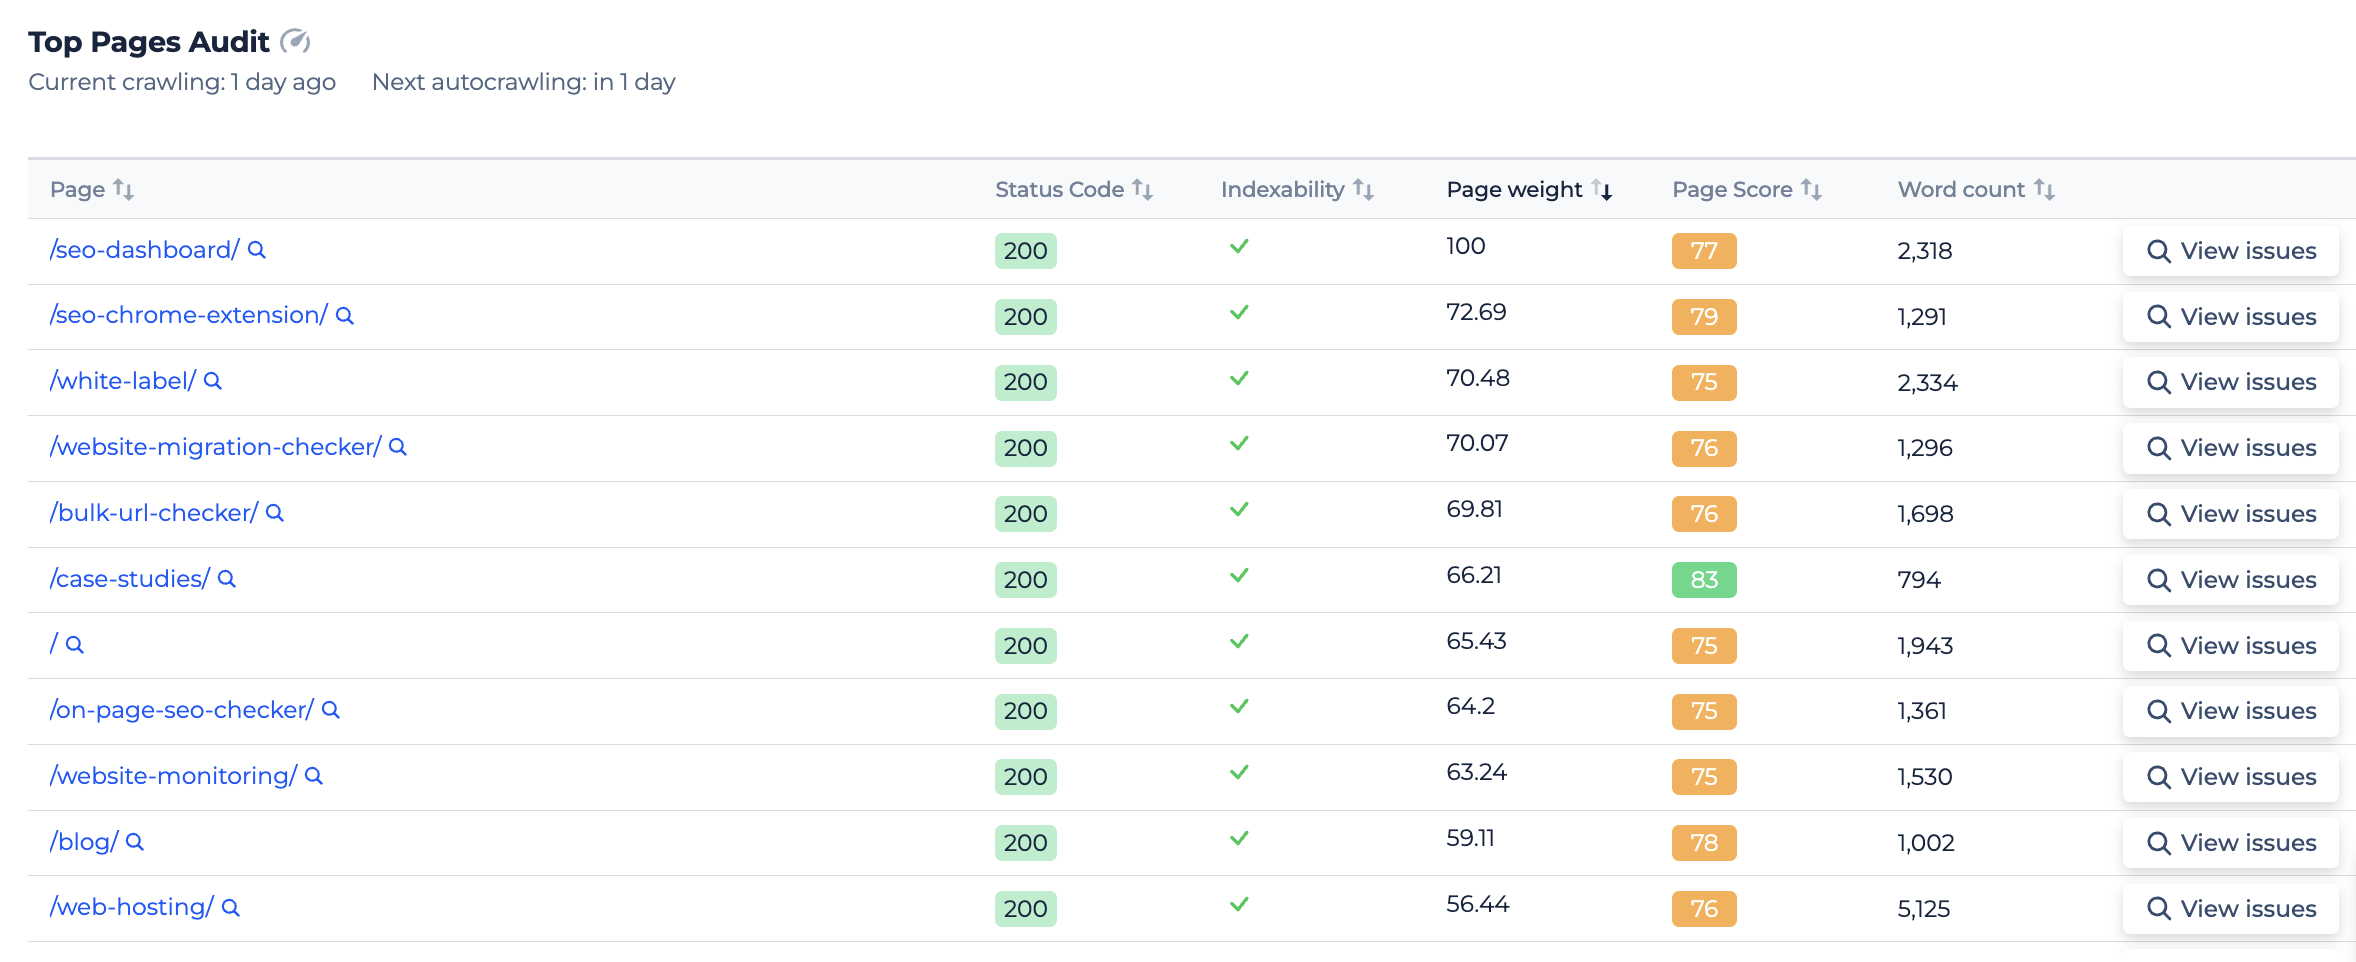
With this new widget, you’ll save time during audits and will not miss a critical page that’s dragging down your performance.
Top 10 Pages and Keywords in PDF Export
Previously, exporting your Dashboard would include all 100 rows for both Top Pages and Top Keywords sections. This often made the PDF unnecessarily long and harder to review.
From now on, the export will include only the top 10 entries in each of those sections, keeping the sorting order exactly as it appears in the app.
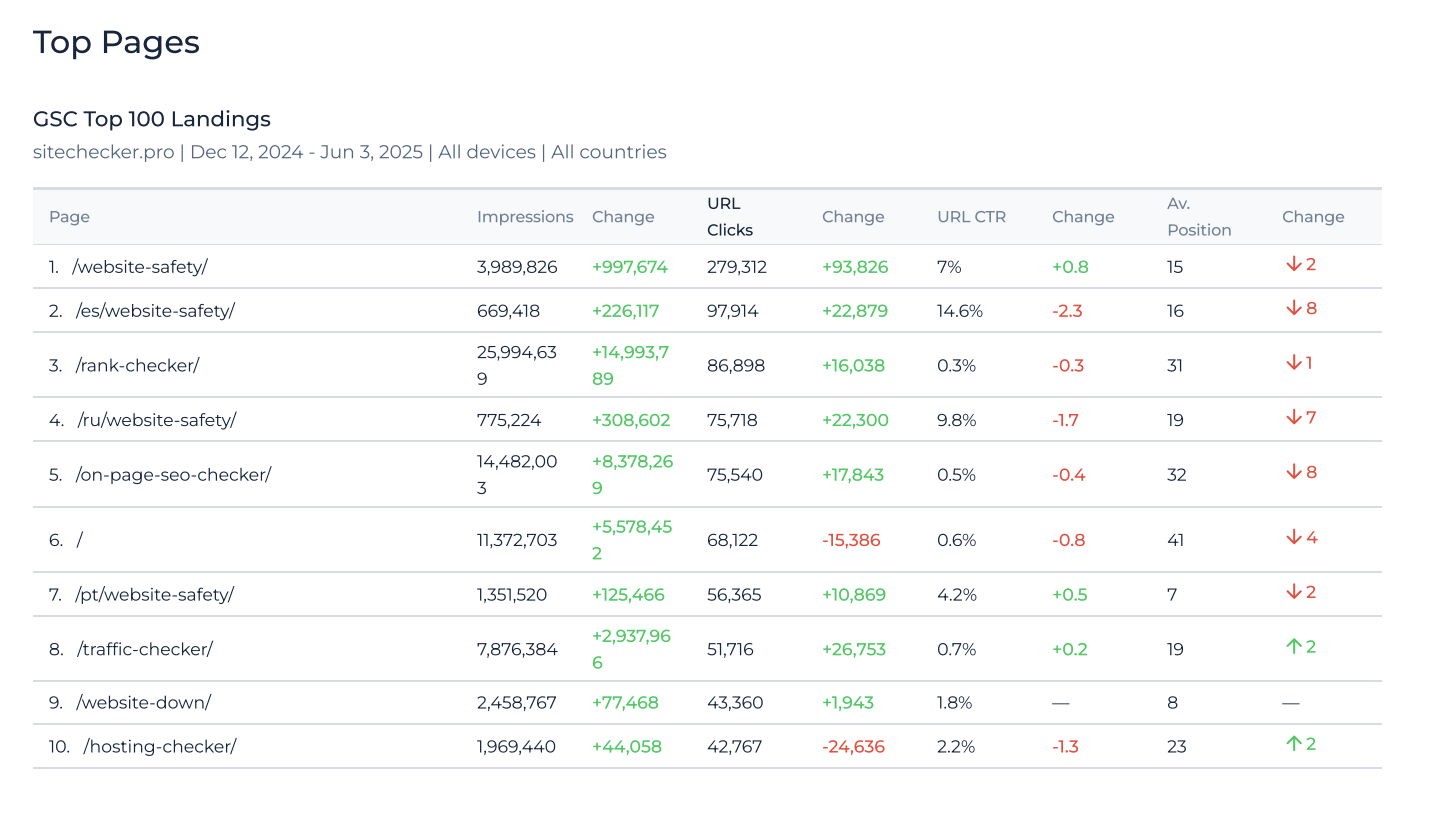
This change keeps your PDF reports clean, fast to generate, and easier to share with clients or teammates.
5. Link building page
We’ve replaced the outdated Services page with a brand-new Link Building section that makes it easier to find and collaborate with trusted SEO partners.
In the Agencies tab, you’ll find top outreach providers like Needmylink, Insert Link, Natural Links, FatJoe, and Loganix.
In the Marketplaces tab, we’ve listed high-quality platforms including Bazoom, PressWizz, WhitePress, MeUp, and PRNews. These are carefully selected partners we trust and use ourselves, making it easier for you to scale link-building campaigns.
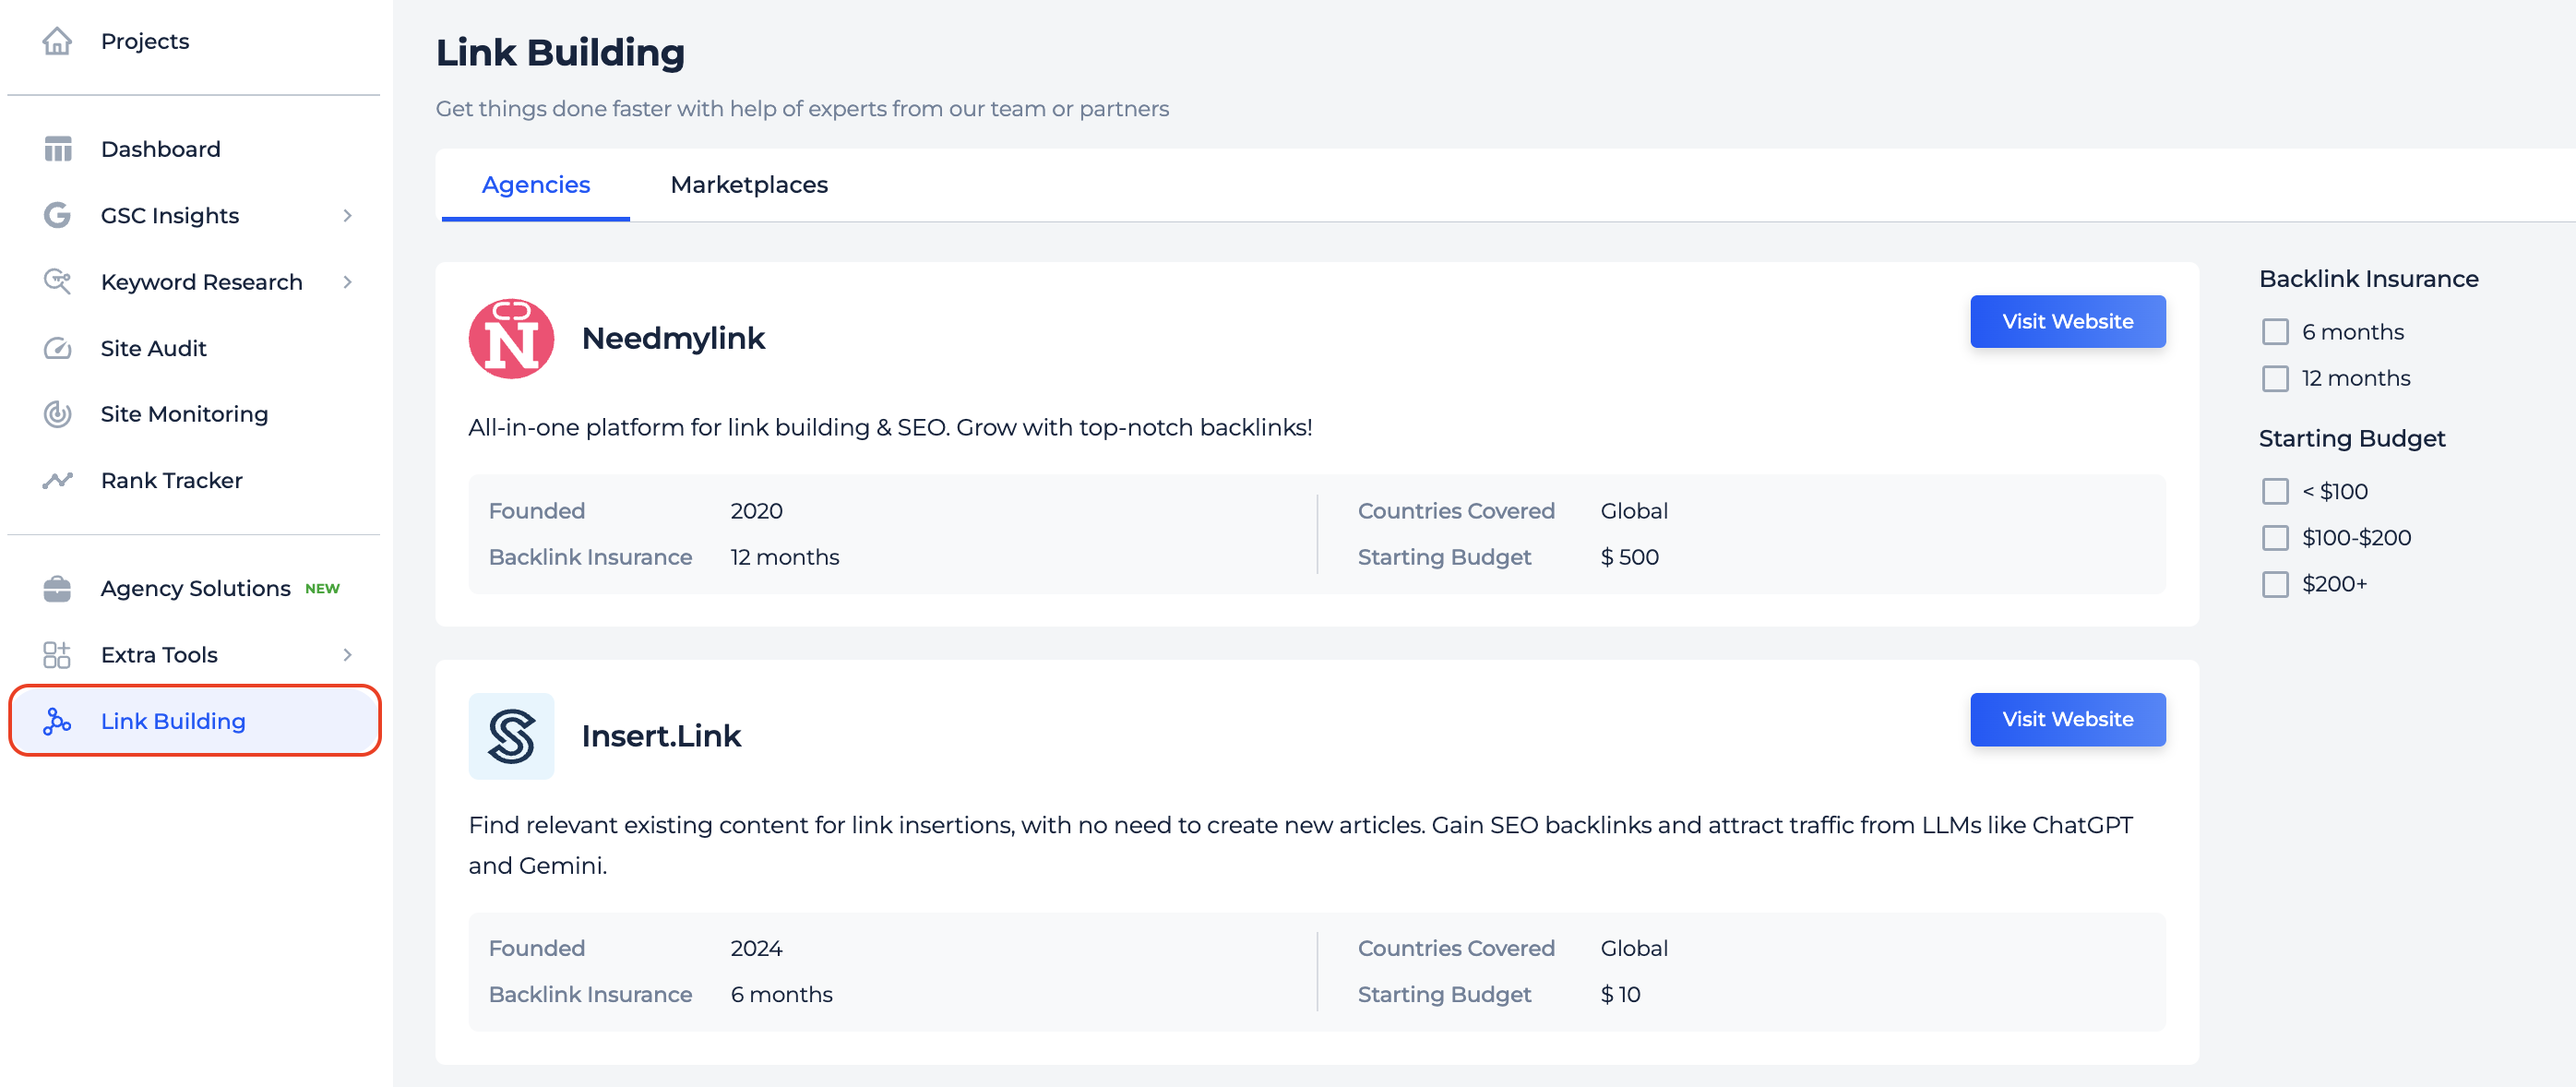
You’ll find the new Link Building page directly in the app’s sidebar, so you can better support your off-page SEO efforts.
")
")
")