

What is a Website Traffic Estimator?
It is an essential tool for any site owner or marketer looking to optimize their online presence. Our website traffic checker is a versatile and powerful data analysis tool designed to help you track, analyze, and optimize your website’s performance.
To get deeper insights into how AI platforms contribute to your site’s visits and visibility beyond traditional web analytics, use the AI Traffic Checker to break down traffic coming from AI interfaces.
Key features of the domain traffic checker:
- All-in-One Dashboard: Access comprehensive data from Google Analytics, Google Search Console, and SERP in one convenient place, saving time and effort.
- Easy-to-Use Interface: With user-friendly dashboards, our web traffic lookup makes it easier than ever to navigate between your website’s metrics smoothly and uncover opportunities for growth.
- Competitor Analysis: Stay ahead of the competition by analyzing organic traffic data, SERP visibility, and top traffic-generating keywords of your competitors. Leverage these insights to optimize your site and outrank your rivals.
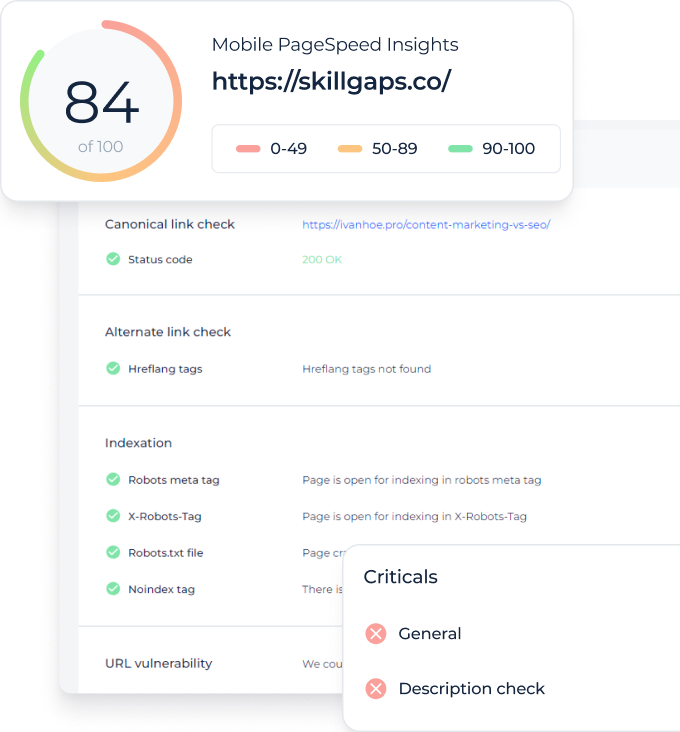
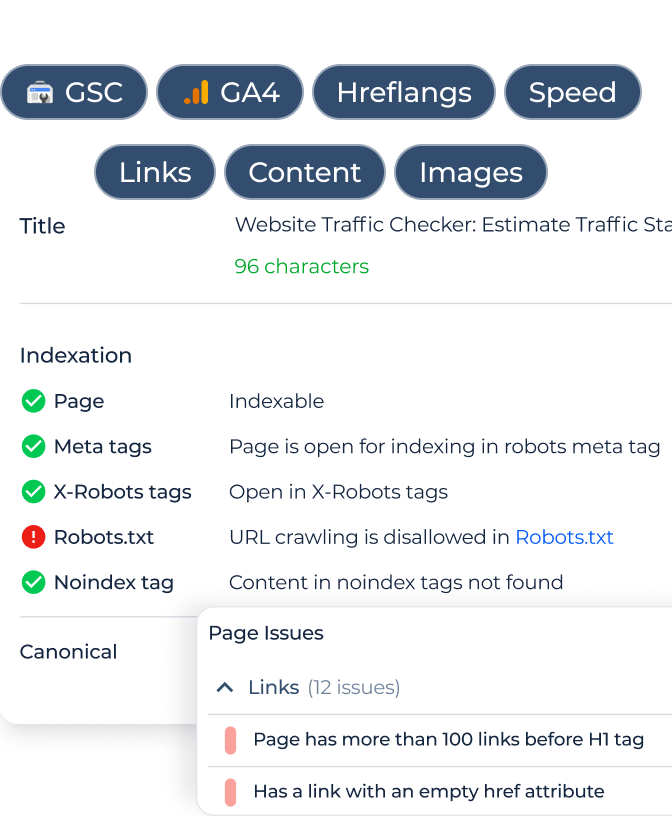
- Global SEO platform features: Our global SEO platform offers much more than just traffic data analysis. Sitechecker includes a variety of functionalities such as SEO audits (on-page & off-page), rank tracking, site monitoring, and more. With Such useful data analysis, you can easily eliminate threats and foresee opportunities.
Importance of Web Traffic Analysis and Monitoring
Analyzing your website’s traffic data is crucial to promoting online presence and increasing organic search visitors and sales. Regardless of the size of your site or the number of users, regular user session audits are essential.
Our tool provides valuable information about your website visitors, including their sources (organic, direct, paid, social, referral, email etc.) and behavior, and also offers insights to optimize your site by identifying areas that need improvement. A deeper layer of analysis comes from separating branded traffic from non-branded traffic, helping you understand whether growth is driven by existing brand demand or by new users discovering your site. The more detailed data you process, the better and more accurate results you will get.
If you’re not monitoring your site’s performance and ranking, then you’re missing out on potential visitors and new users constantly. Every day, there are new engagement metrics to measure a site’s success, but the basics of website traffic checks remain vital.
We’ve created a video guide to help you delve deeper into traffic estimation and fully utilize all the features that our traffic finder provides.
How to Use the Tool?
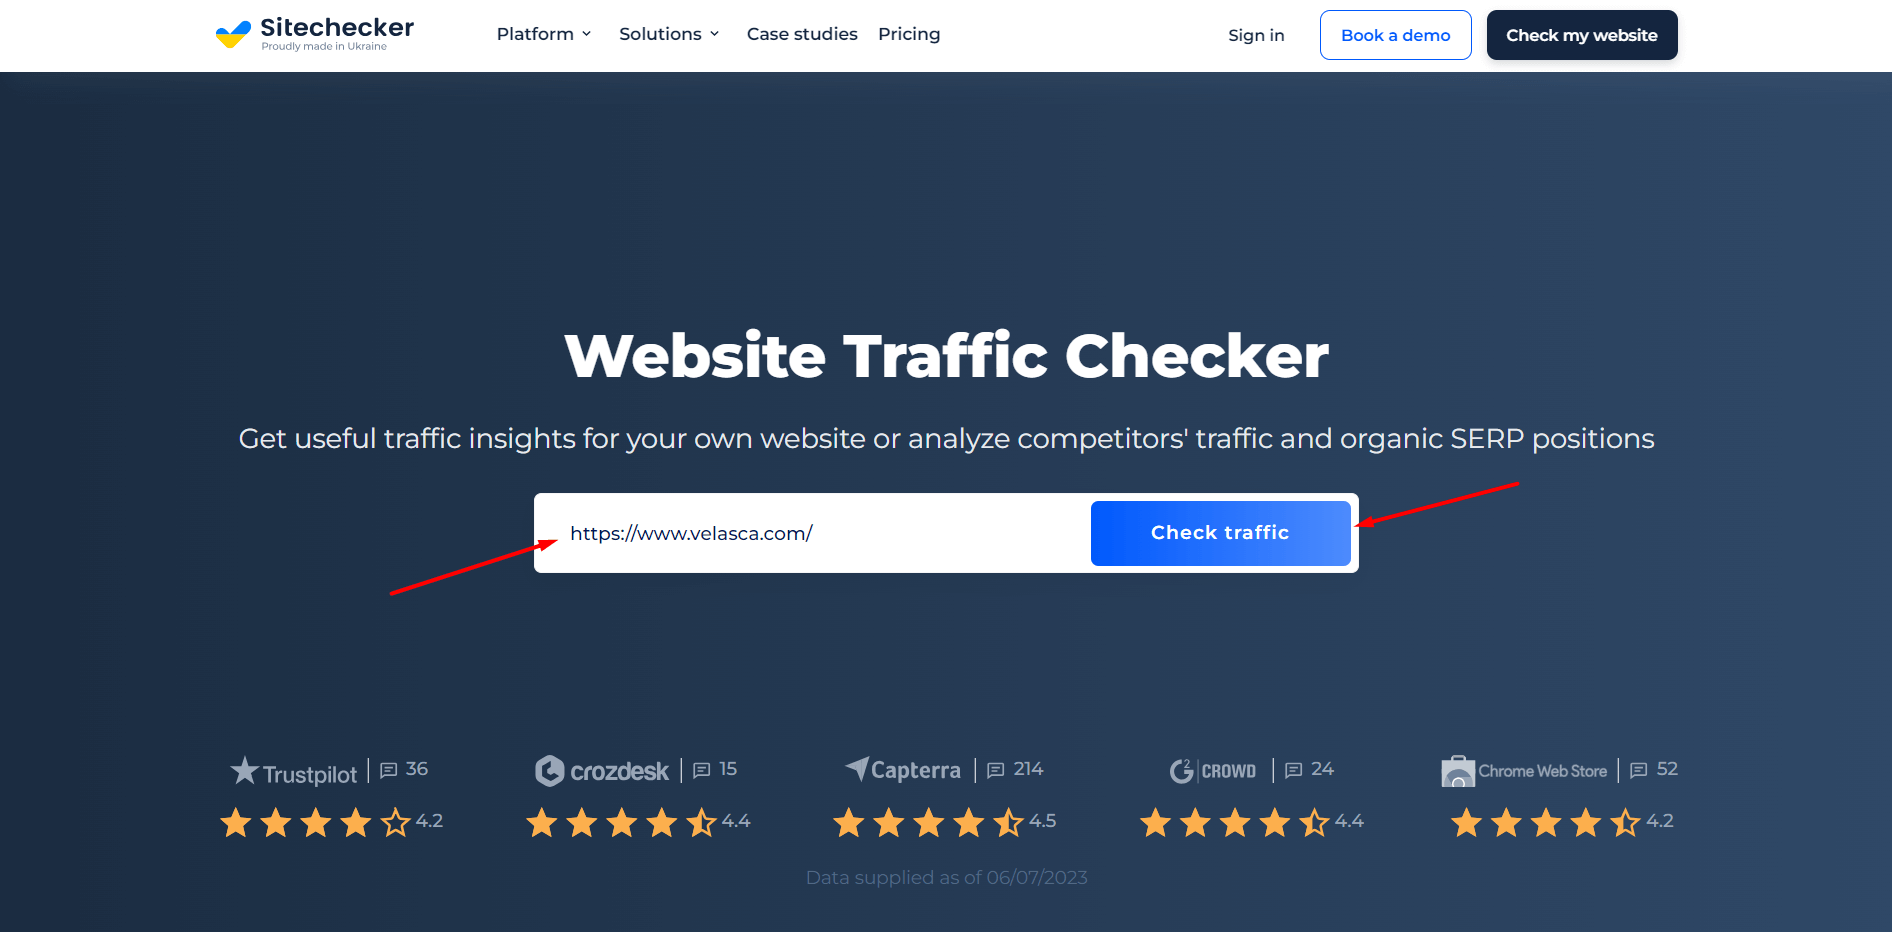
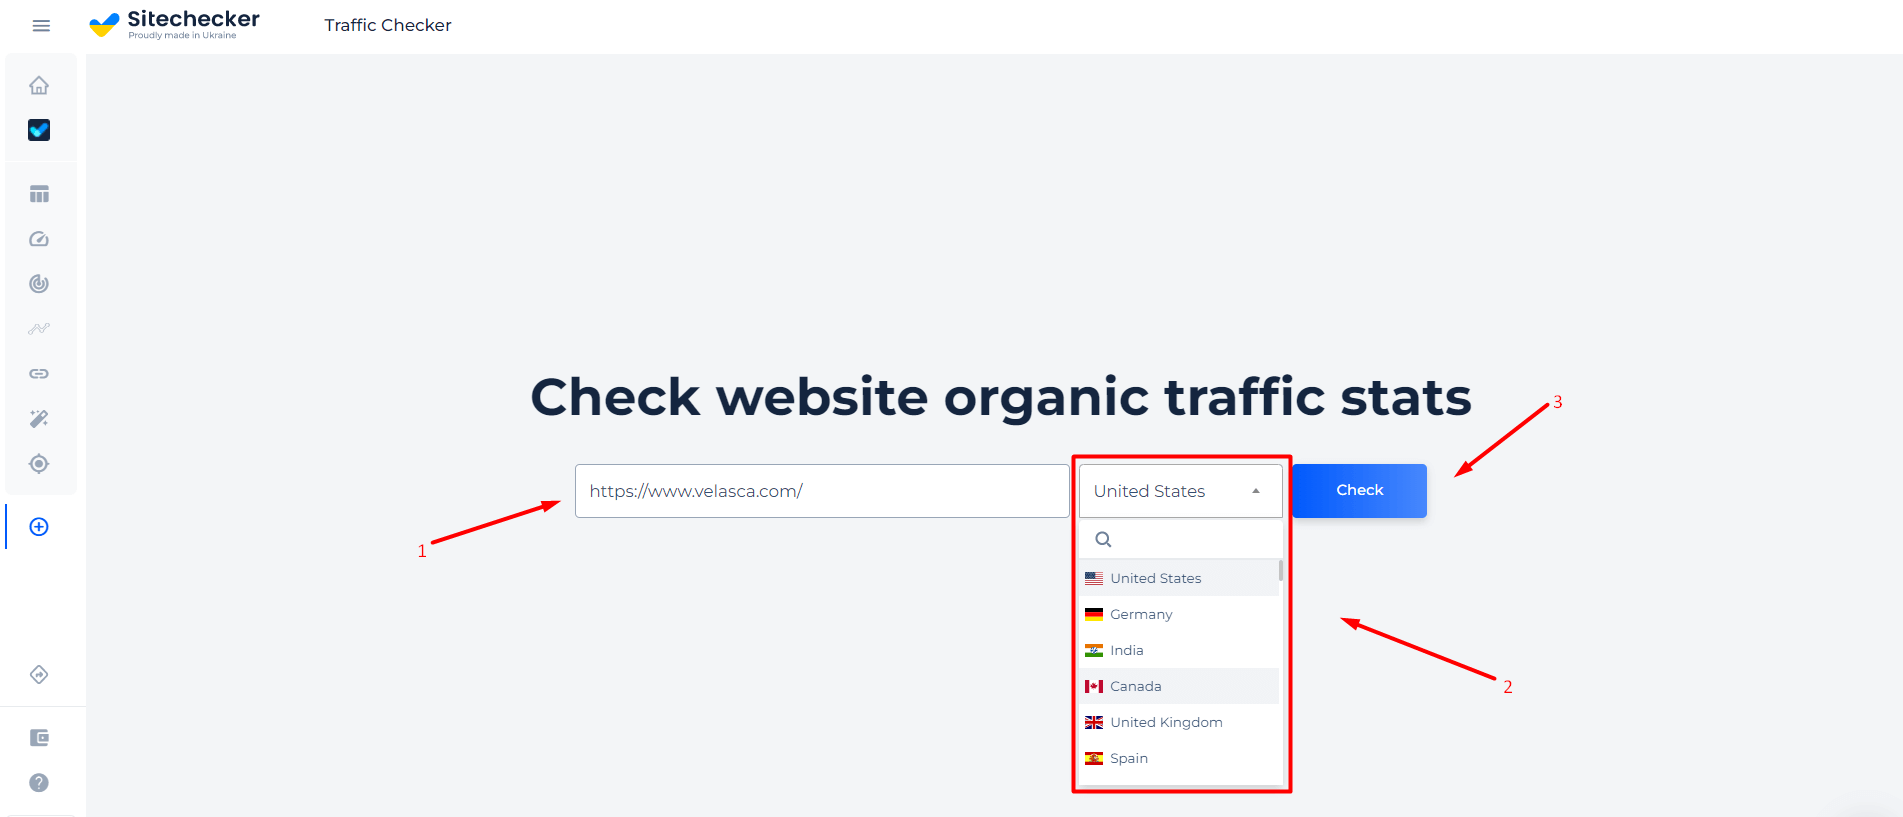
Step 1: Input the domain for which you want to check traffic, then click the “Check traffic” button
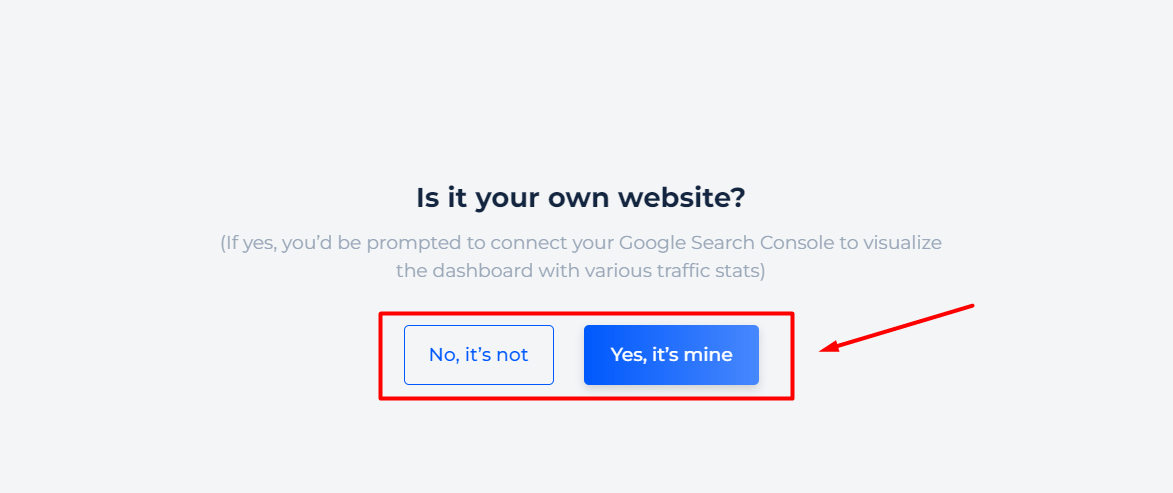
Step 2: Specify the site for which you would like to access traffic data
Our powerful tool provides you with easy access to traffic data for both your own website and your competitors. We have also included a range of valuable features to help you gain more profound insights into both scenarios. Using those features provides you with a better understanding of your online performance and a competitive edge in your industry. By answering whether it is your website or not, you help us prepare the right dashboard for your needs.
Step 3: Access your results and take advantage of our powerful features
For your own site
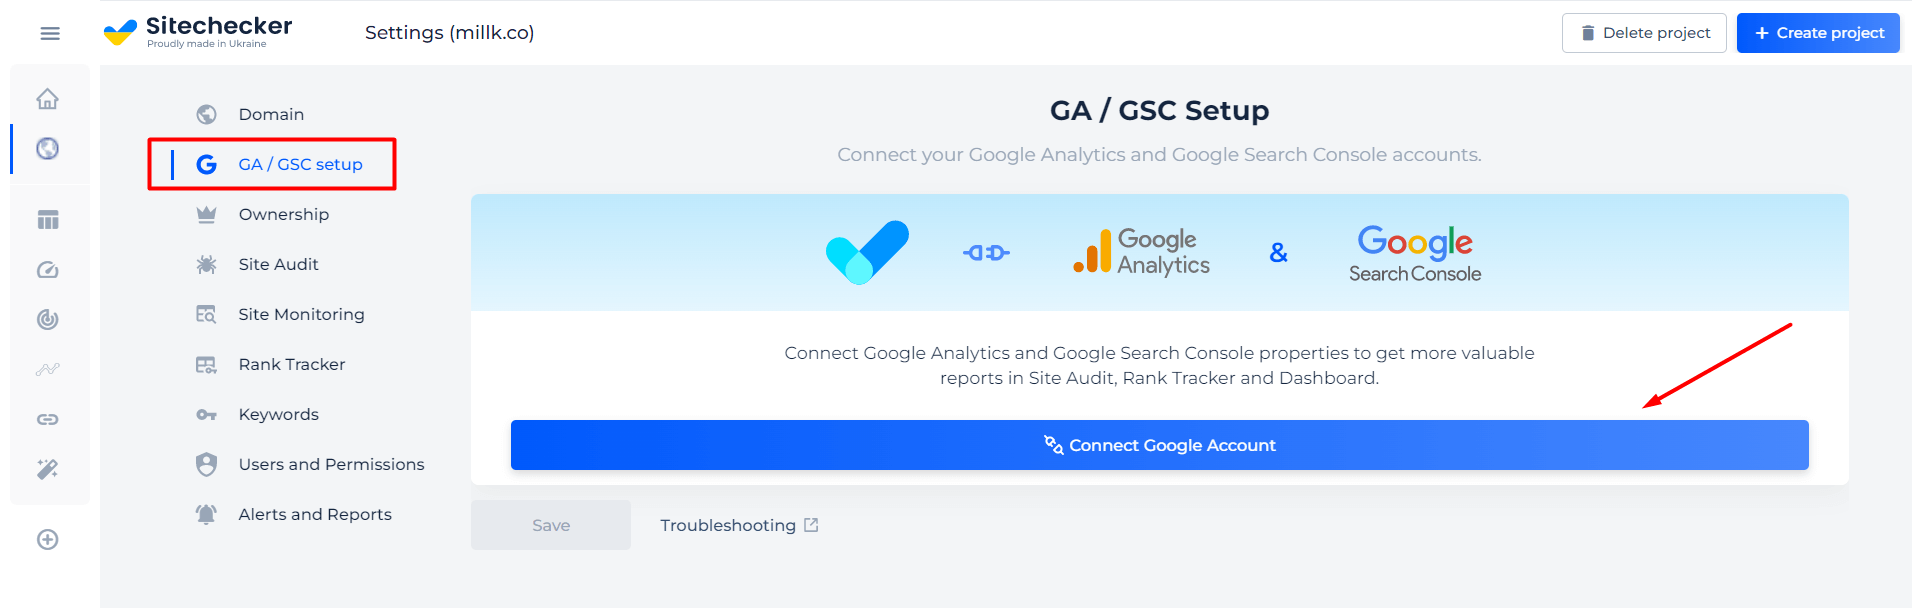
To access data for your own site, simply select ‘Yes, it is mine’ and connect your GA and GSC accounts. This fantastic feature can really come in handy for site admins, SEOs, and marketers. It allows you to monitor the website traffic from the two best analytics platforms, all in one place. We have also created custom dashboards with valuable insights.
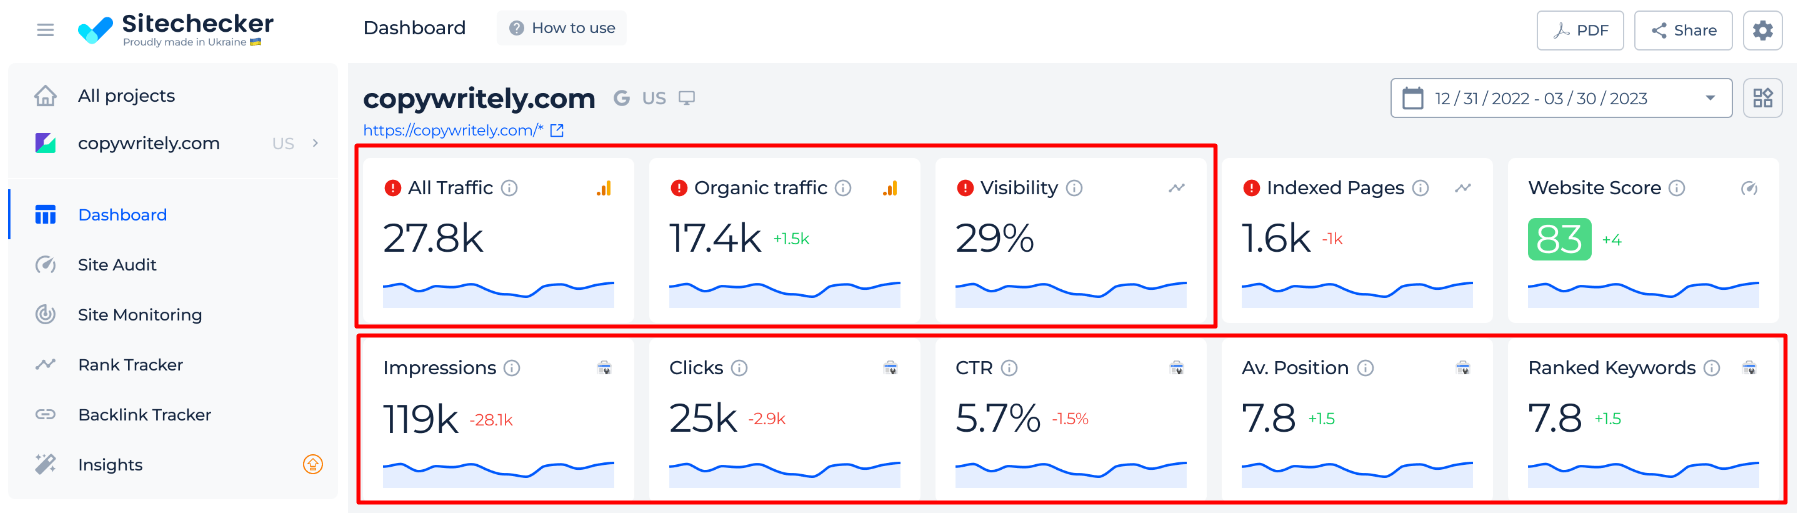
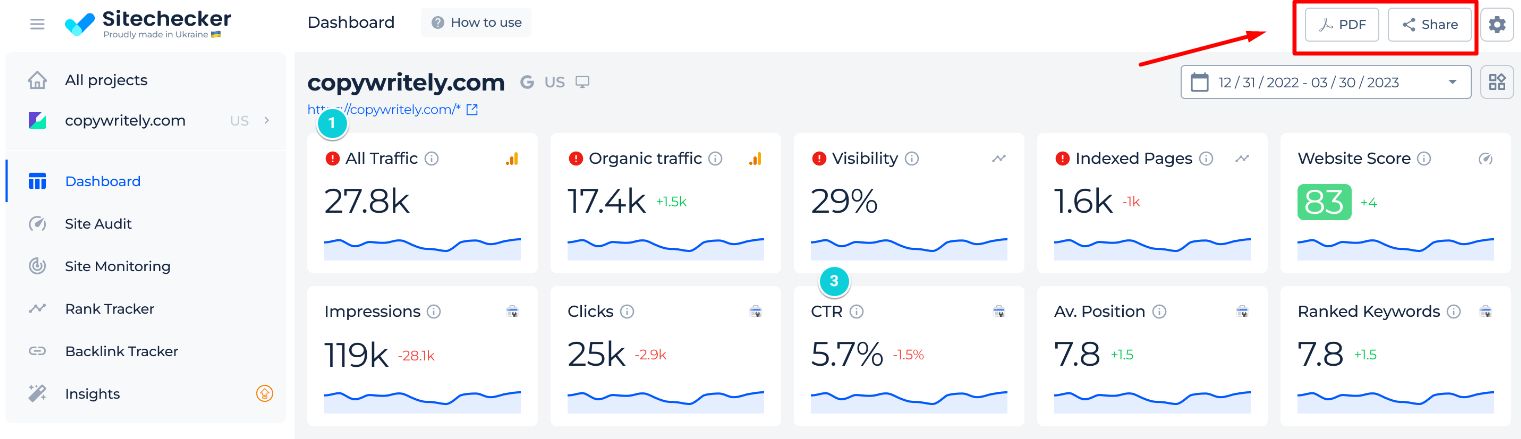
Take a look at our general traffic dashboards that provide insights on all visitors and organic traffic from Google Analytics. The data represented in visibility is based on your top ranking keywords, while others, like impressions, clicks, click-through rates (CTR), positions, and ranking keywords are based on Google Search Console’s top metrics.
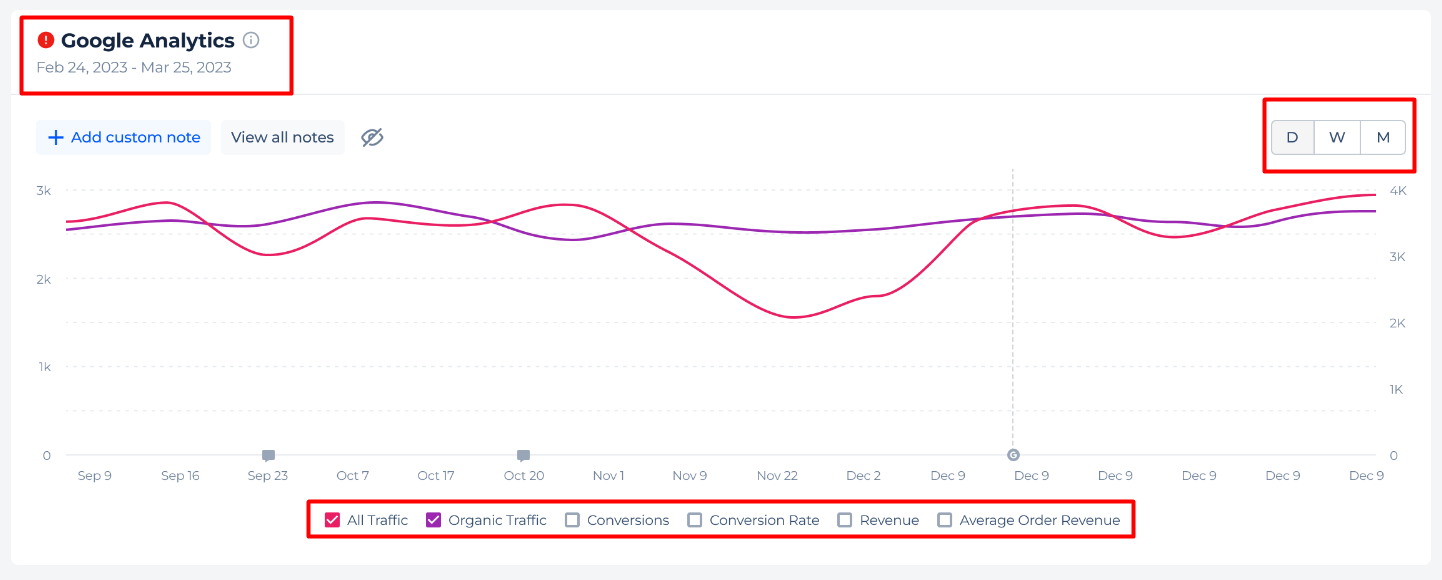
To track your website’s dynamics smoothly, our dashboards also have many other in-depth insights with a user-friendly interface. For example, if you have e-commerce data in Google Analytics, you can access sales data and correlations with traffic. This gives you a complete picture of your website’s revenue performance. Moreover, it’s easy to check data for a specific time range, whether daily, weekly, or monthly.
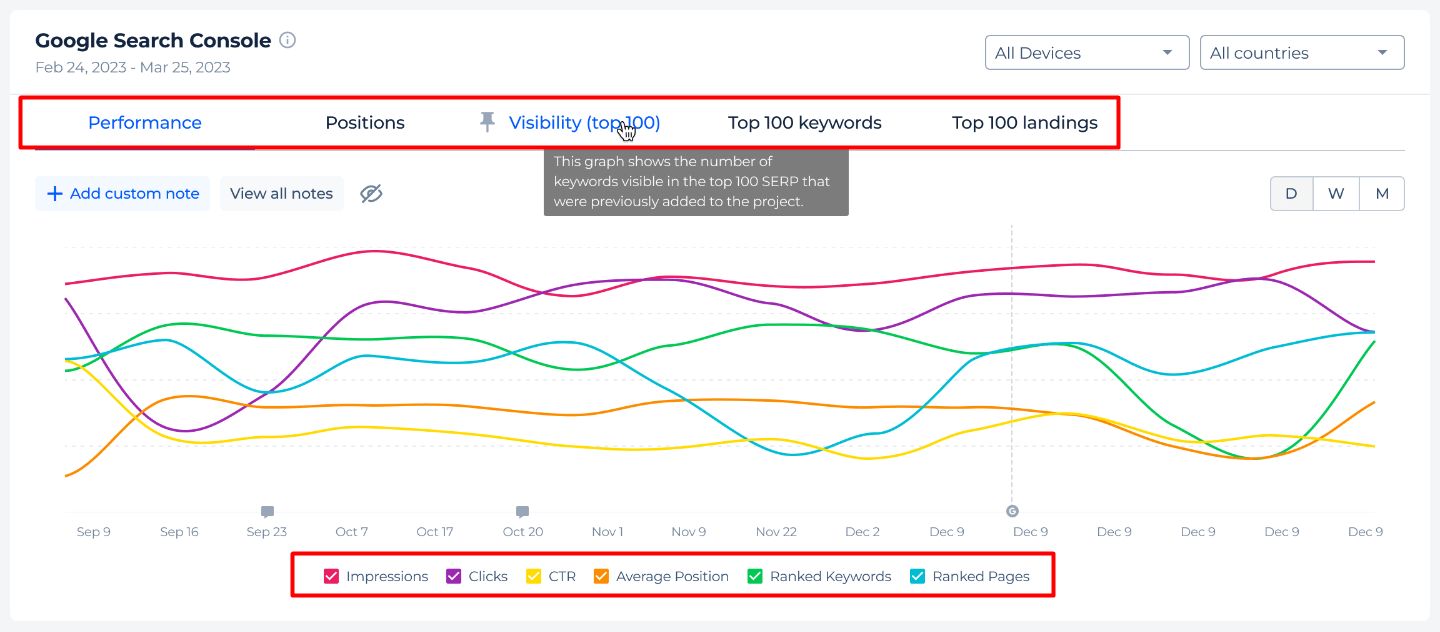
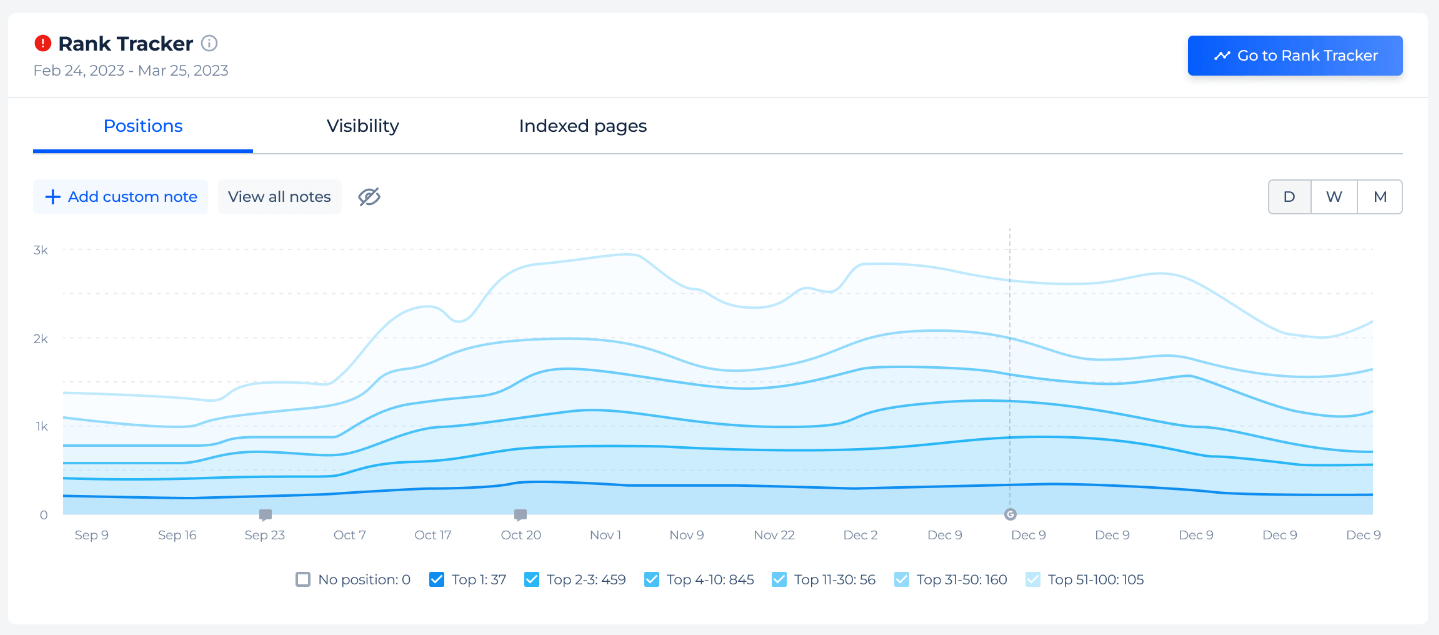
If you’re interested in GSC insights, check out the board that includes performance, positions, visibility, top 100 keywords, and top 100 landing pages.
A similar board is for the keywords from the rank tracker.
If you own multiple websites, work for an SEO agency, or manage a large entrepreneurial website, our tool has a specific feature you’ll appreciate. The project dashboard allows you to track traffic and other performance metrics for a bulk of sites that you or your clients own. Alternatively, you can separate a large project into specific parts or languages, for example, and track them individually.
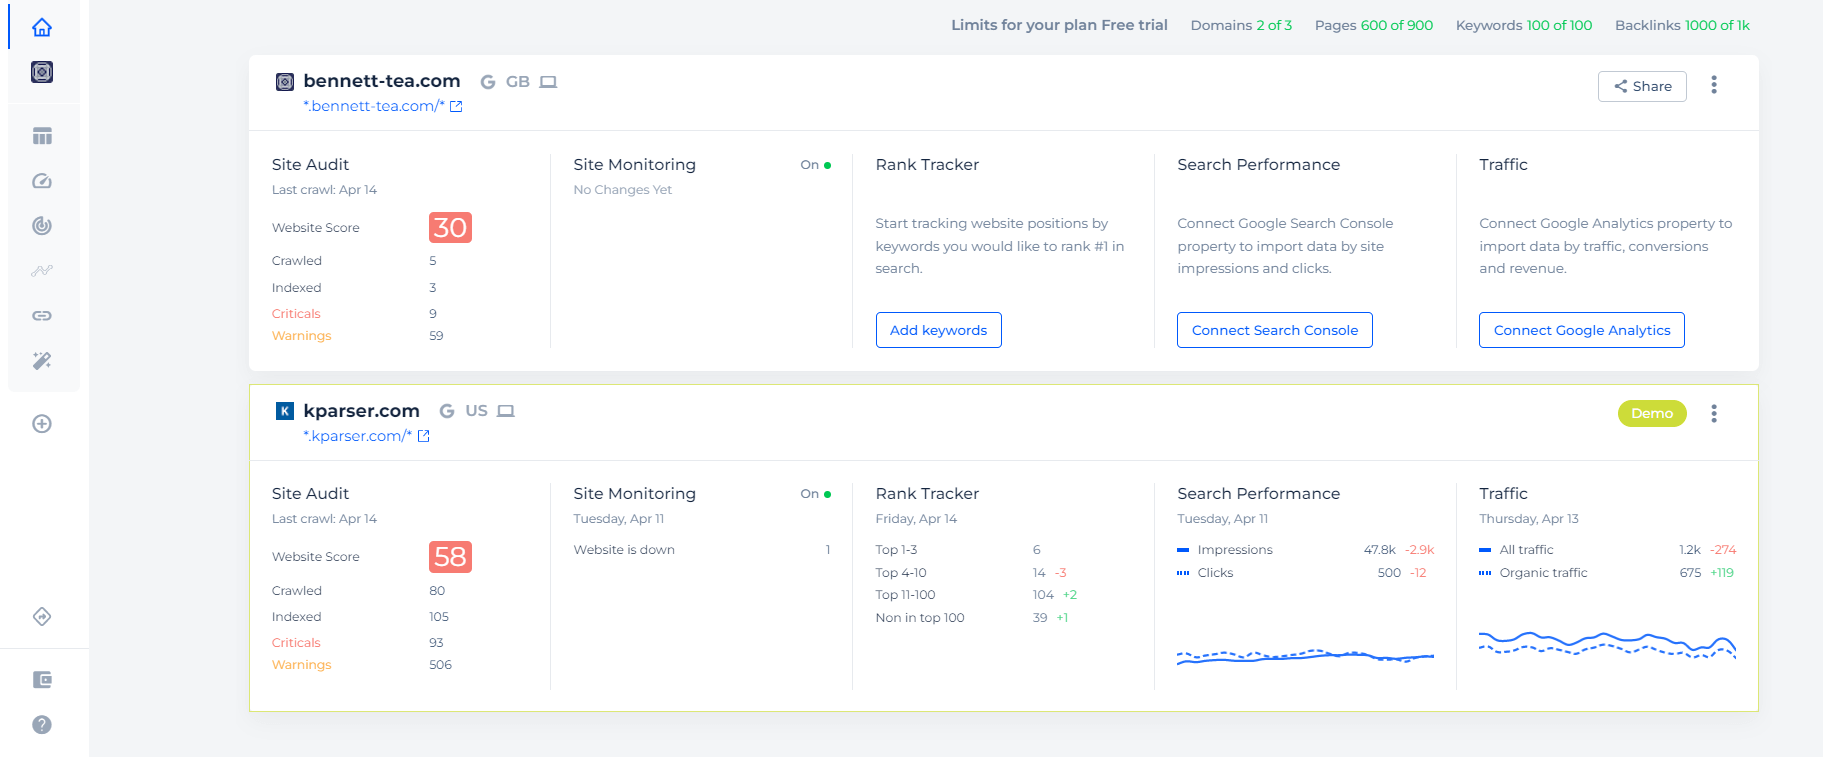
If you need to make reports for your clients, we’ve got you covered. We’ve already created them for you, so all you need to do is download or share them.
For competitor websites’ analyze
Firstly, we recommend selecting a specific region to ensure that the data is clear, up-to-date, and provides insight into the local market situation for analysis.
Let’s take a closer look at the main elements of a website traffic estimator and consider how they help you evaluate your competitors.
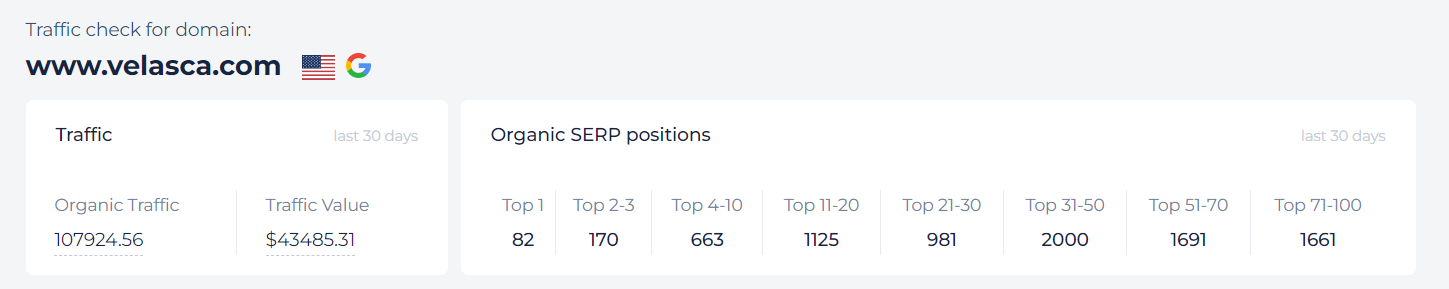
Organic traffic: It is generated from the click-through rate (CTR) and search volume associated with each keyword for which the domain ranks.
Traffic Value: Represents the expense associated with driving the estimated monthly organic traffic volume through pay-per-click (PPC) advertising on Google Search. This provides an understanding of the potential financial value of the traffic.
Organic Search Engine Results Page (SERP) positions: This metric displays the number of keywords for which a competitor ranks within various SERP positions: top 1, 2-3, 4-10, 11-20, 21-30, 31-50, 51-70, and 71-100. It offers insight into the overall visibility of the competitor in search results.
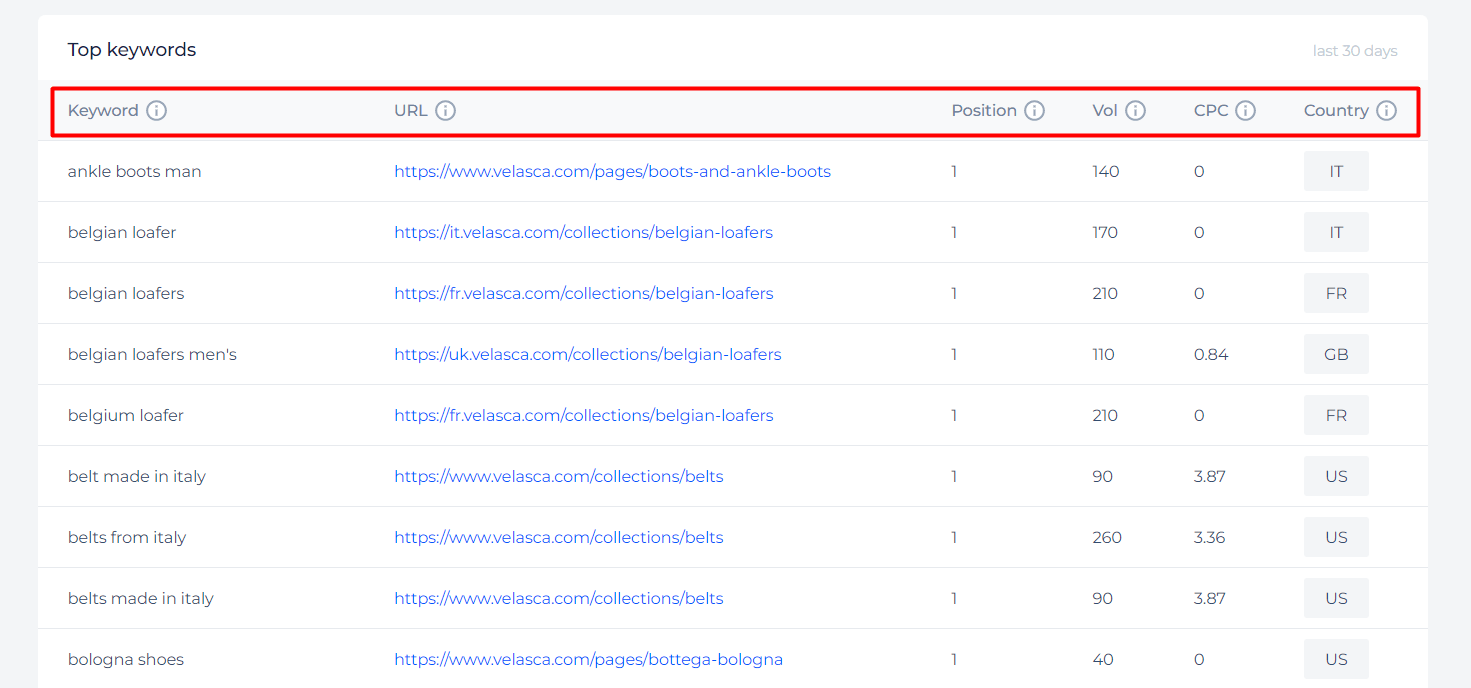
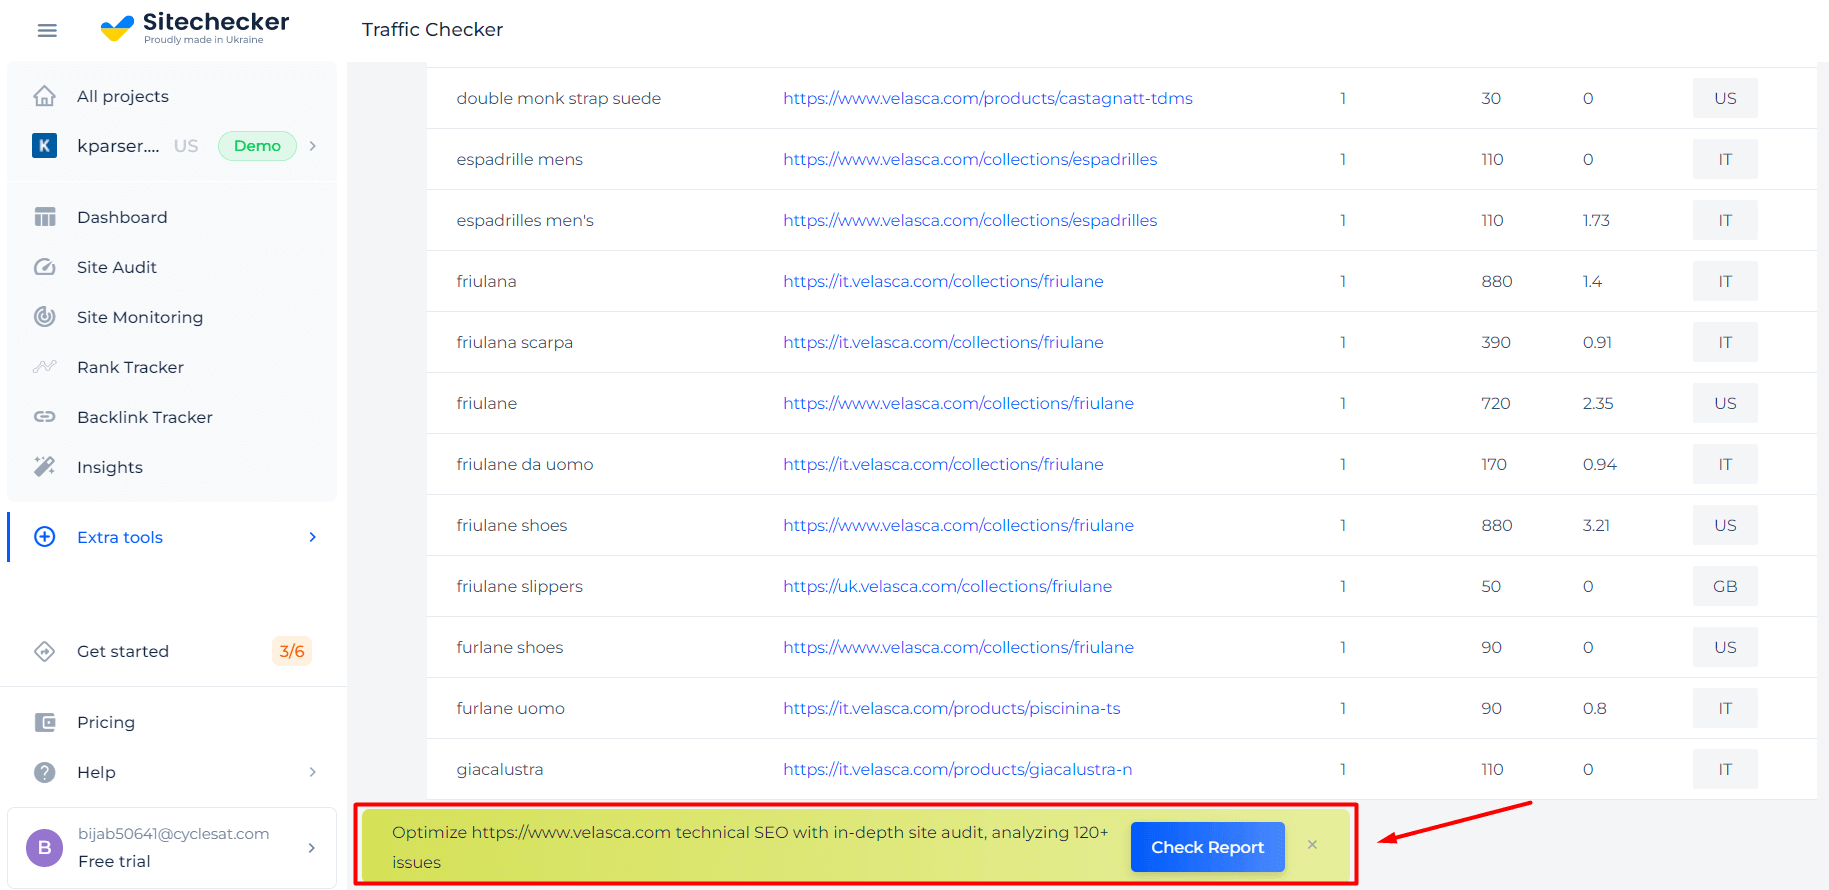
Furthermore, our competitor’s traffic estimation includes an additional feature, Top Keywords. This feature allows you to examine the top 30+ keywords for which the site ranks. Each keyword is accompanied by its relevant URL in the SERP, position in the search results, average monthly search volume, cost per click (CPC) from Google Ads, and the top geographical locations where the website ranks for the keyword.
If you are interested in not only calculating competitor site visitors but also assessing their technical SEO performance, you can take advantage of our SEO audit feature.
Unlock the Power of Your Website's Performance with Our Traffic Checker Tool!
Dive deep into your website's performance and stay ahead of your competitors with our advanced traffic checker tool.
Final Thoughts on Website Visitor Checker
Our tool is a universal solution for various visitor analysis needs. You can use it to aggregate data from GA, GSC, and SERP in one place. With fully automatic set-up dashboards, you can get useful insights and focus on the data that will give you the best results. Additionally, you can use it for market analysis and competitor checks, including organic traffic estimation and price evaluation. Find out which keywords give your rivals the best visibility and traffic results to improve your own performance. It can be a great solution for controlling and analyzing traffic in one place.