

Why you need a GSC-only audit
Google Search Console gives you a clear, no-cost view of how your site is performing in Google Search. It shows what’s indexed, what’s not, where traffic is coming from, and which pages may have technical issues. It’s not as fancy as paid tools, but it’s accurate and straight from the source. GSC is the right place to start if you want to understand the essentials without extra noise.
In the guide below, we’ll walk through how to use it step by step.
Setting up Google Search Console properly
Before you can audit anything, you must ensure your site is correctly connected to GSC. That starts with verifying ownership. The most reliable method is DNS verification, which gives you full access across all subdomains and protocols.
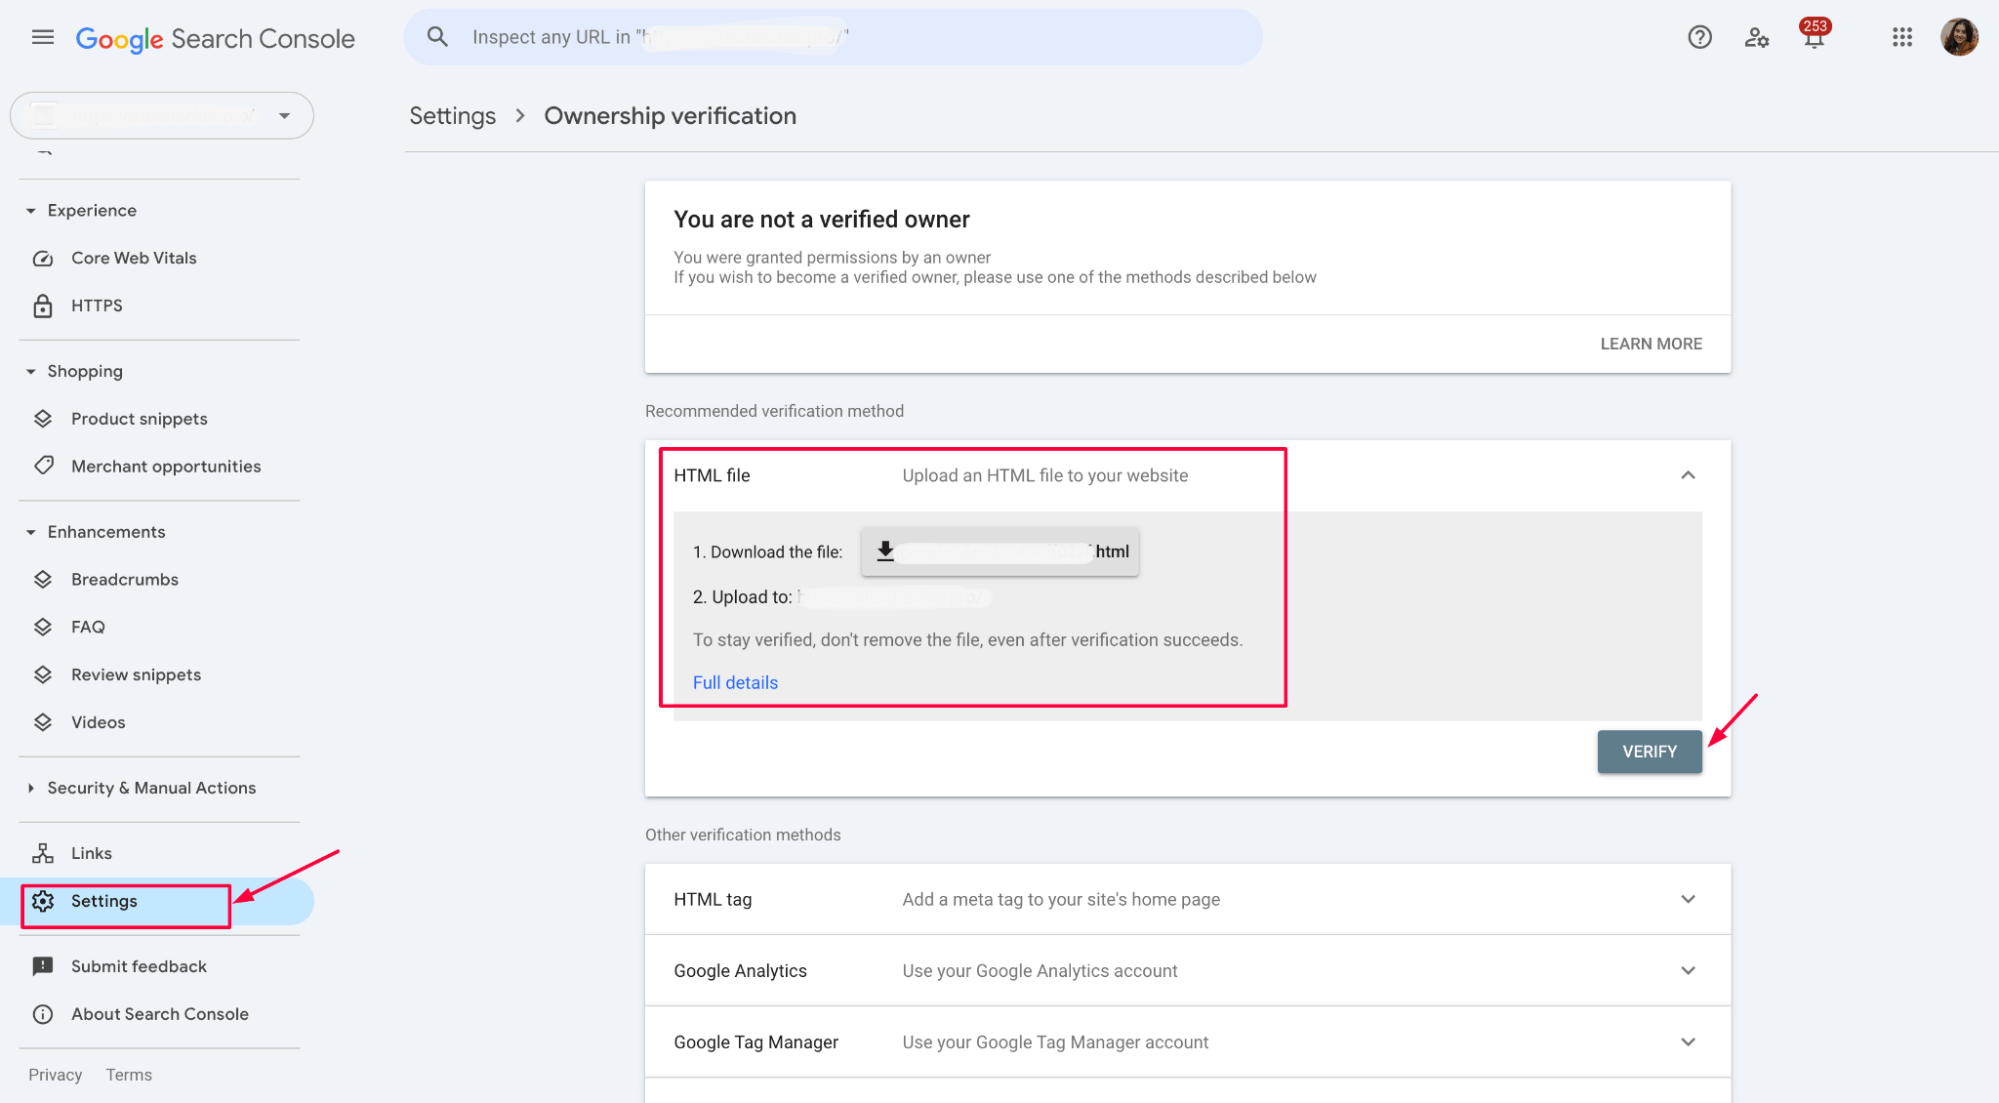
Other options like uploading an HTML file or using a meta tag work too, but they might limit what you see. Once verified, head to the Sitemaps section and submit your main XML sitemap.
This helps Google understand your site structure and ensures new pages are crawled faster. A clean setup means cleaner data, which makes the audit easier from the start.
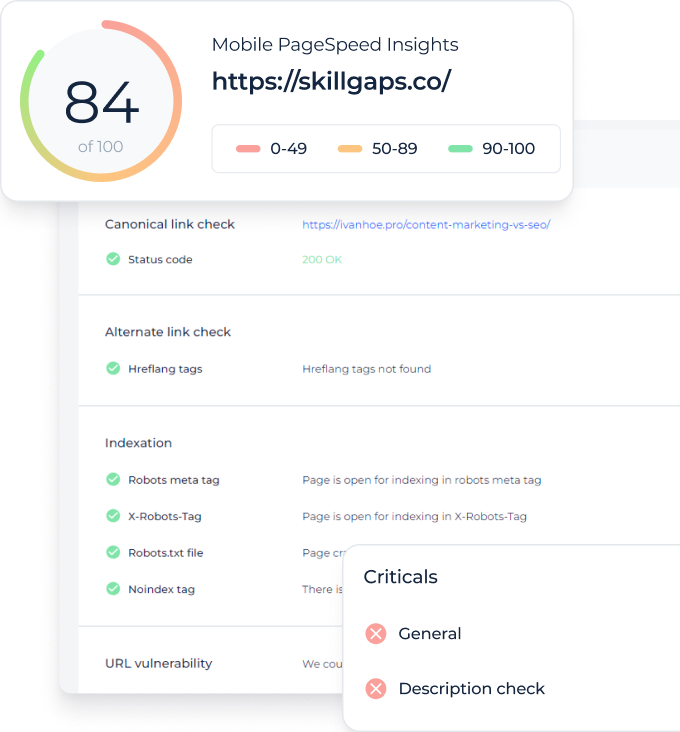
Launch Sitechecker’s GSC Dashboard to boost your Search Console reporting!
Expand GSC Data Limits
Bypass Google’s 1,000-row cap and unlock up to 36 months of Search Console history in a single dashboard.
Submit XML sitemap
Once your site is verified, the next critical step in your audit is submitting your XML sitemap. This file acts as a roadmap, guiding Google to the most important pages on your site.
It helps speed up discovery, ensures comprehensive indexing, and signals to Google which pages you consider essential for search visibility.
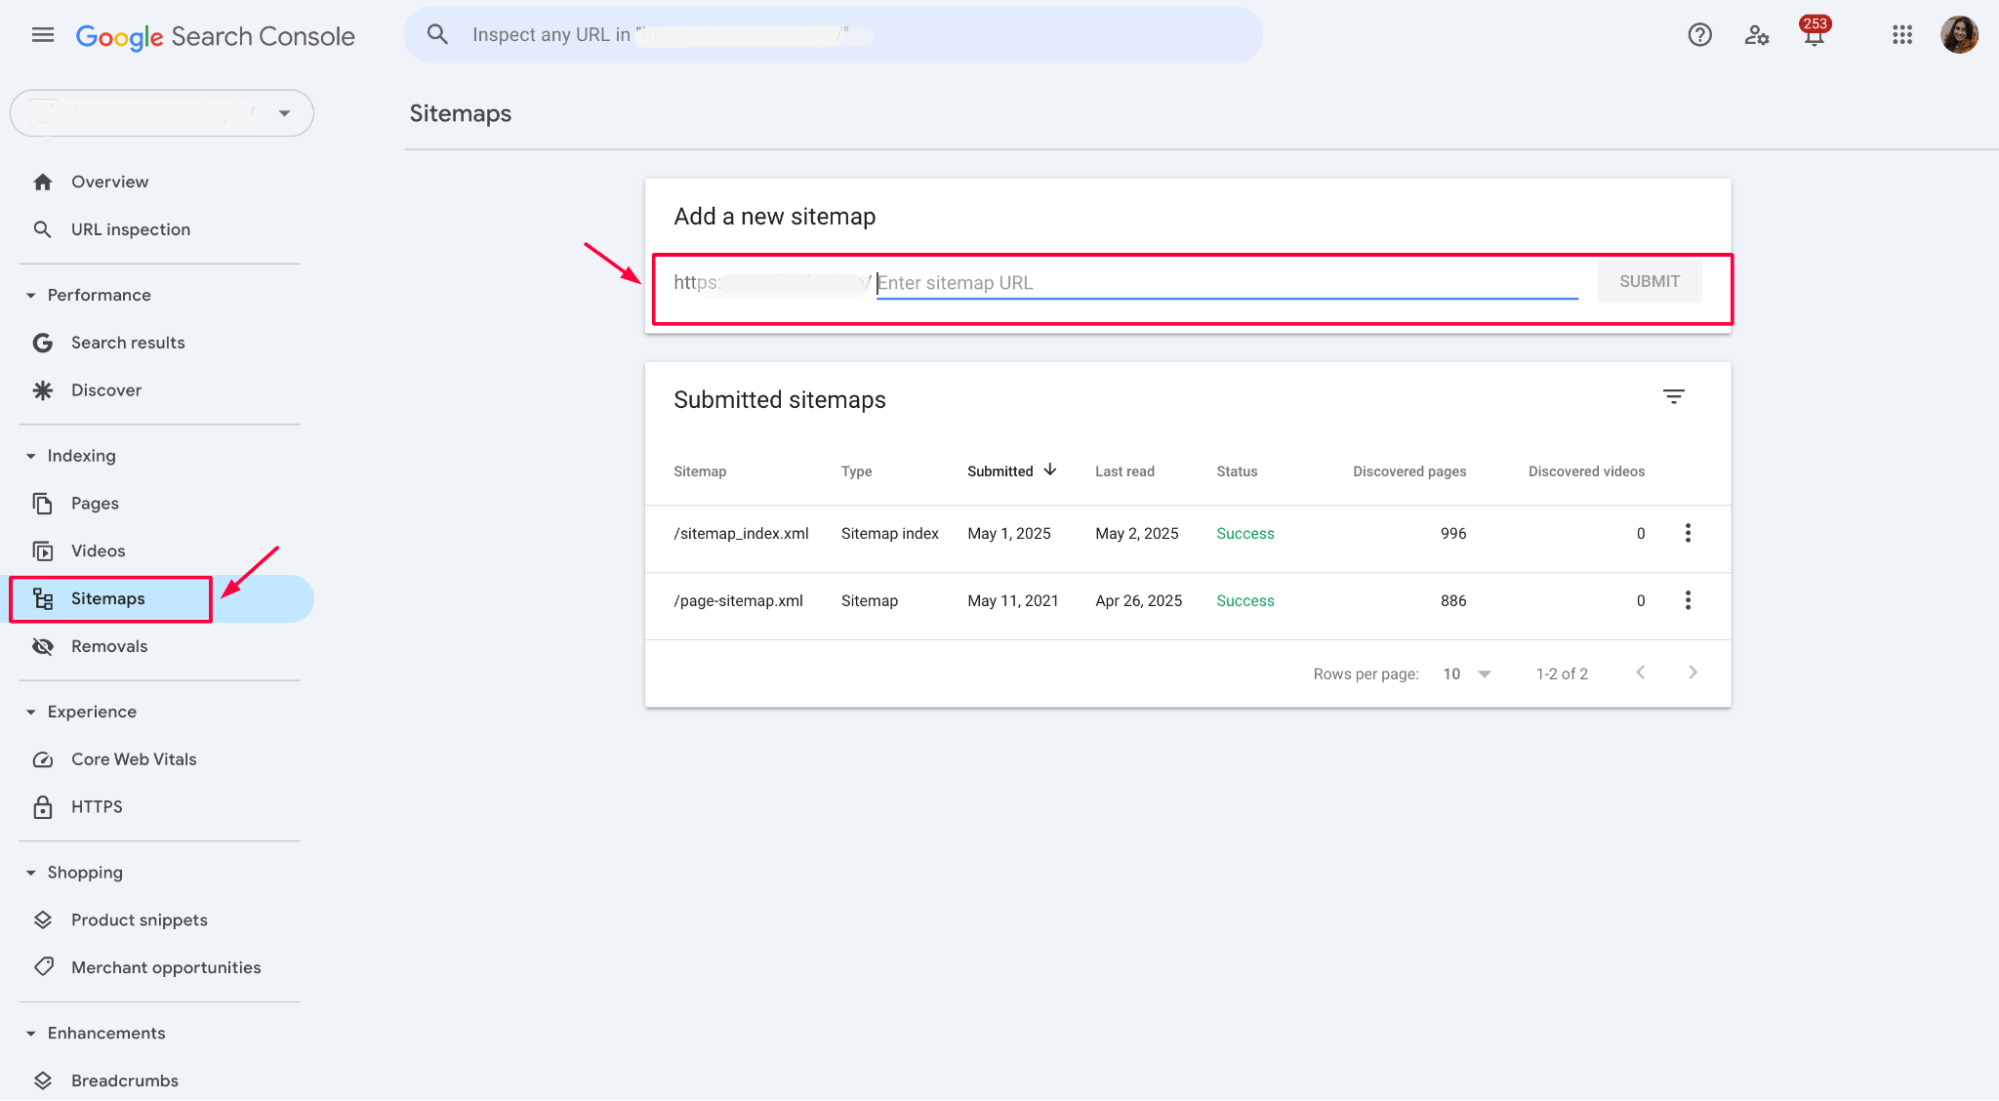
Go to Index > Sitemaps, paste the sitemap URL (usually something like /sitemap.xml), and hit submit.
Sitemap monitoring & management
Once your sitemap is submitted, don’t just forget about it – check in regularly to make sure it’s doing its job. Go to Indexing > Sitemaps in GSC to see the status of your submitted sitemaps:
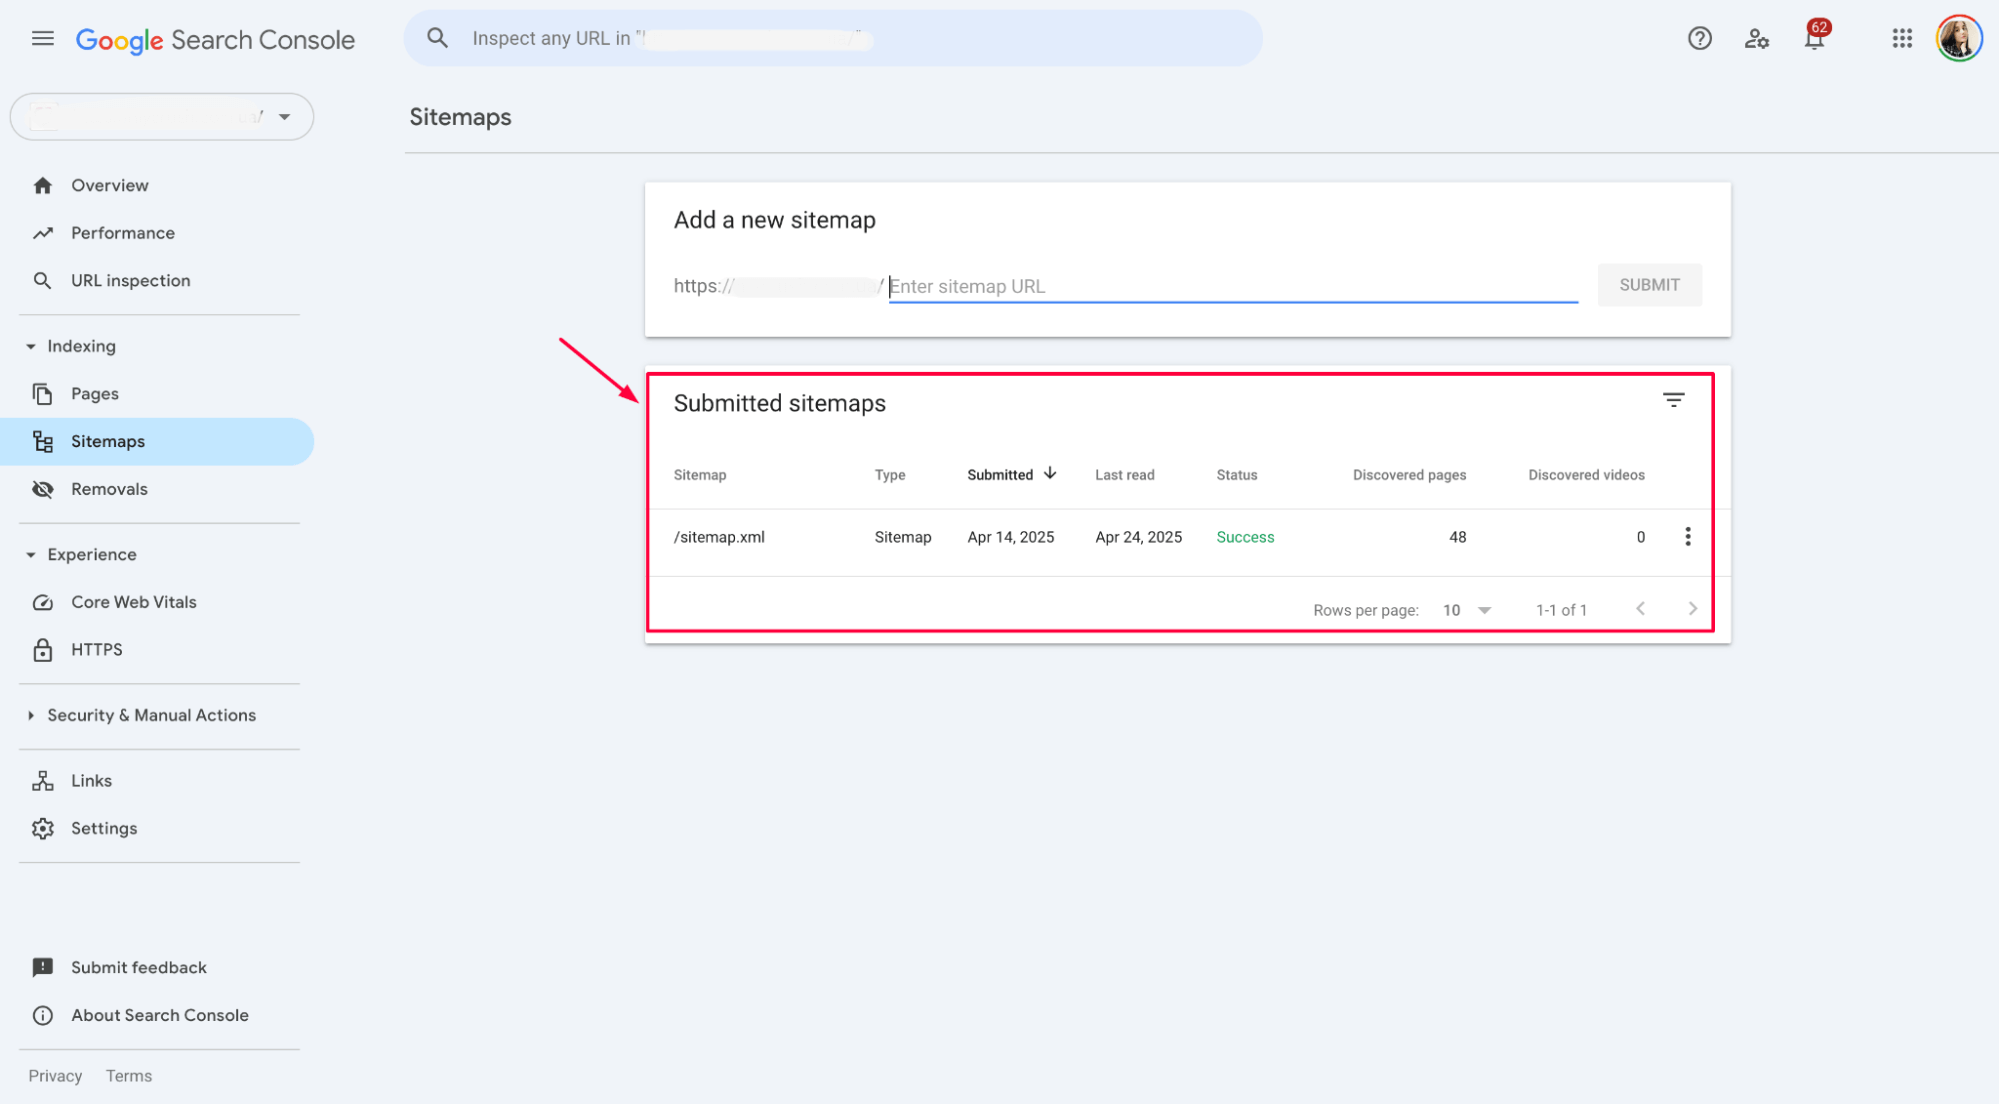
Look for issues like submitted URLs being excluded or errors related to redirects, noindex tags, or blocked pages. If your sitemap contains non-canonical or broken URLs, Google may waste crawl budget on pages that shouldn’t be indexed.
If your CMS or SEO plugin auto-generates sitemaps, double-check that they’re clean and up to date. A well-structured sitemap improves crawl efficiency and keeps your index status in sync with your site.
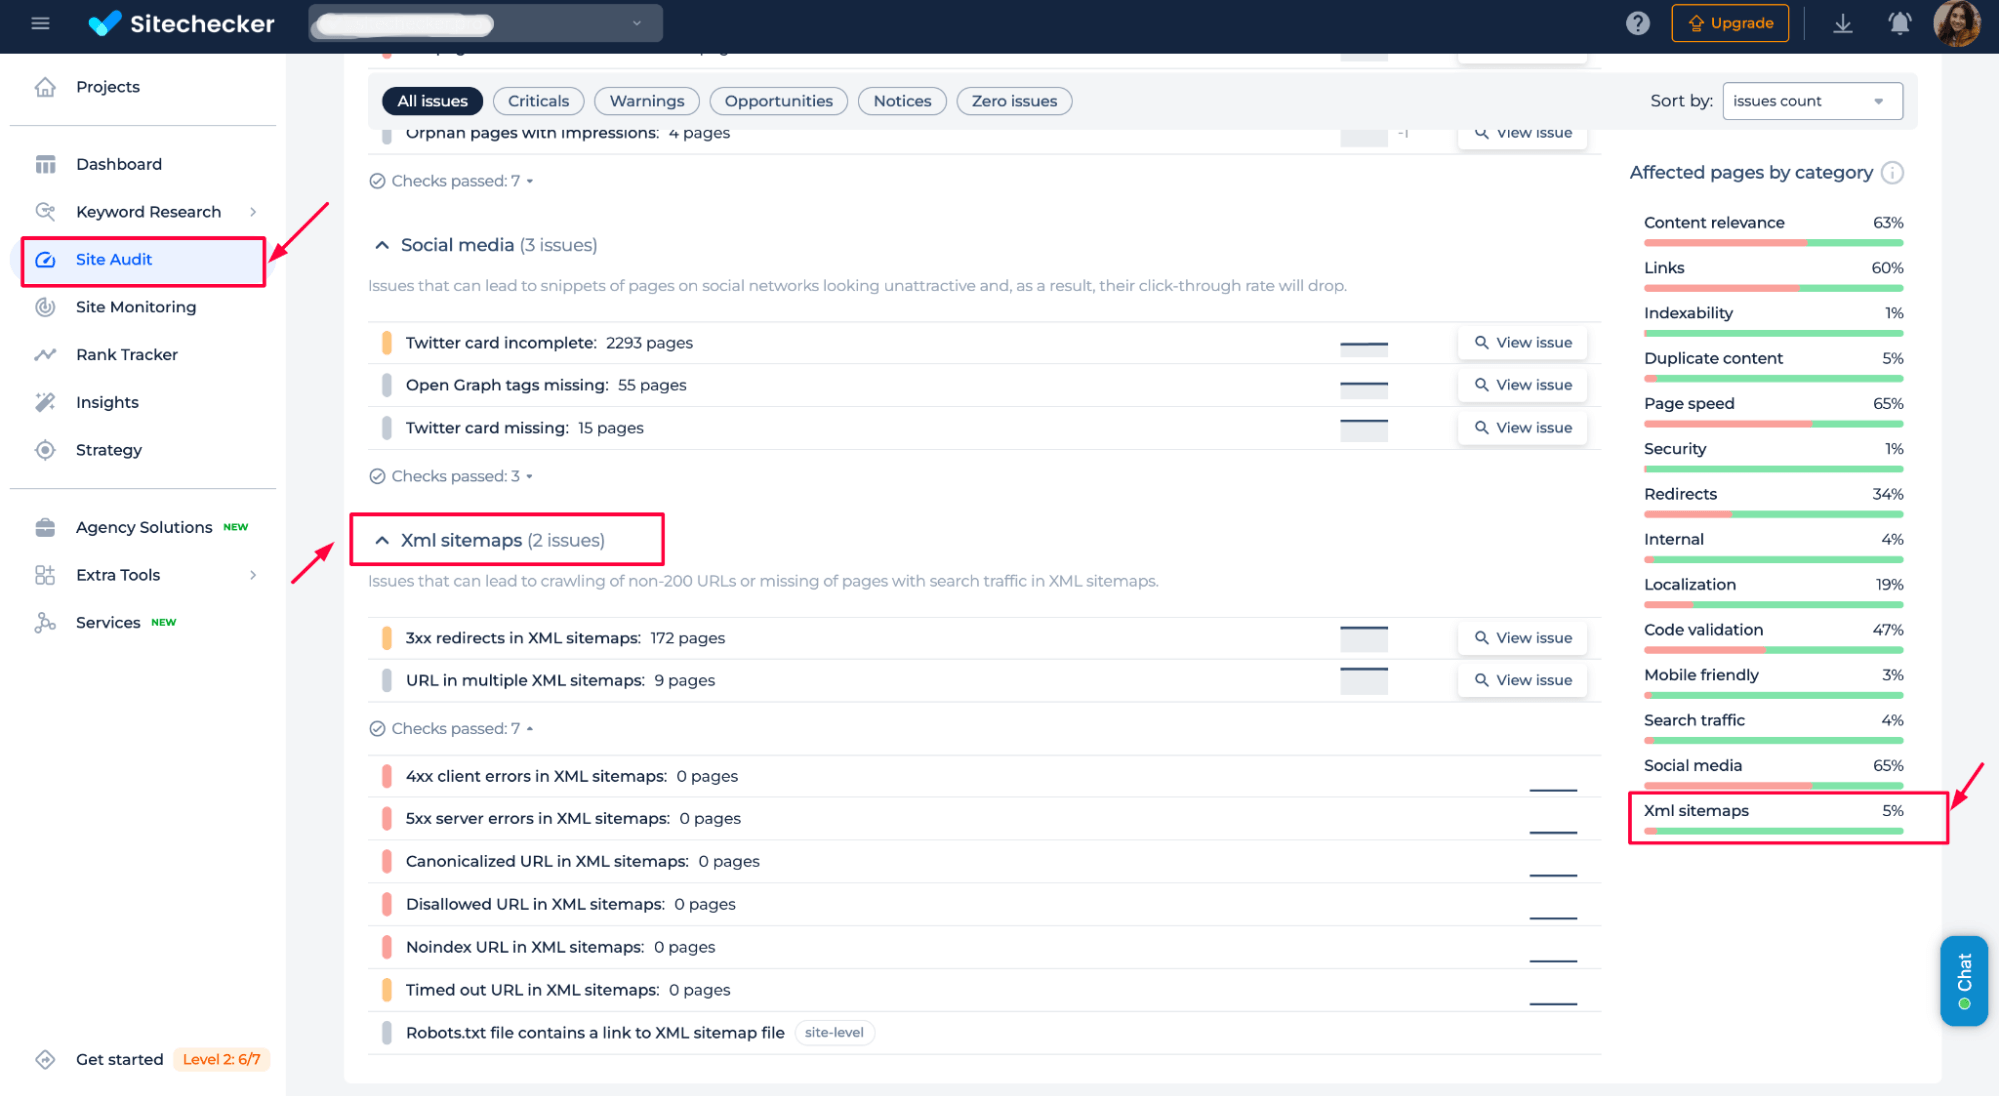
To double-check for sitemap errors like 3xx redirects, duplicate URLs, or non-canonical pages, you can use the XML Sitemap Checker. Their audit report flags sitemap-specific issues, so you know exactly what to fix before Google hits those URLs.
Think of it as a direct line to Google about what content you want indexed.
Performance report
The Performance report is where you see how your site actually performs in Google Search. Go to Performance > Search results to access key metrics: clicks, impressions, average position, and CTR (click-through rate).
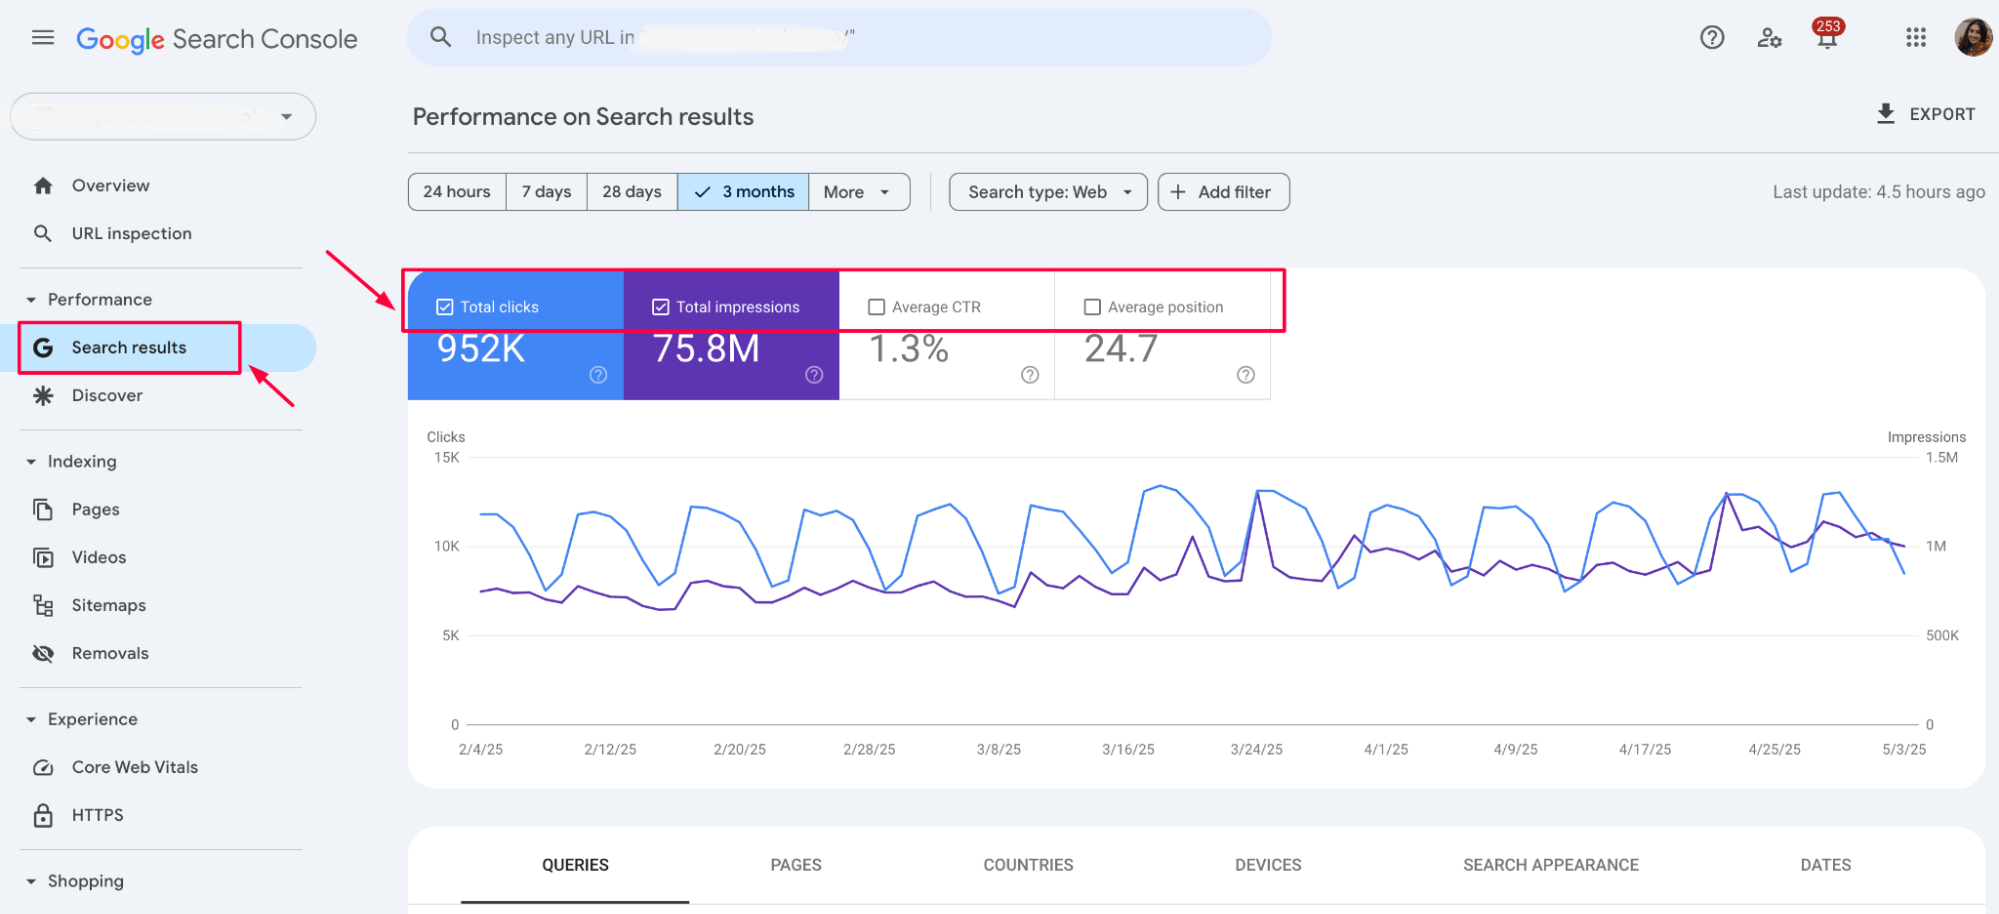
Start by sorting queries by impressions – high impressions with low CTR usually mean your titles or descriptions need work. Then filter by position to find keywords ranking between 11–20.
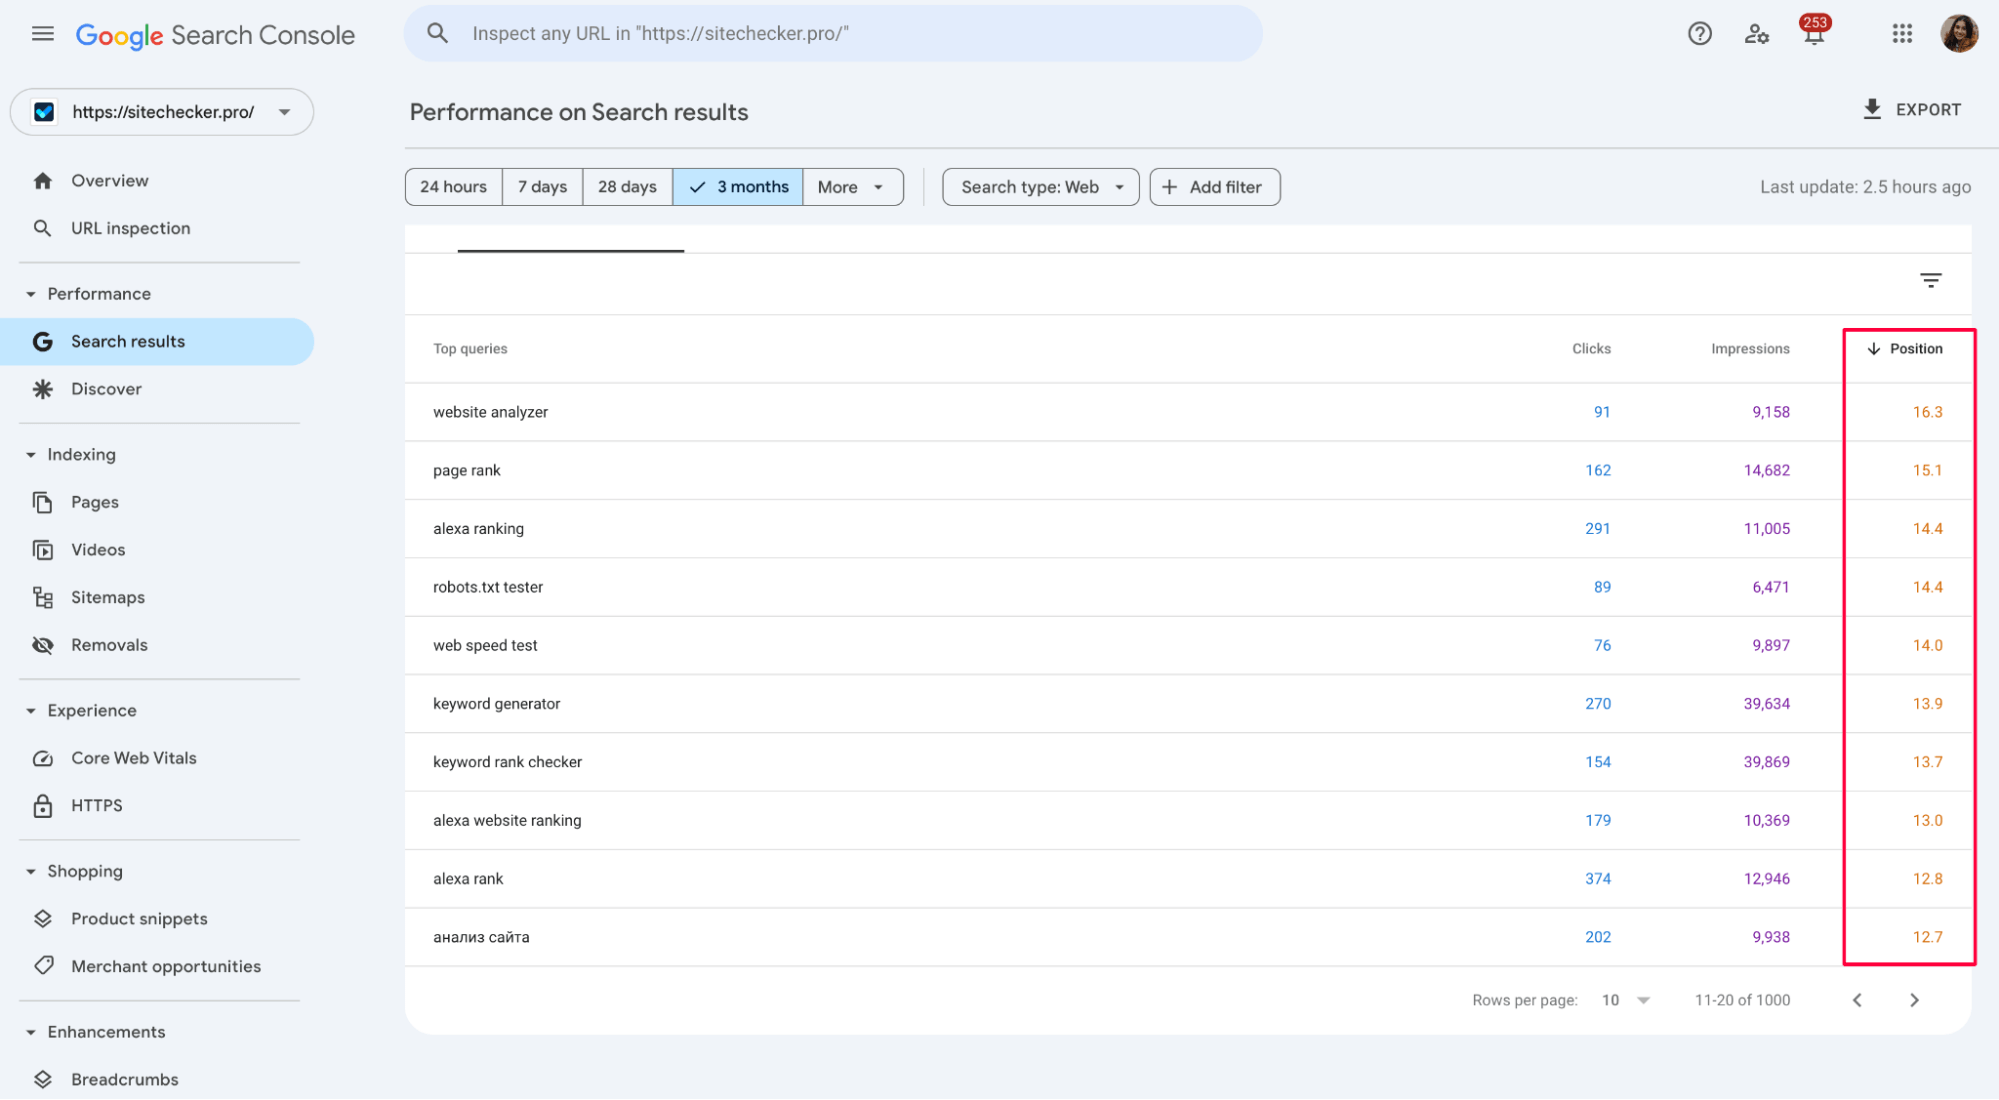
These are low-hanging opportunities: a little optimization could push them to page one. You can also break down data by page, device, country, and search type to spot patterns and gaps.
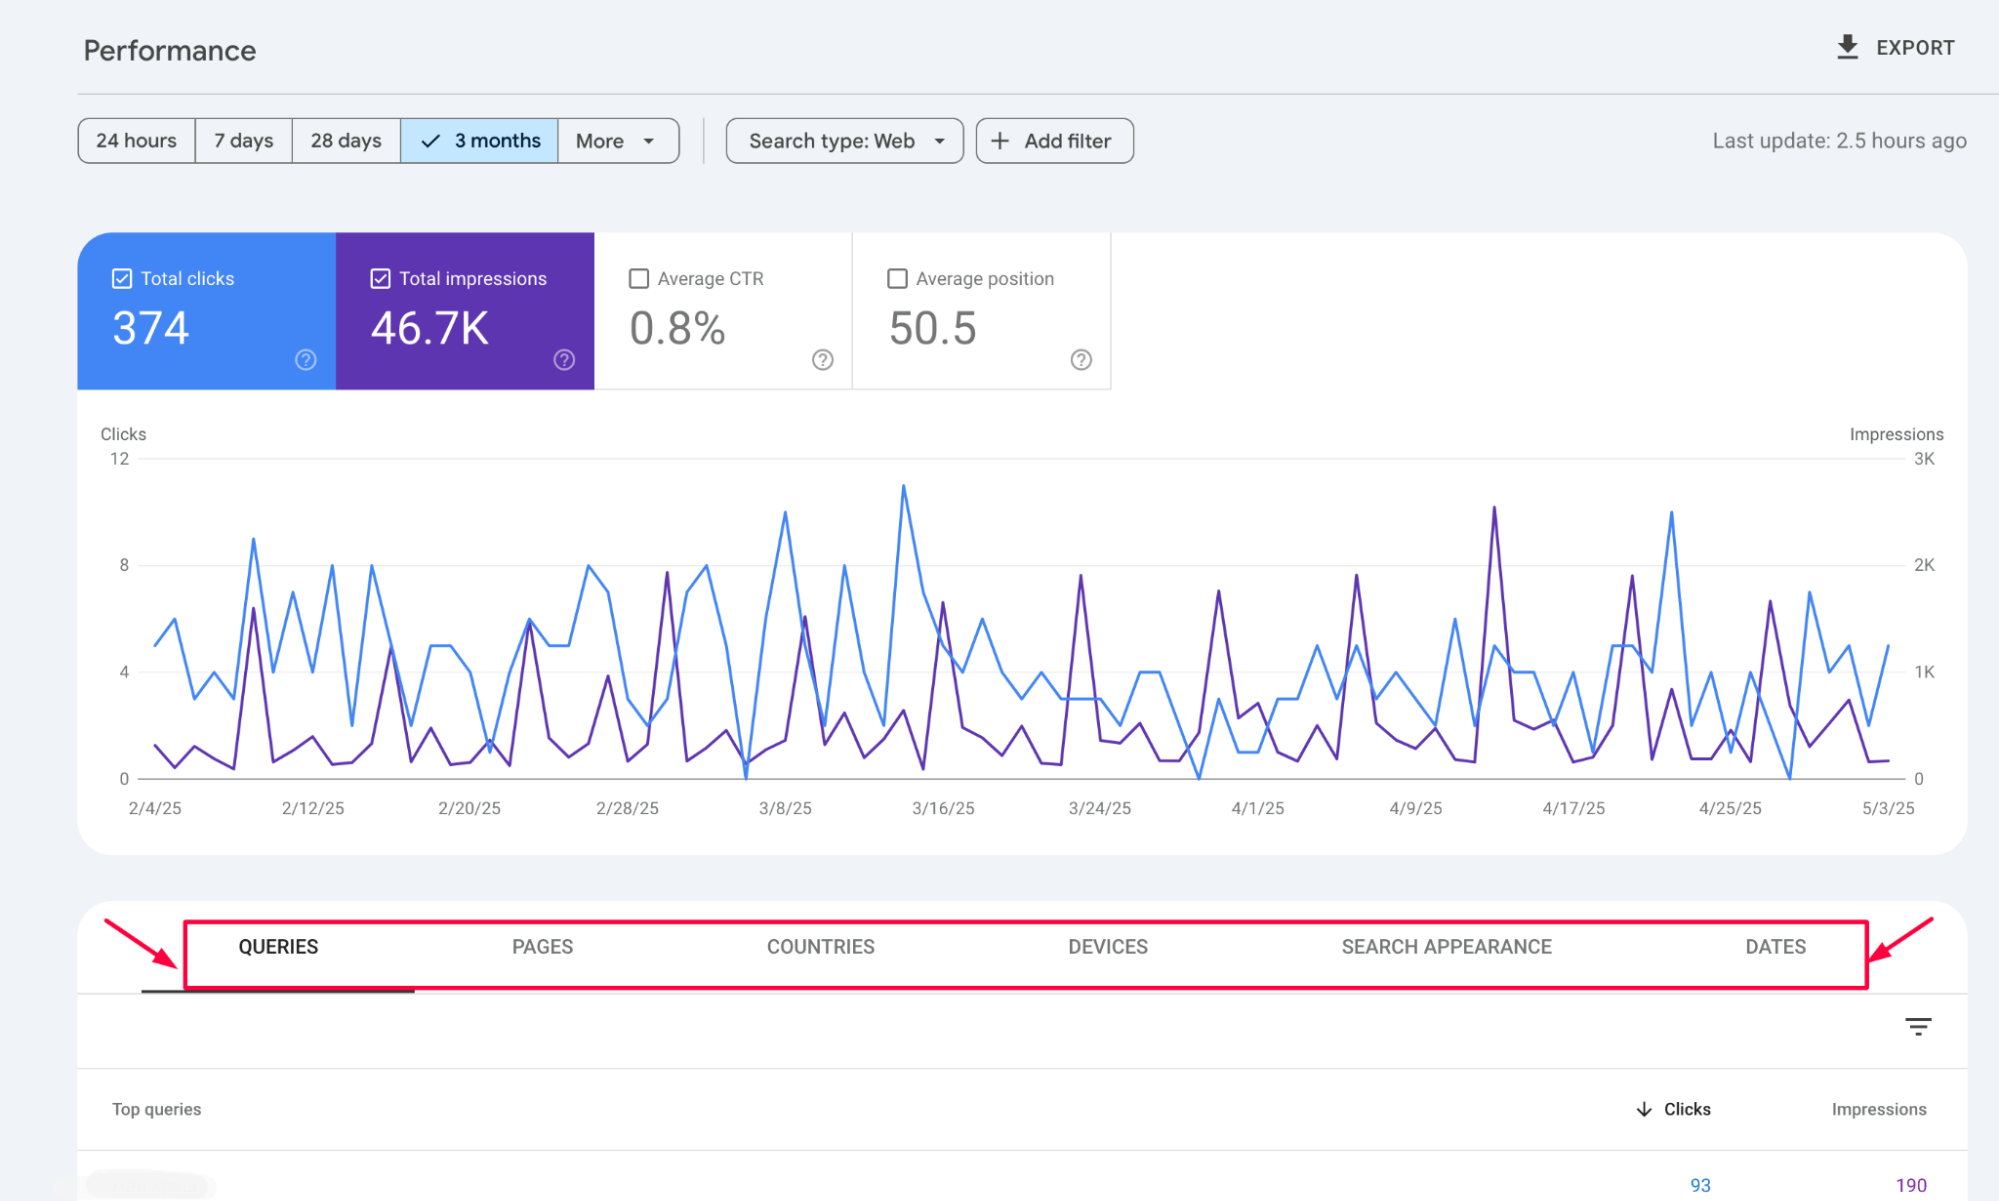
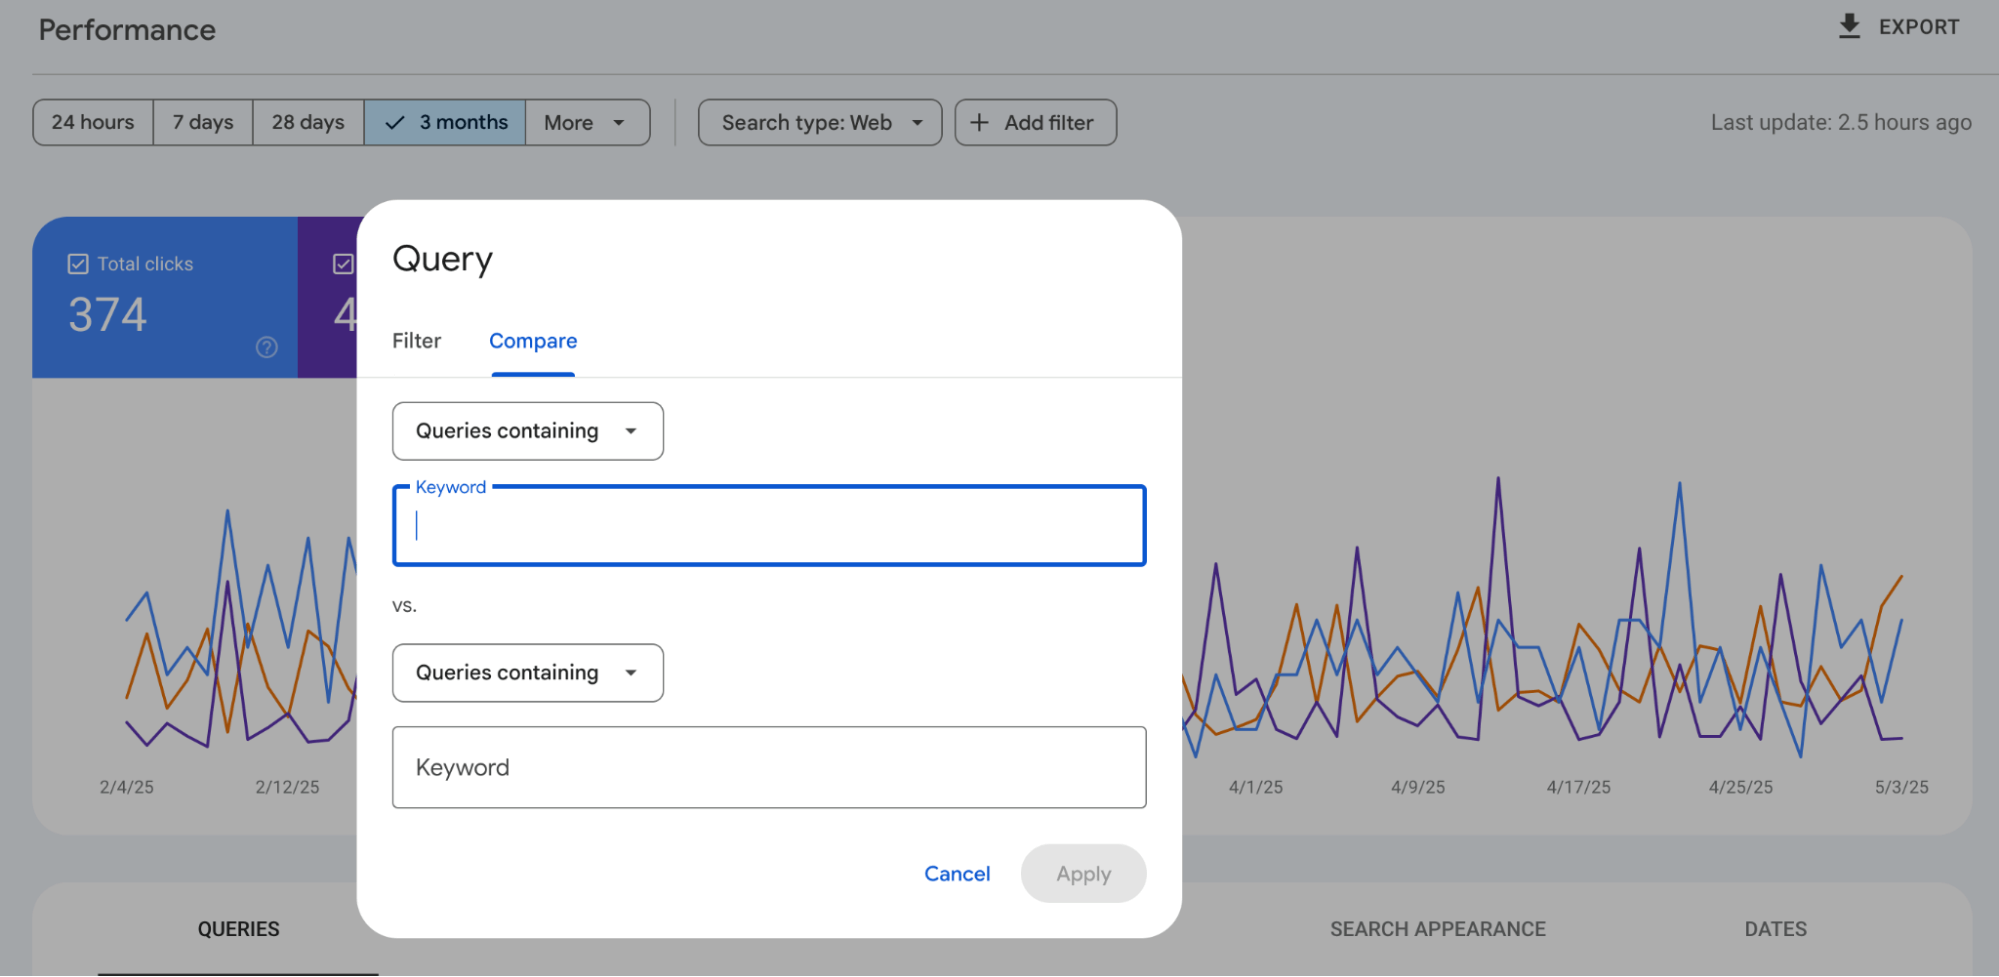
Use the “Compare” feature to measure changes over time and see what’s working.
All of this helps you identify what’s driving traffic, what’s underperforming, and where to focus your optimization efforts for the biggest impact.
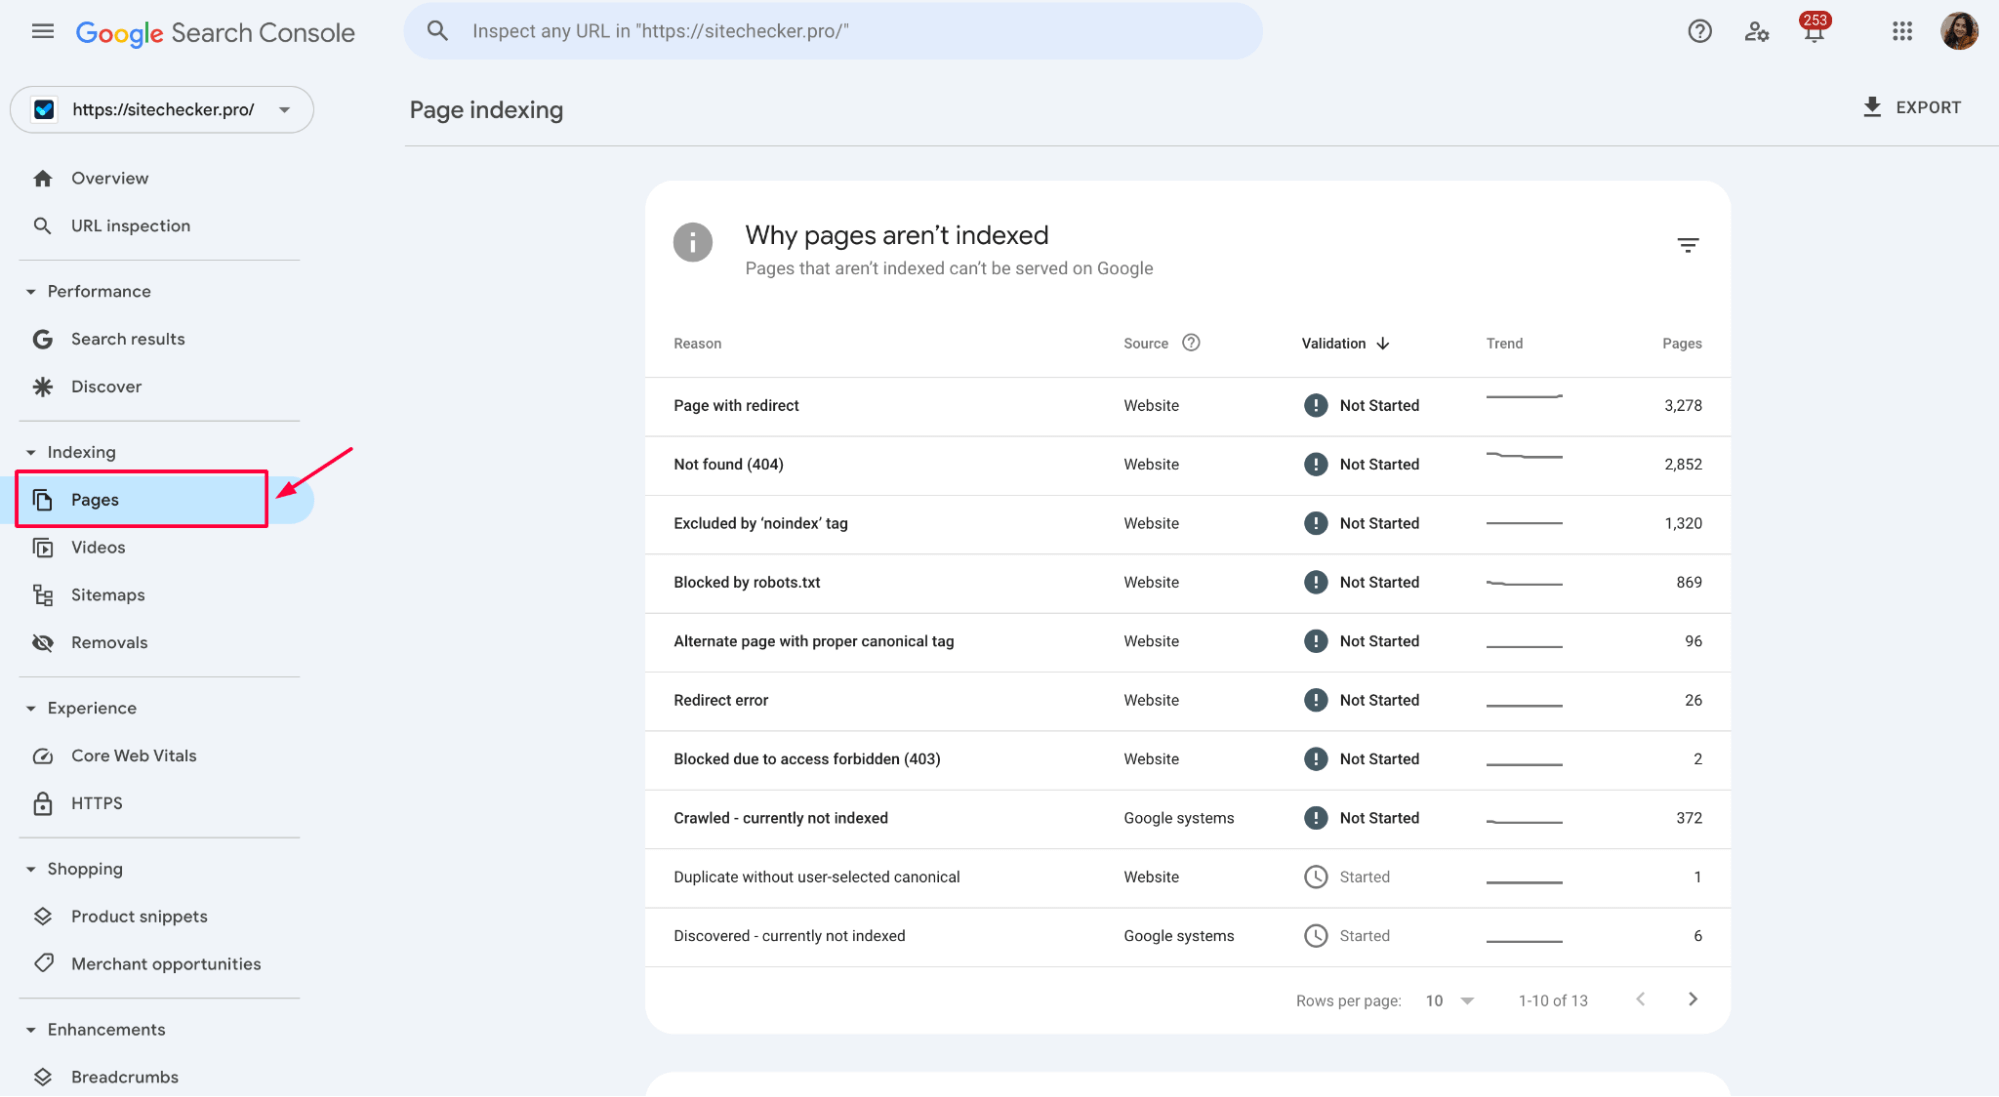
Index coverage & crawlability
The Pages report under Indexing tells you which URLs Google can and cannot index. Pay close attention to the four status types: Error, Valid with warnings, Valid, and Excluded.
Errors often include 404 pages, server issues, or redirect problems – these should be fixed first.
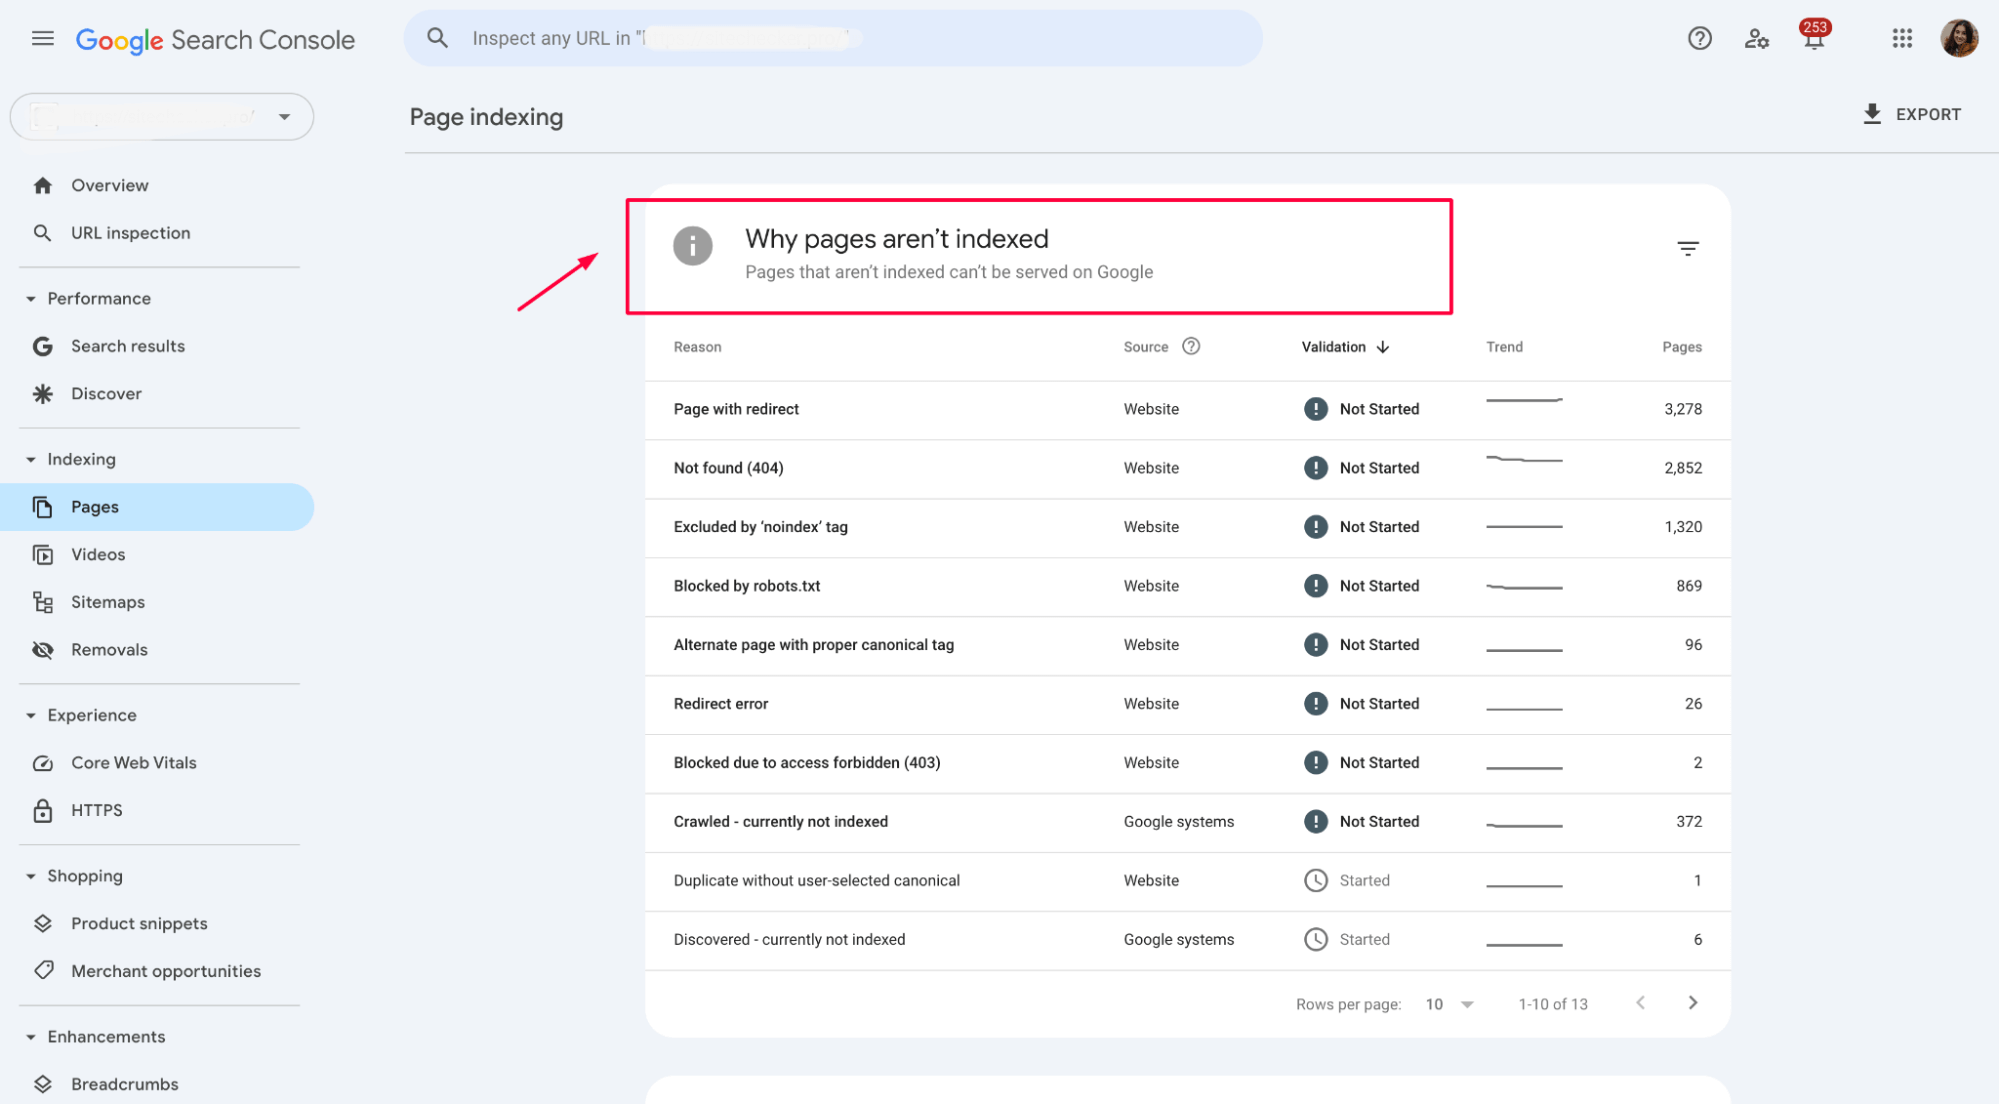
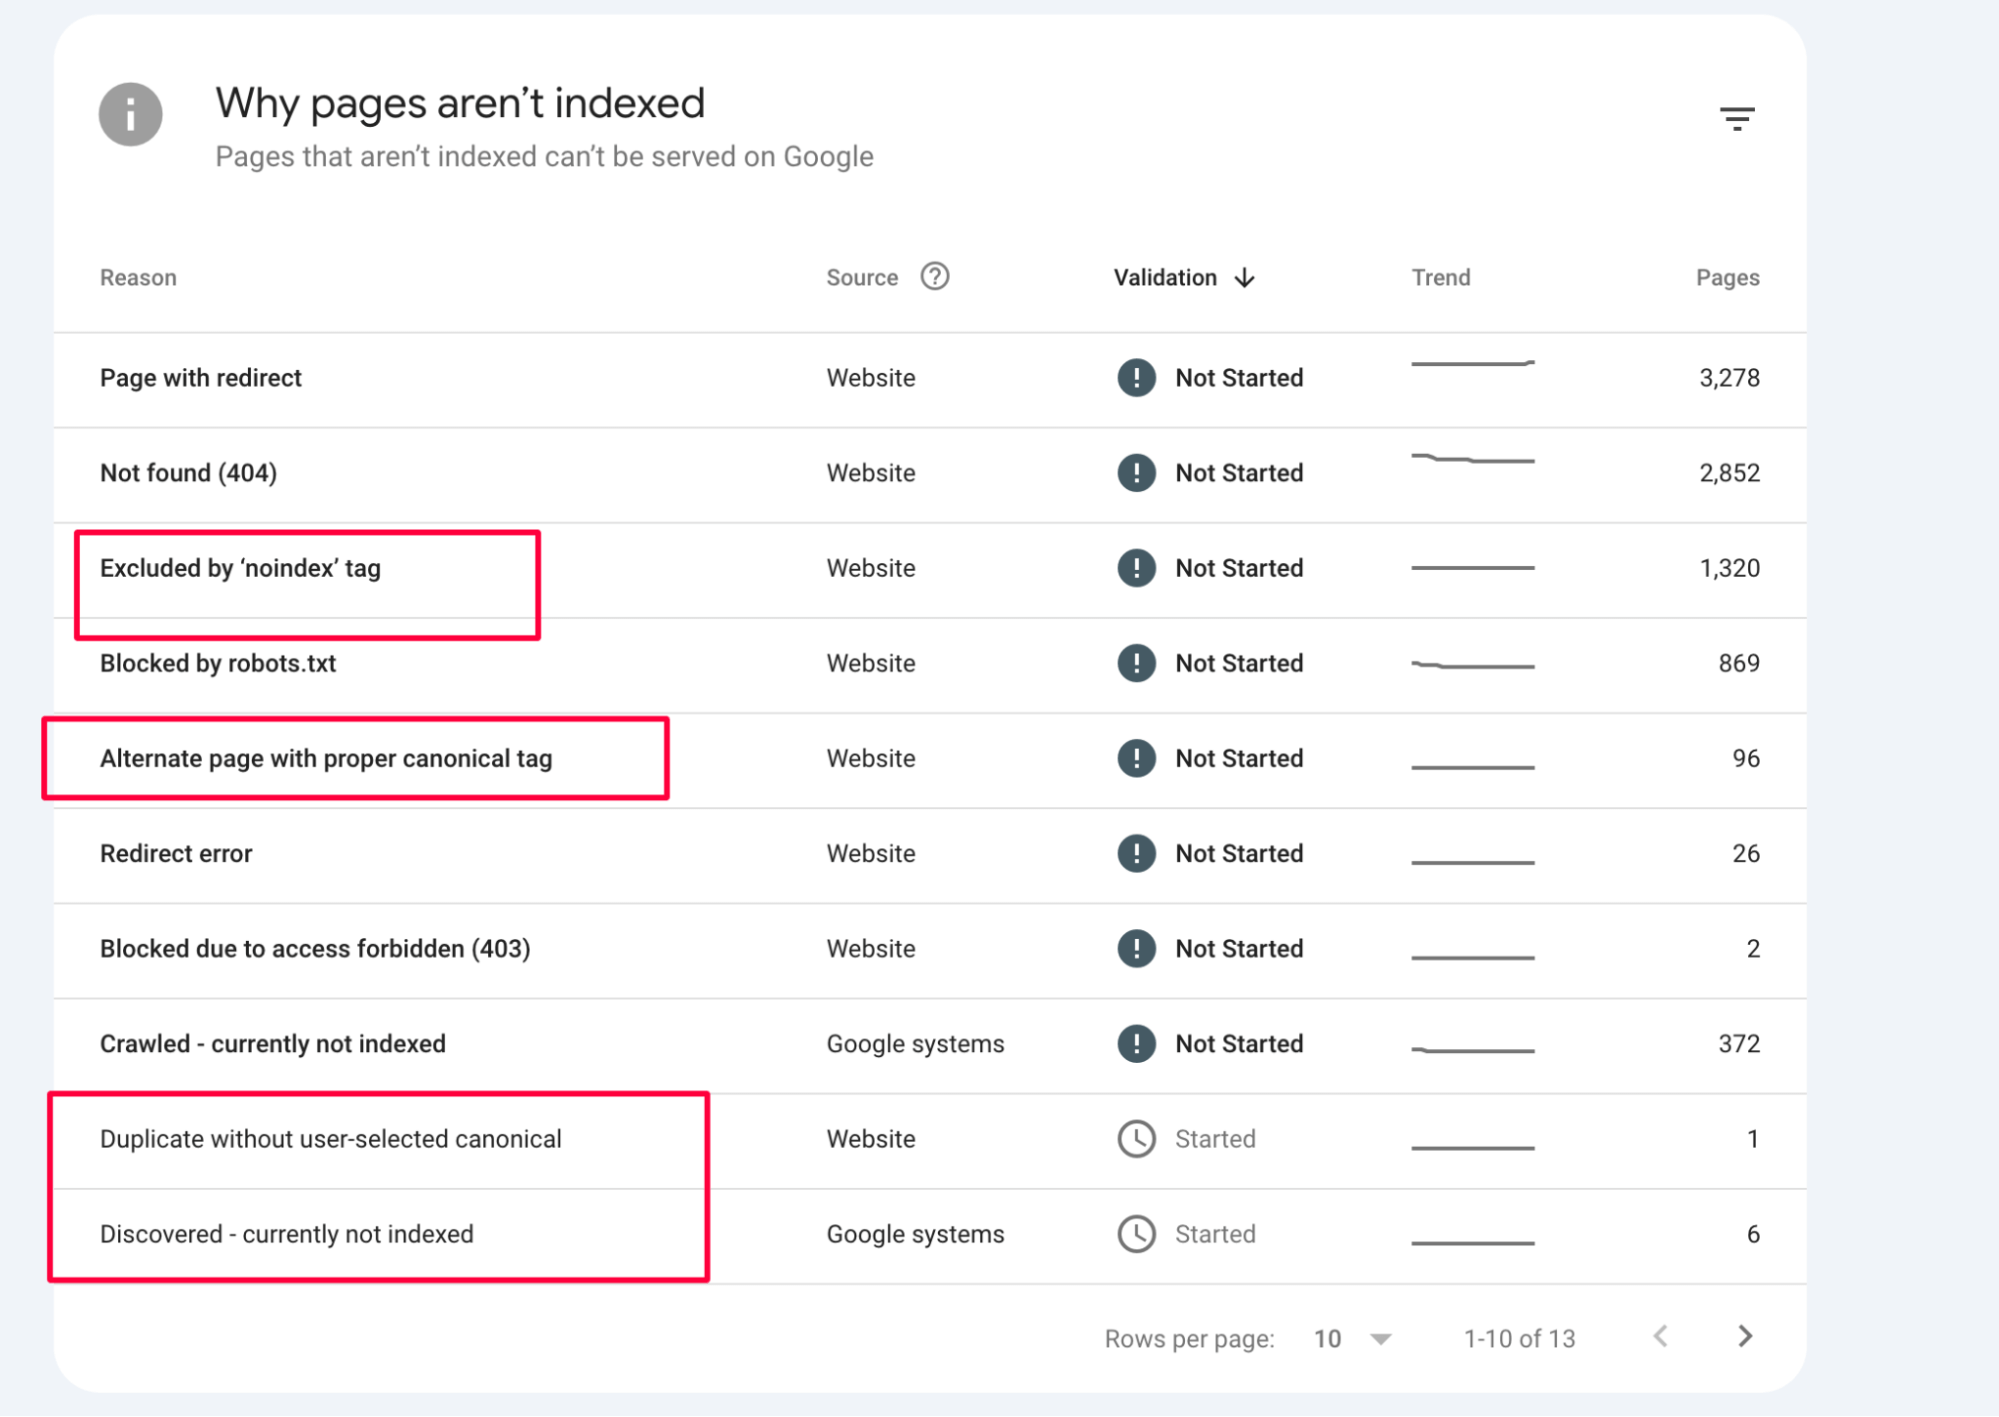
“Excluded” usually hides a mix of expected and problematic pages (e.g., noindex tags, canonical conflicts, or blocked by robots.txt).
Find links to detailed guides that explain how to fix each specific problem in GSC:
- How to Fix Soft 404 Errors
- Google Search Console Couldn’t Fetch Sitemap
- Discovered – Currently Not Indexed
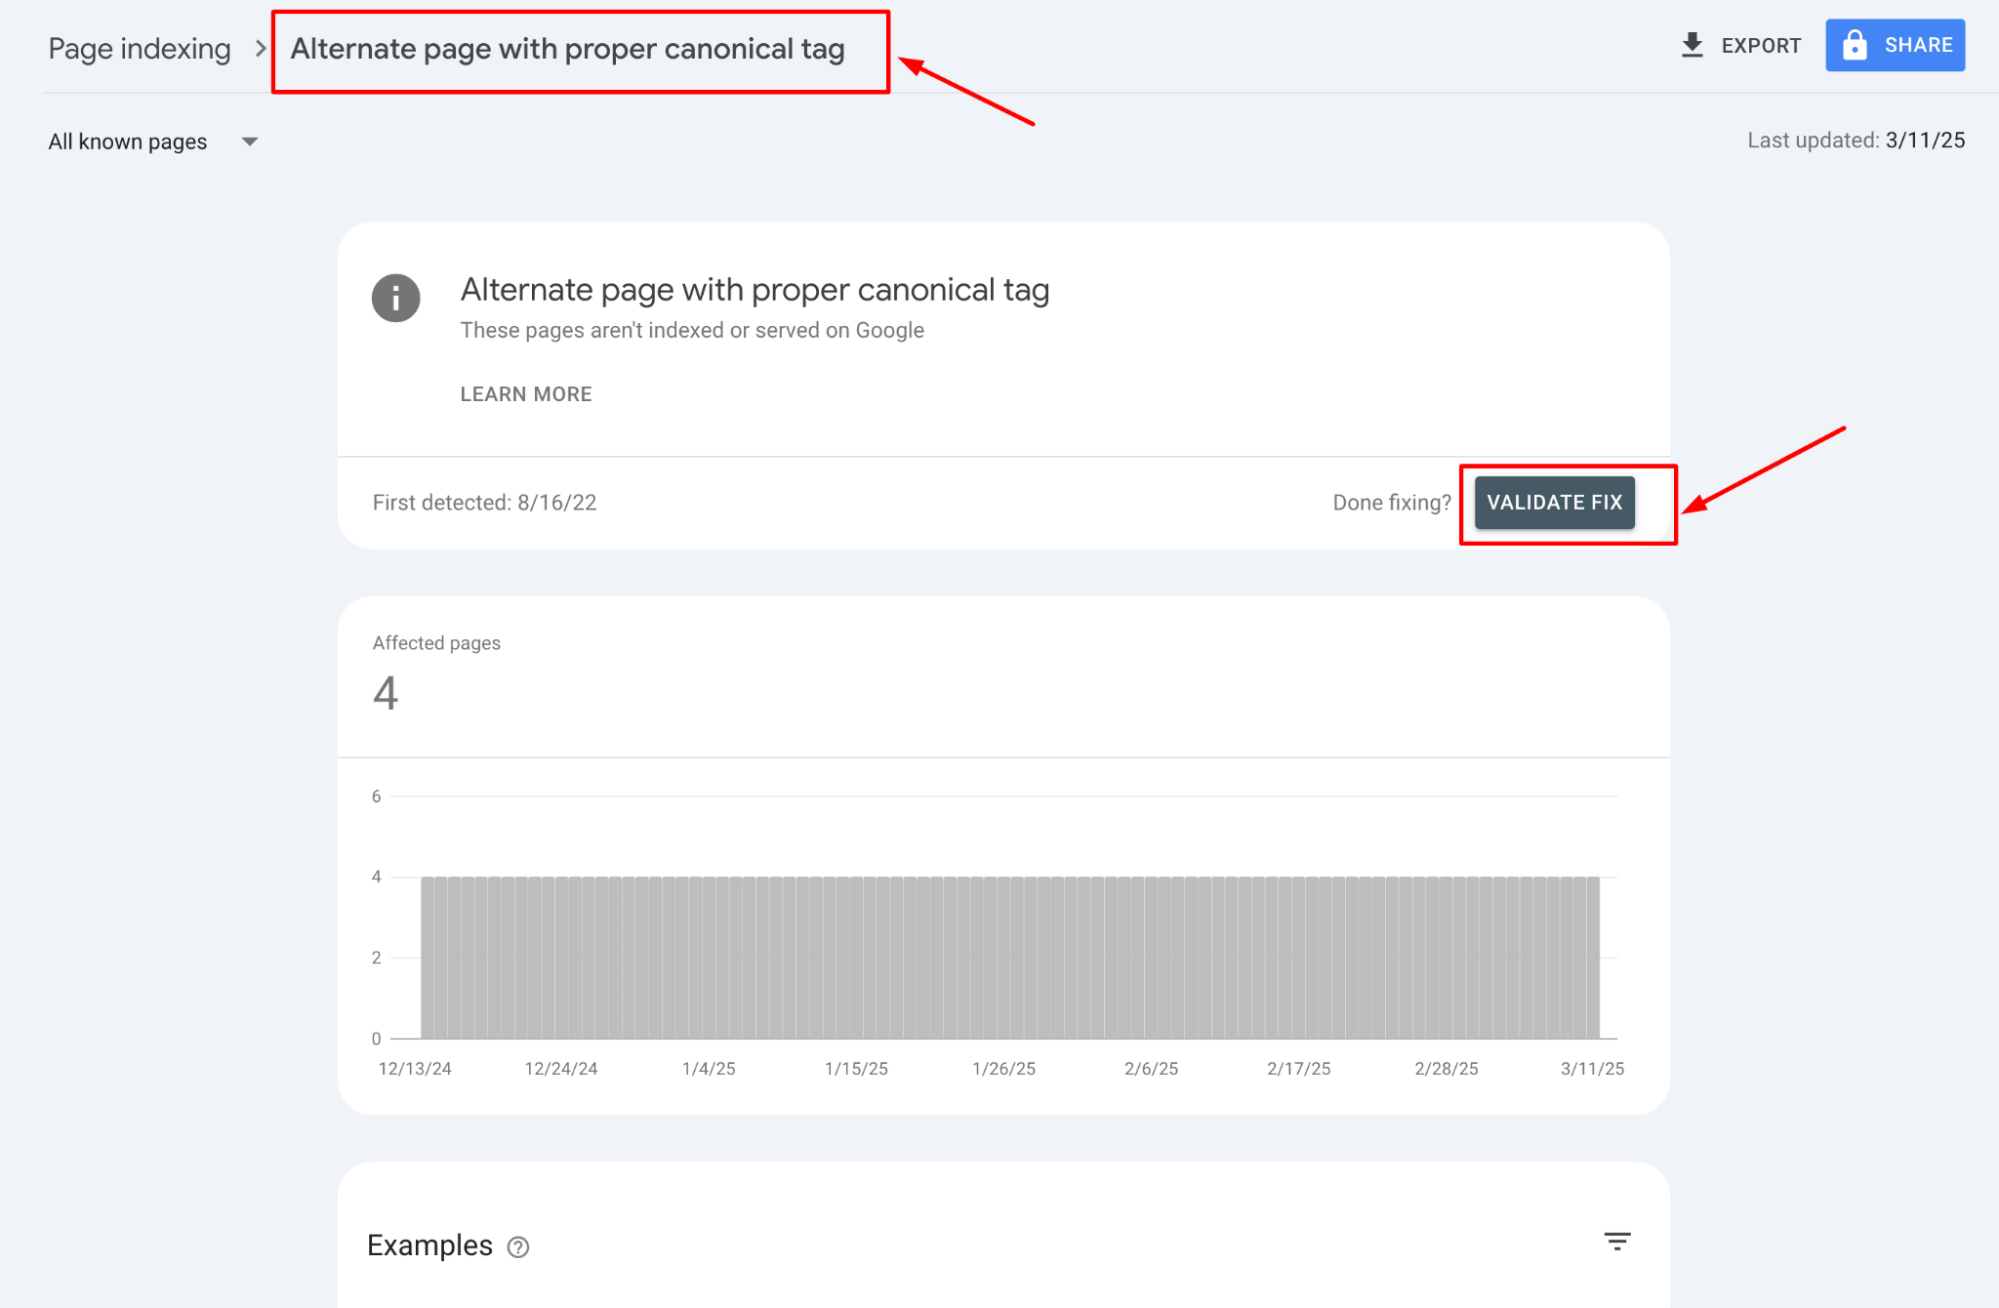
- Alternate Page with Proper Canonical Tag
- Video Outside the Viewport
- Indexed, Though Blocked by robots.txt
- Duplicate Without User-Selected Canonical
- Excluded by ‘Noindex’
- Submitted URL Marked Noindex
- Page with Redirect
- 5xx Server
- 404 Not Found
- Blocked Due to Unauthorized Request (401)
- Blocked Due to Access Forbidden (403)
Use the URL Inspection Tool to check individual URLs: is it indexed? When was it last crawled? Are there any crawl blocks or coverage issues?
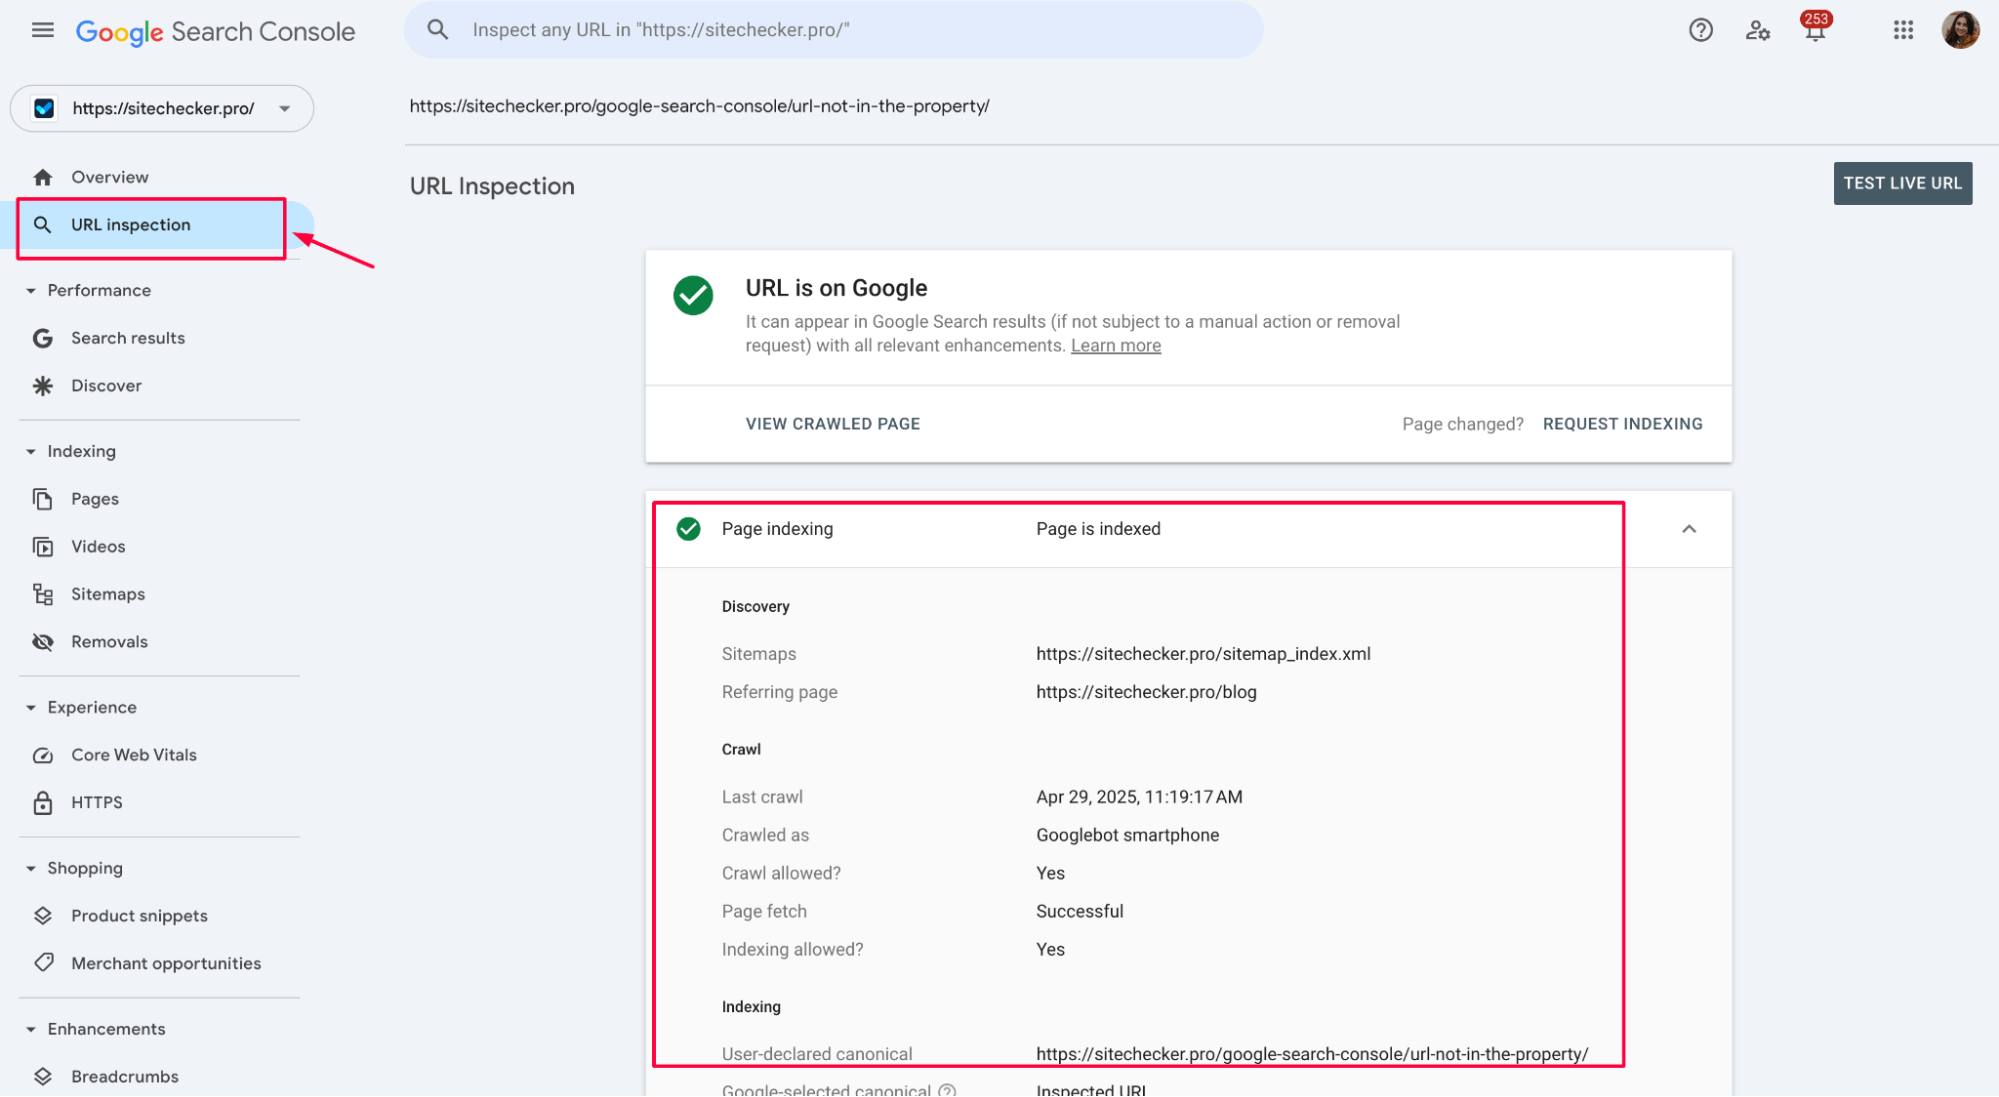
This helps you make sure your most important pages are accessible and getting the visibility they deserve.
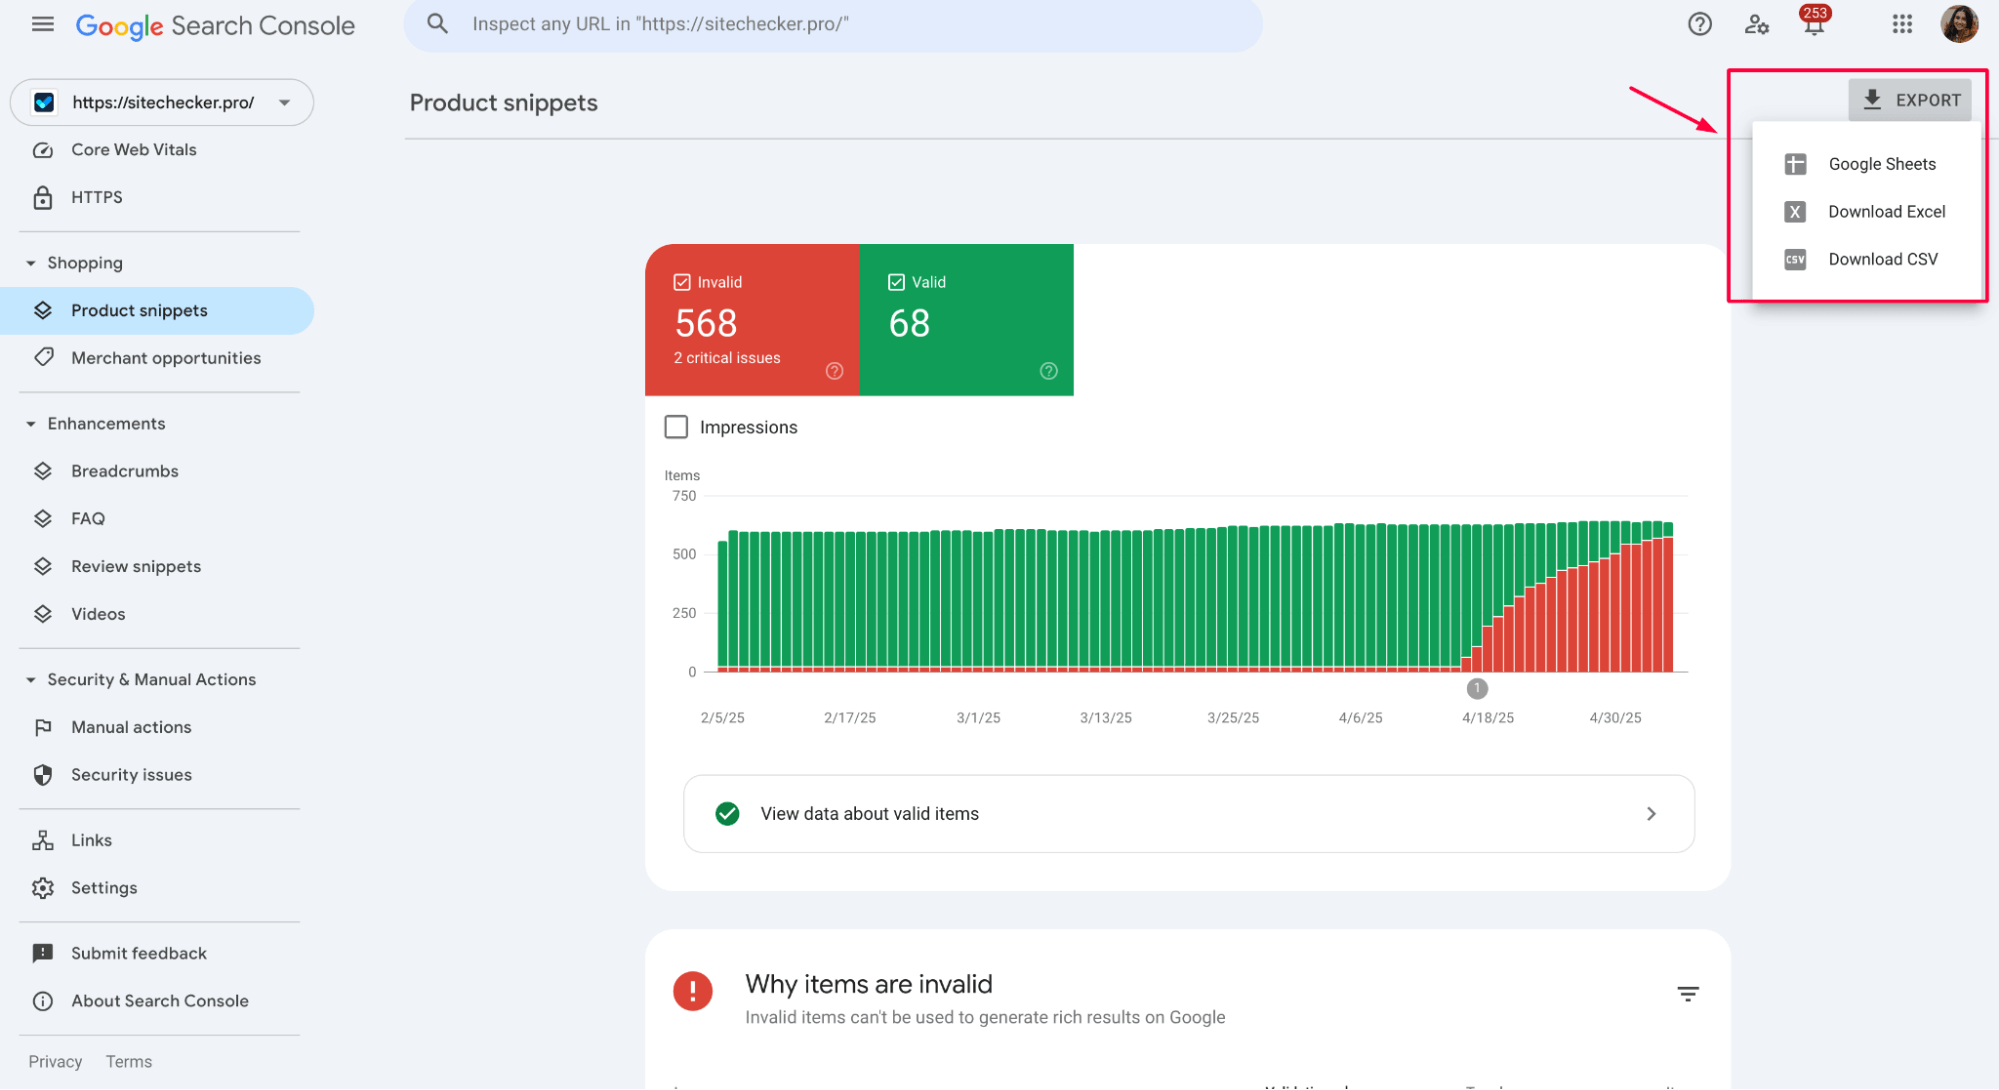
Product snippets
If you’re running an eCommerce site or listing products, the Product snippets report in GSC is one you can’t afford to skip. It shows whether your product pages are eligible for rich results – like star ratings, price, and availability – in Google Search. These extras can significantly boost visibility and CTR.
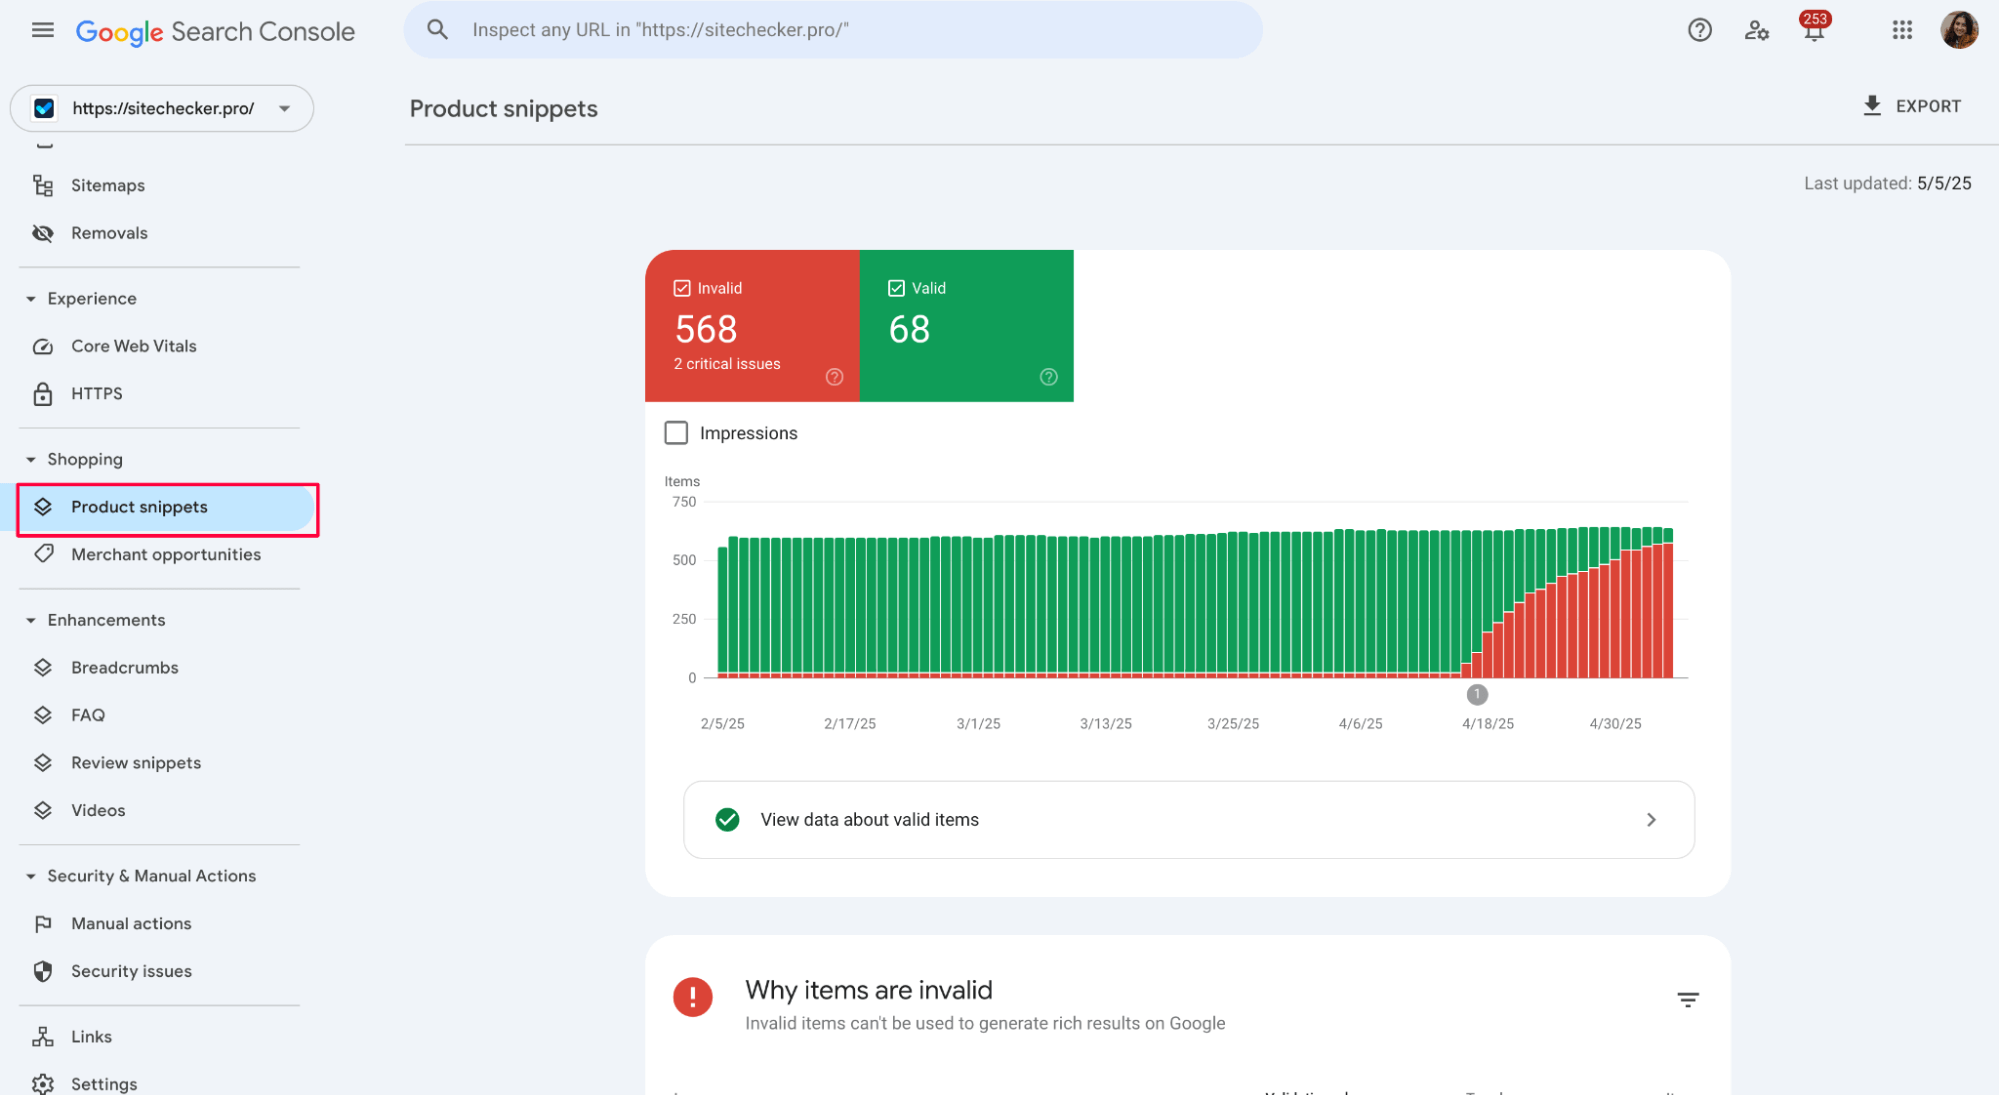
Invalid items – meaning something broke or changed recently in the schema. Common issues include missing price, availability, or name fields, or using the wrong structured data format altogether.
Fixing these issues usually involves updating the markup on your product pages (manually, via CMS, or through your product feed). Once fixed, click “Validate Fix” in GSC to reprocess the URLs.
The goal is to shift as many pages as possible into the green “Valid” zone so they’re eligible for enhanced display in SERPs.
Enhancements: Structured data insights
The Enhancements section in GSC shows how well your structured data is implemented and whether it’s eligible for rich results in search. You’ll find reports for features like Breadcrumbs, FAQs, Review snippets, and Videos – depending on what schema types your site uses.
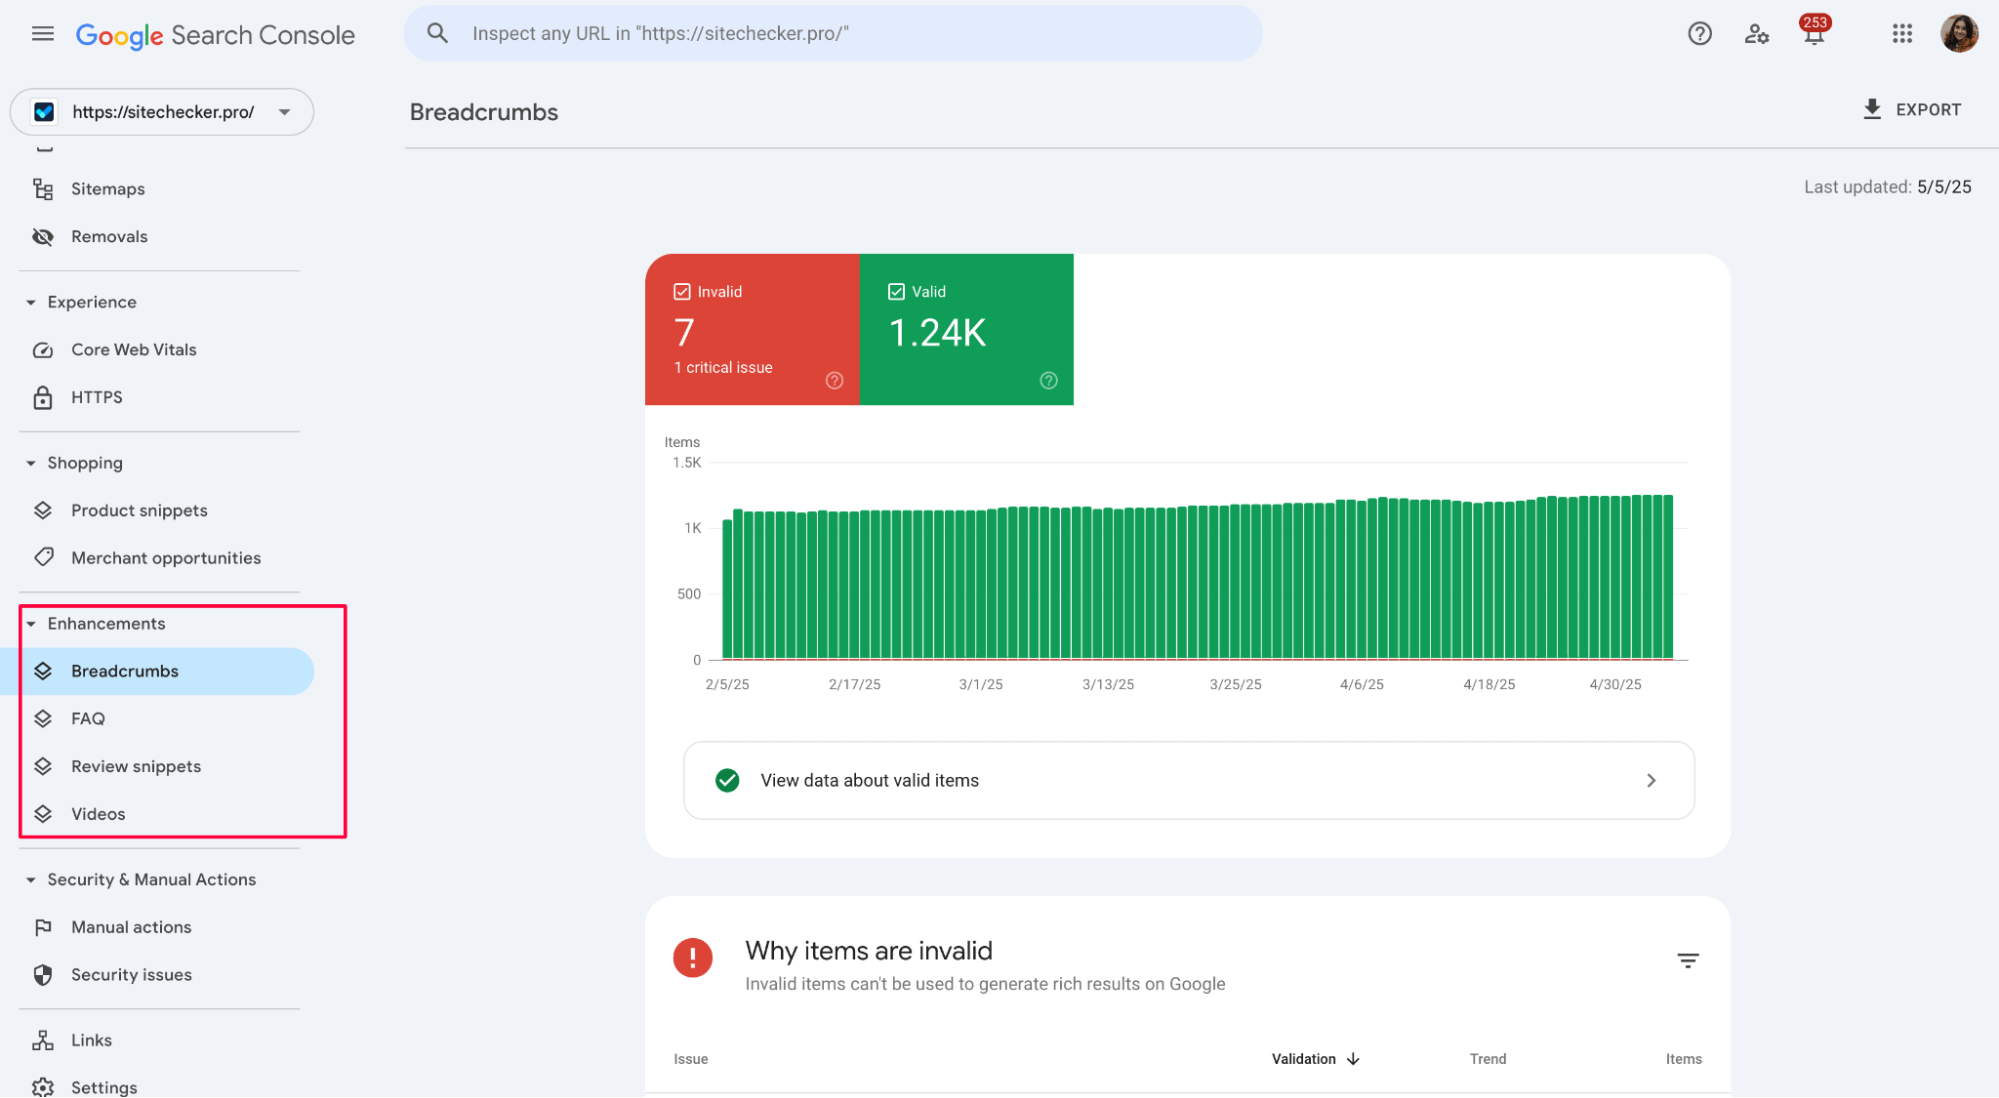
Each report highlights which items are Valid, which need improvements, and which are Invalid and won’t show rich results at all. For example, if your Breadcrumbs markup is broken, you’ll see the number of affected URLs along with a description of what’s missing or incorrect.
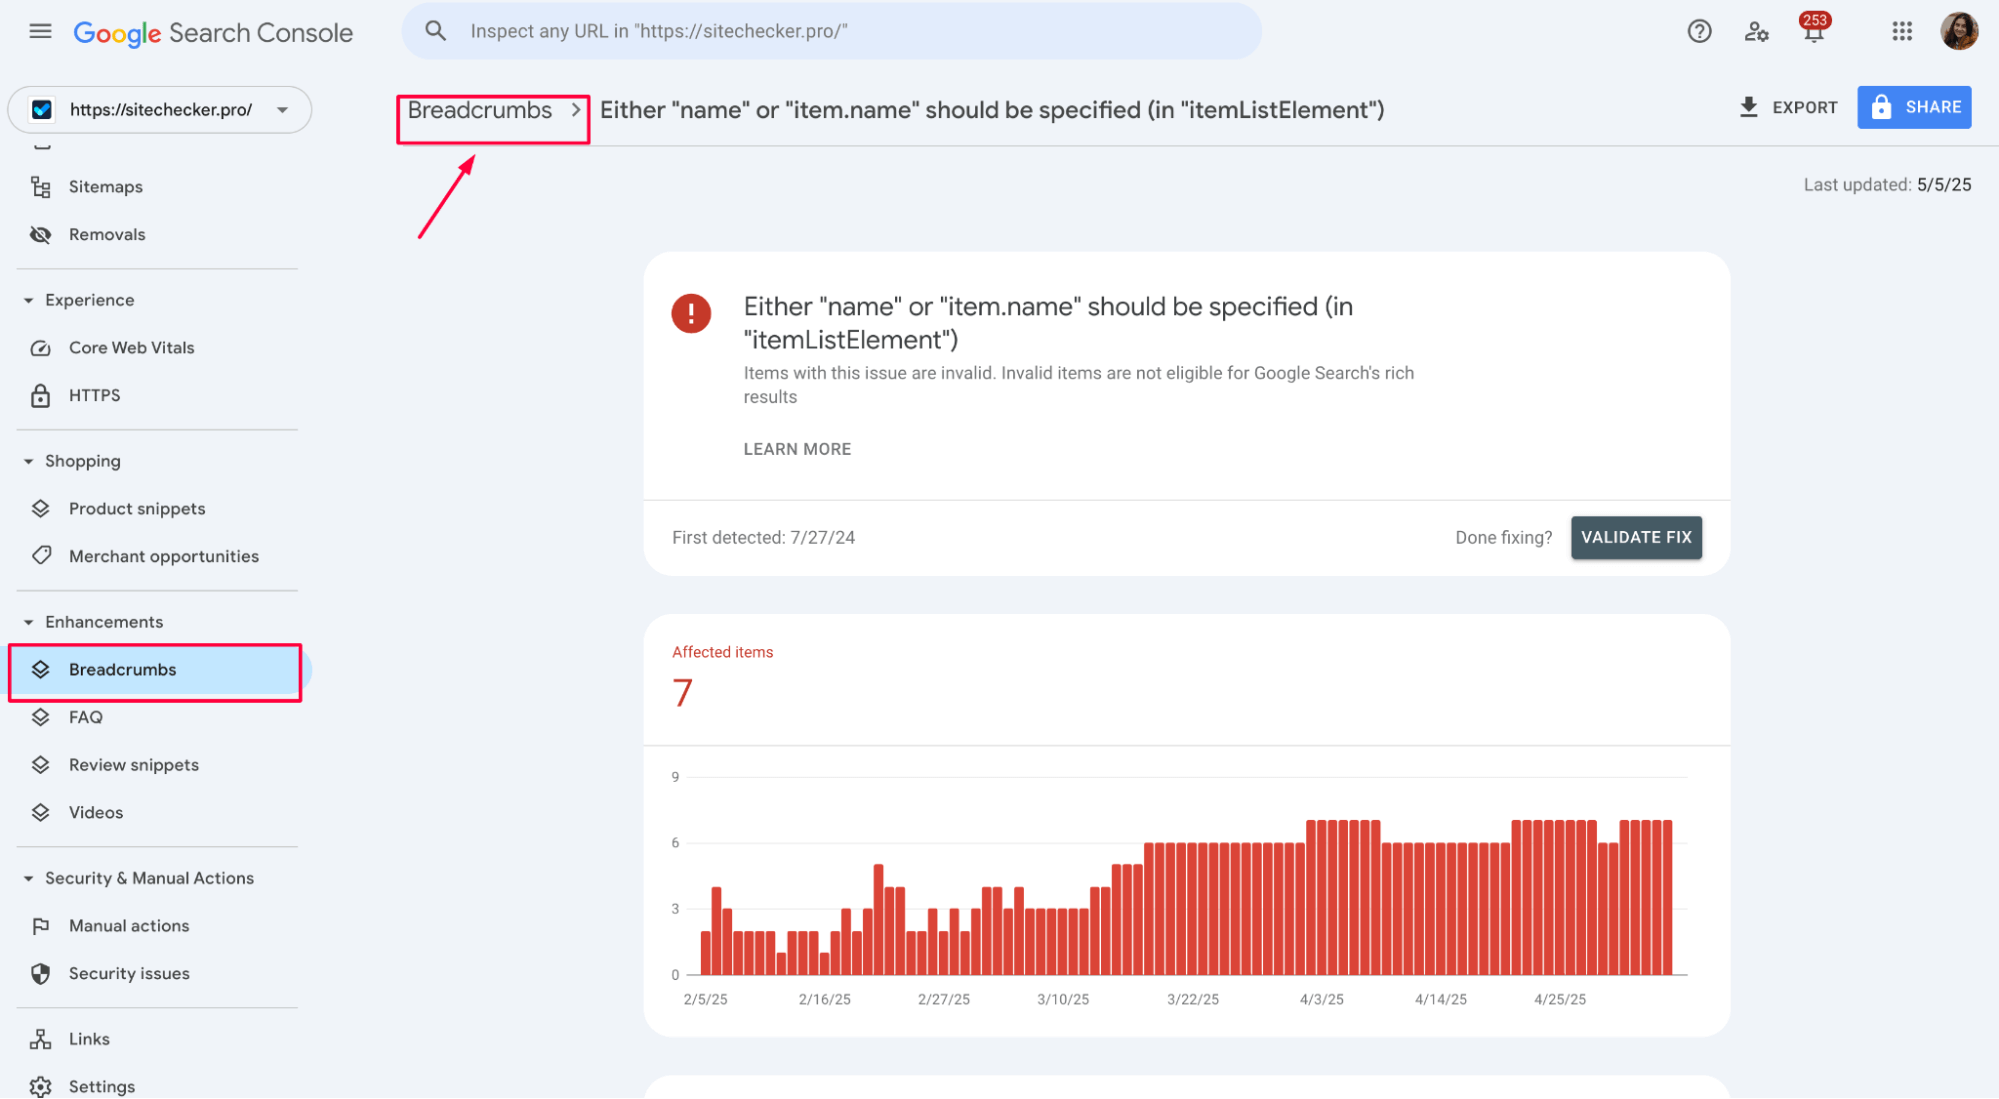
Use this data to fix markup errors directly in your code or CMS. Even a small fix can help enhance your visibility in search – rich results like stars, site links, and FAQs can boost CTR without changing rankings.
This part of GSC is easy to overlook, but it’s key for making your listings stand out in the SERPs.
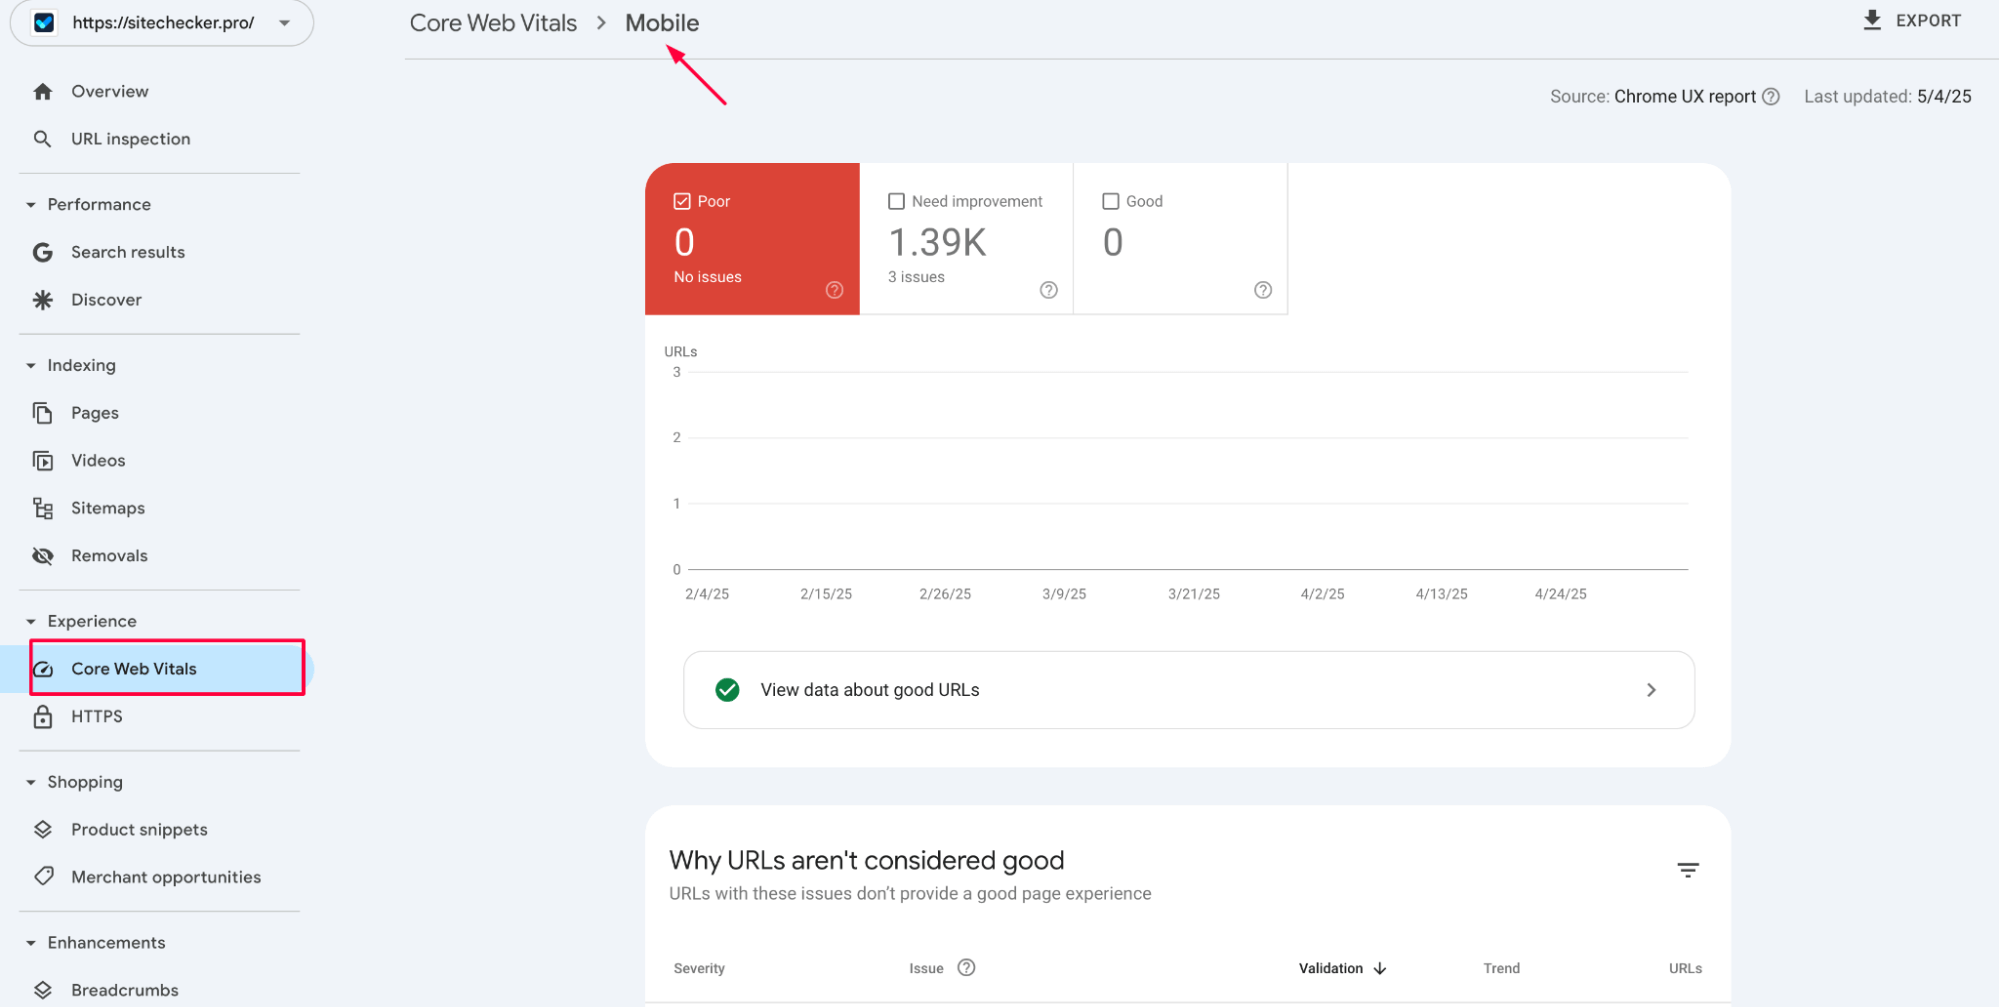
Core Web Vitals
Core Web Vitals are a key part of Google’s page experience signals — they directly affect your rankings, especially on mobile. In GSC, head to Experience > Core Web Vitals to see how your pages perform based on real user data from Chrome.
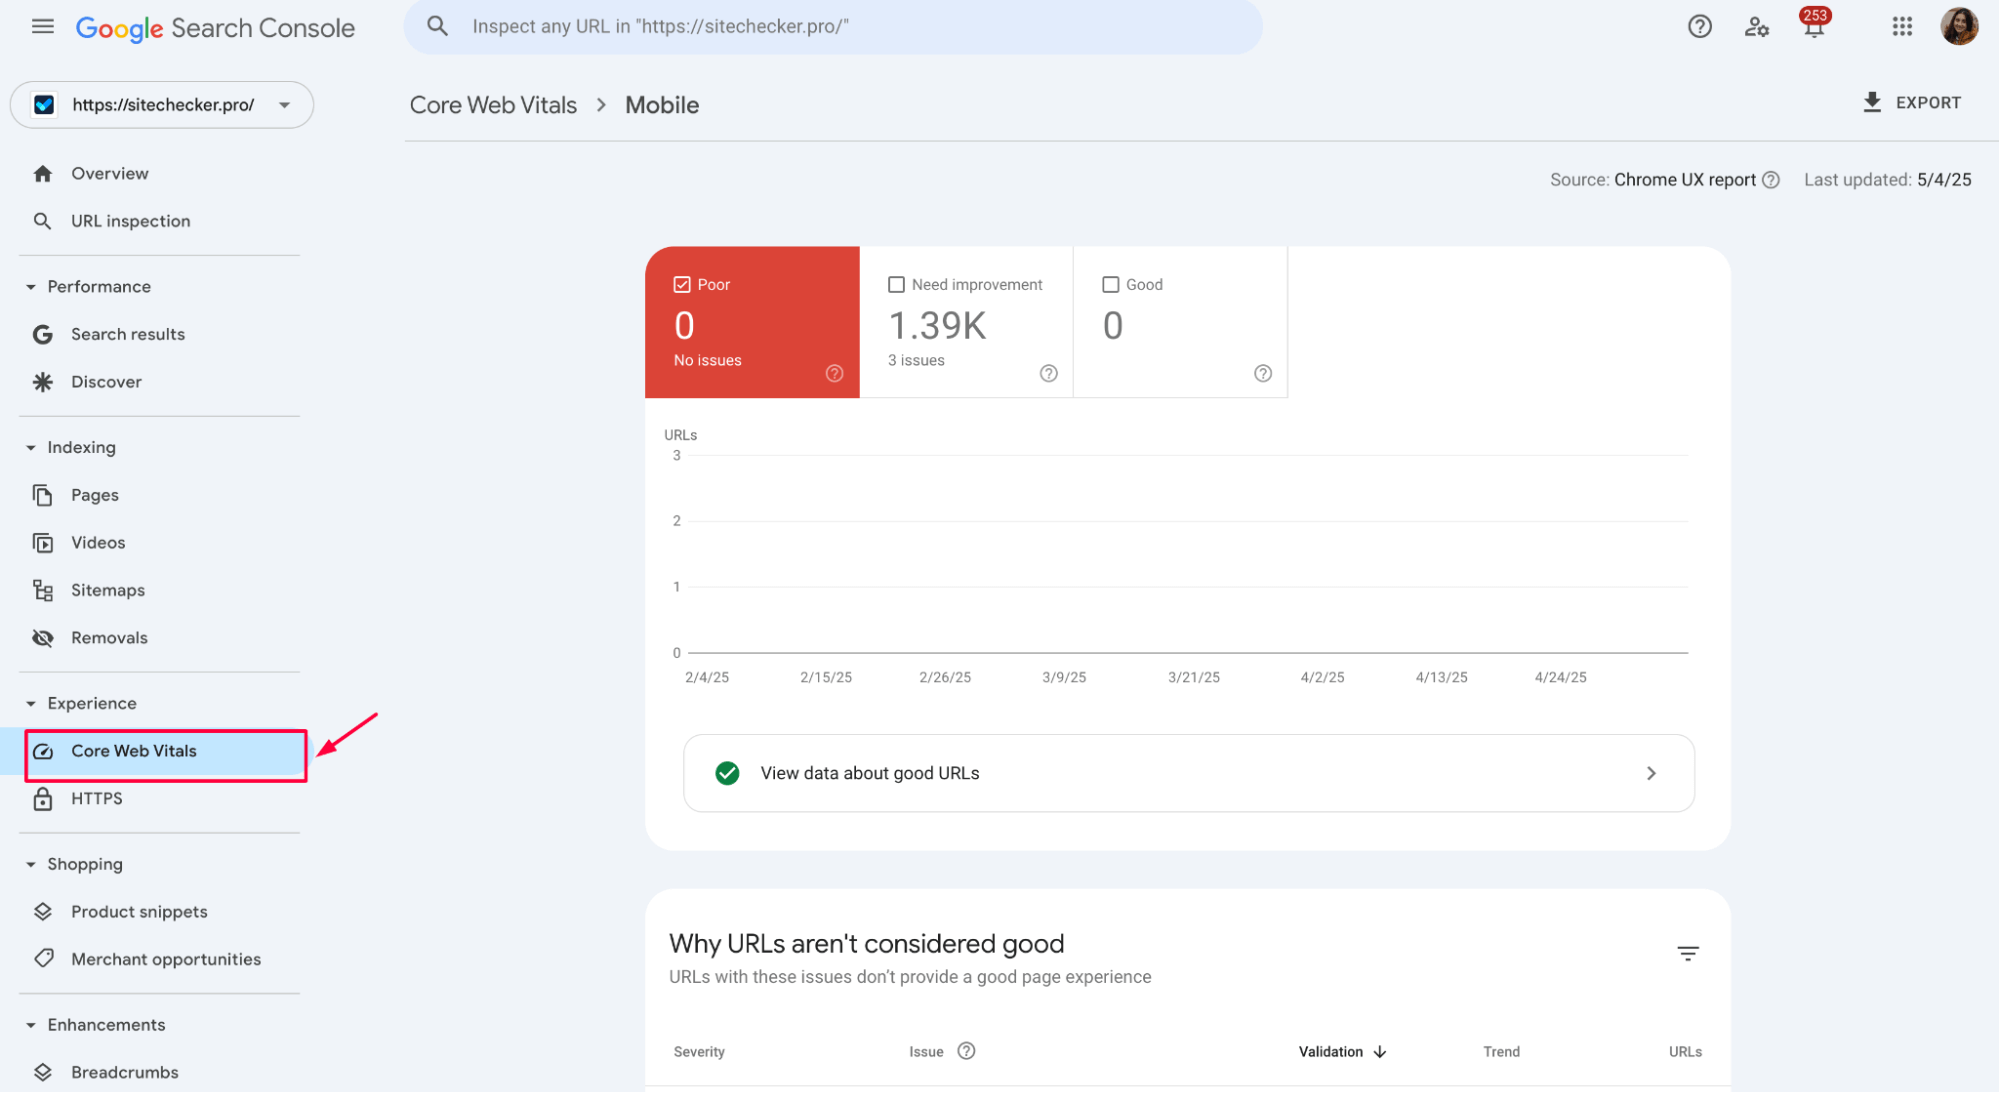
The report splits URLs into three buckets: Poor, Needs Improvement, and Good. The main metrics to watch are:
- LCP (Largest Contentful Paint) – how fast the main content loads
- FID (First Input Delay) – how quickly the page responds to interactions
- CLS (Cumulative Layout Shift) – how stable the page layout is during load
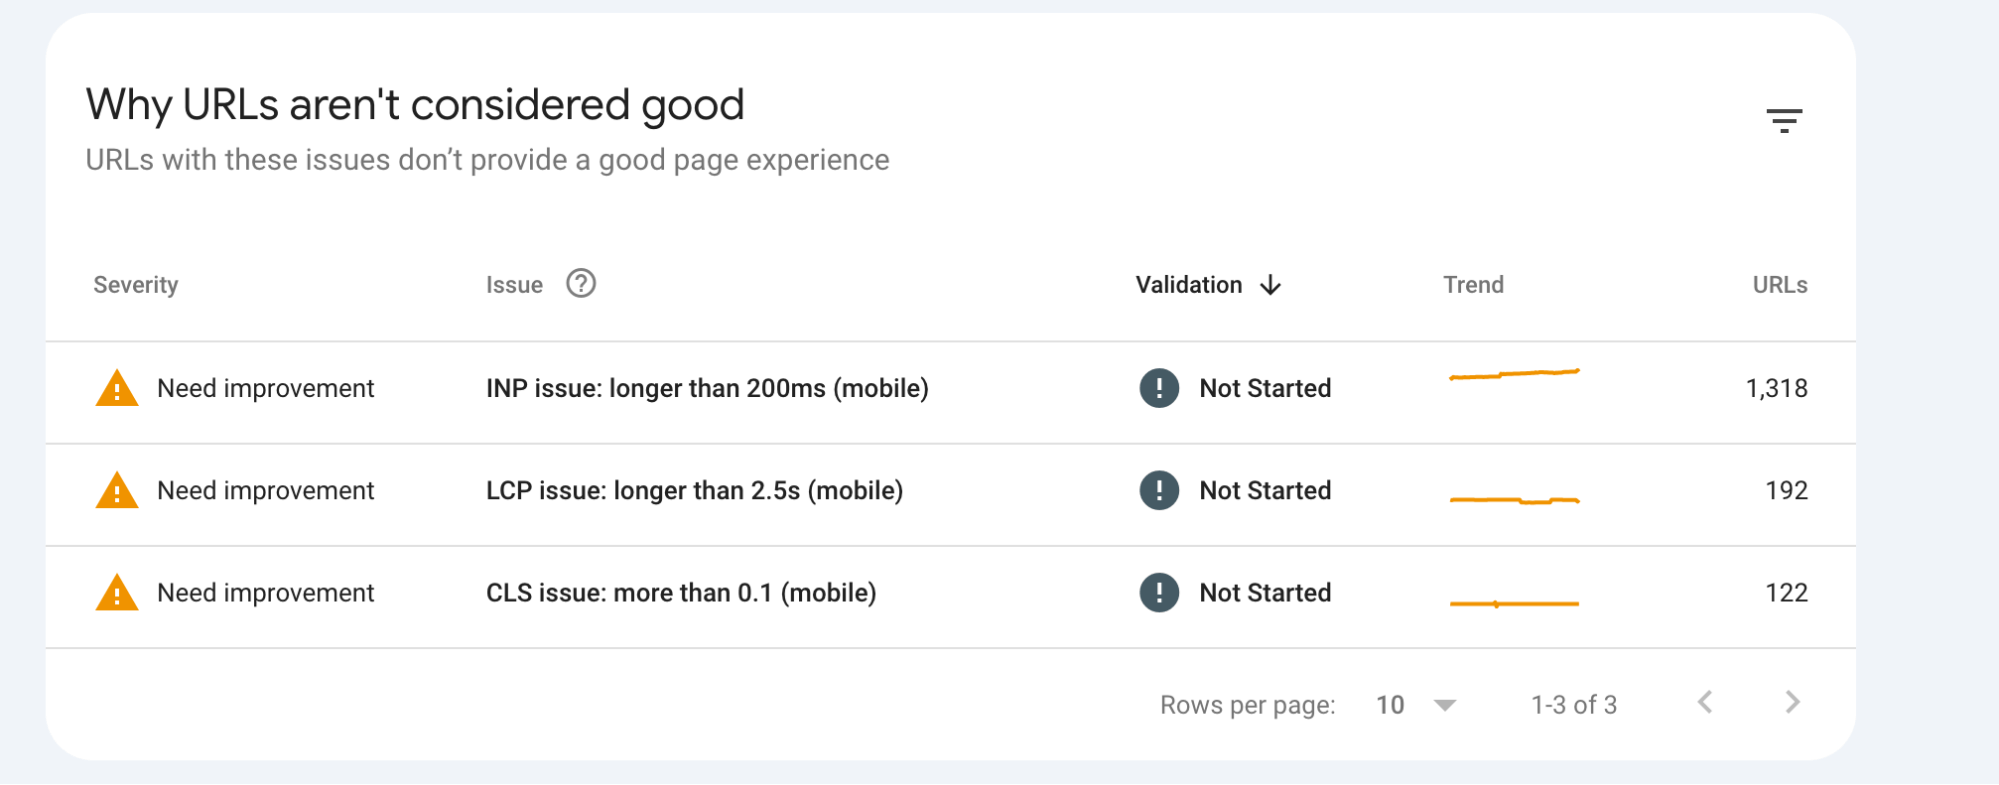
If your pages fall into the “Needs Improvement” or “Poor” categories, it’s worth reviewing what’s causing delays – oversized images, slow scripts, or layout shifts.
You don’t have to fix every page manually: focus on templates and recurring issues first. This report gives you a user-centric view of performance, which is exactly what Google values.
Manual actions & security issues
This section is where you find out if Google has applied a penalty to your site or detected any serious security problems. Go to Security & Manual Actions in GSC.
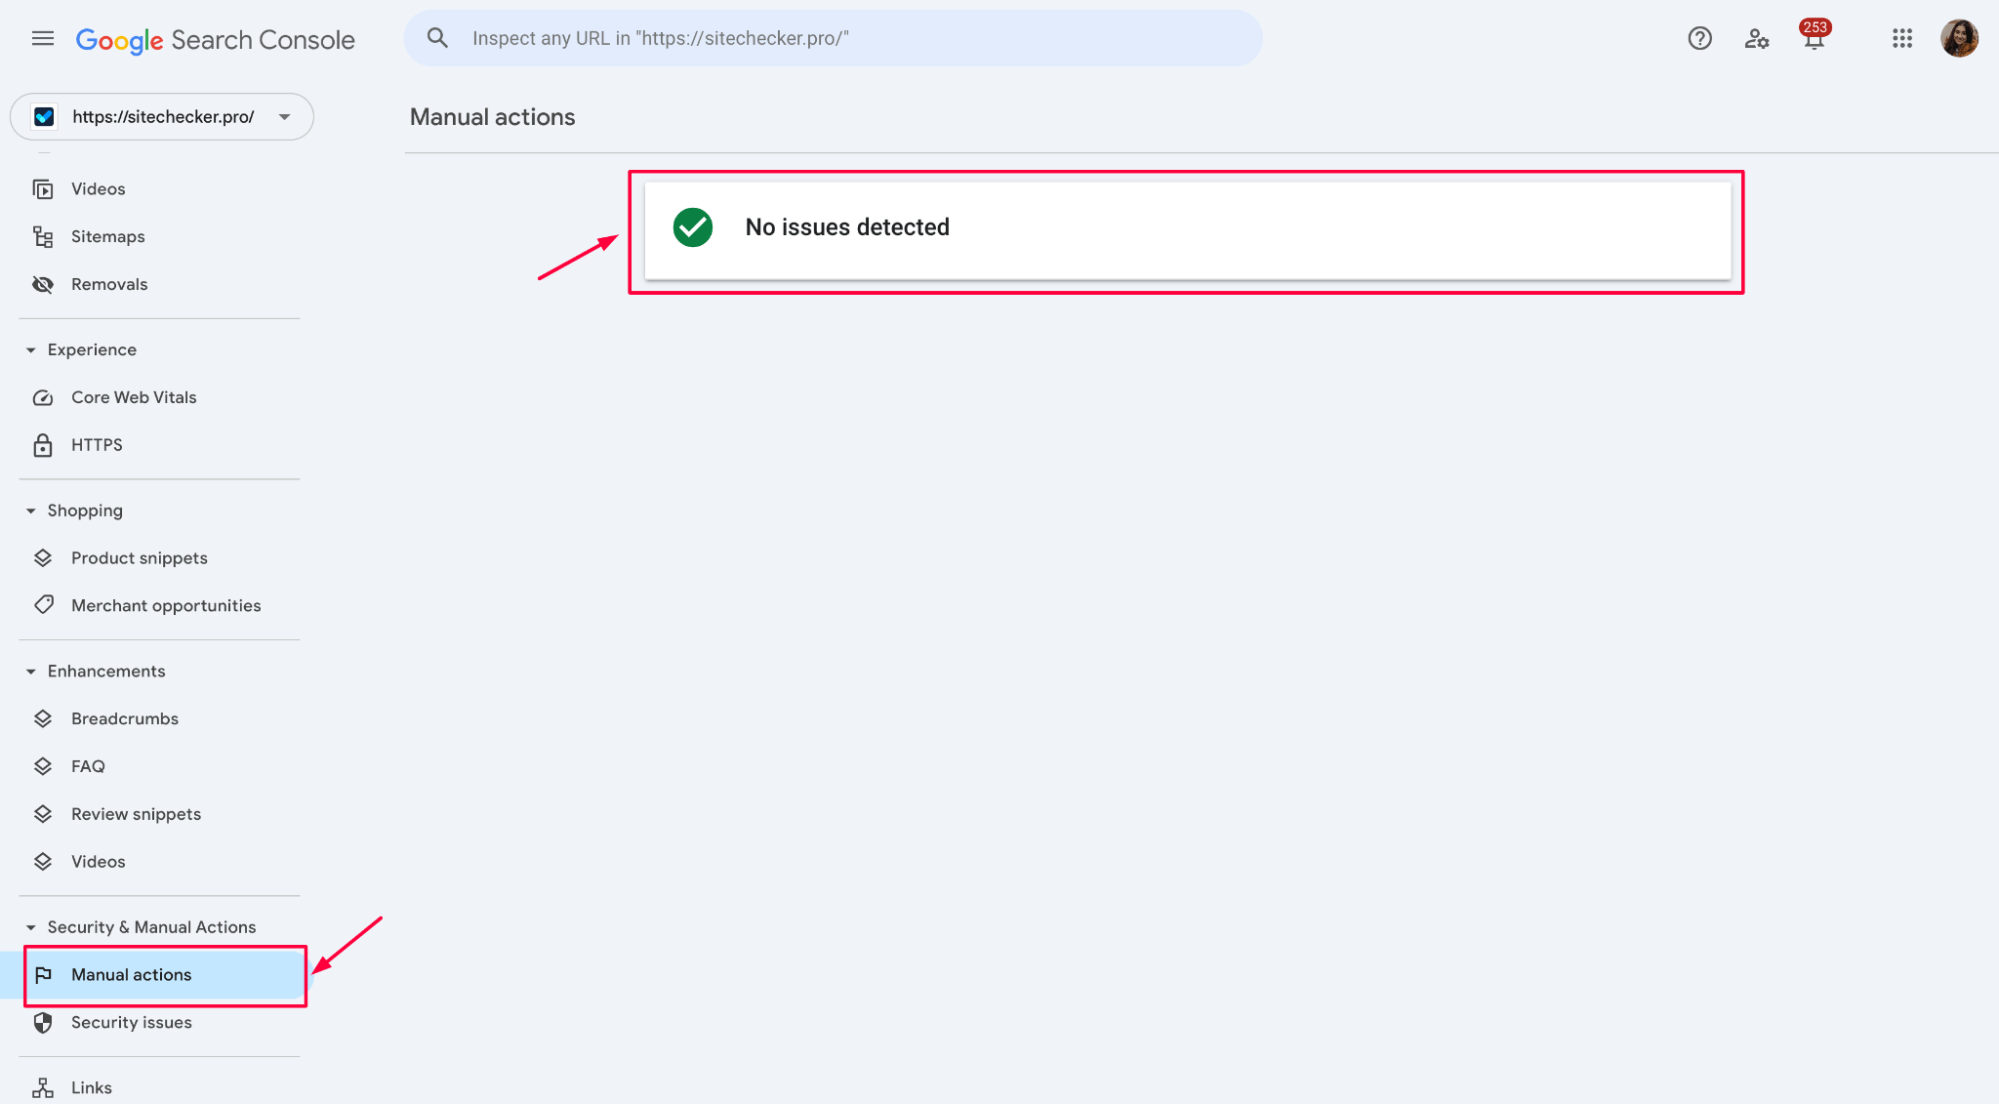
If there’s a manual action, it means a human reviewer flagged your site for violating Google’s guidelines – common reasons include unnatural backlinks, thin content, or spammy structured data.
You’ll see the exact issue listed along with affected pages. Fix the problem, document what you changed, and submit a reconsideration request.
The Security Issues tab flags things like malware, deceptive content, or hacked pages. If your site is compromised, Google may show warnings in search results – so it’s important to act fast. Clean up the issue, then request a review.
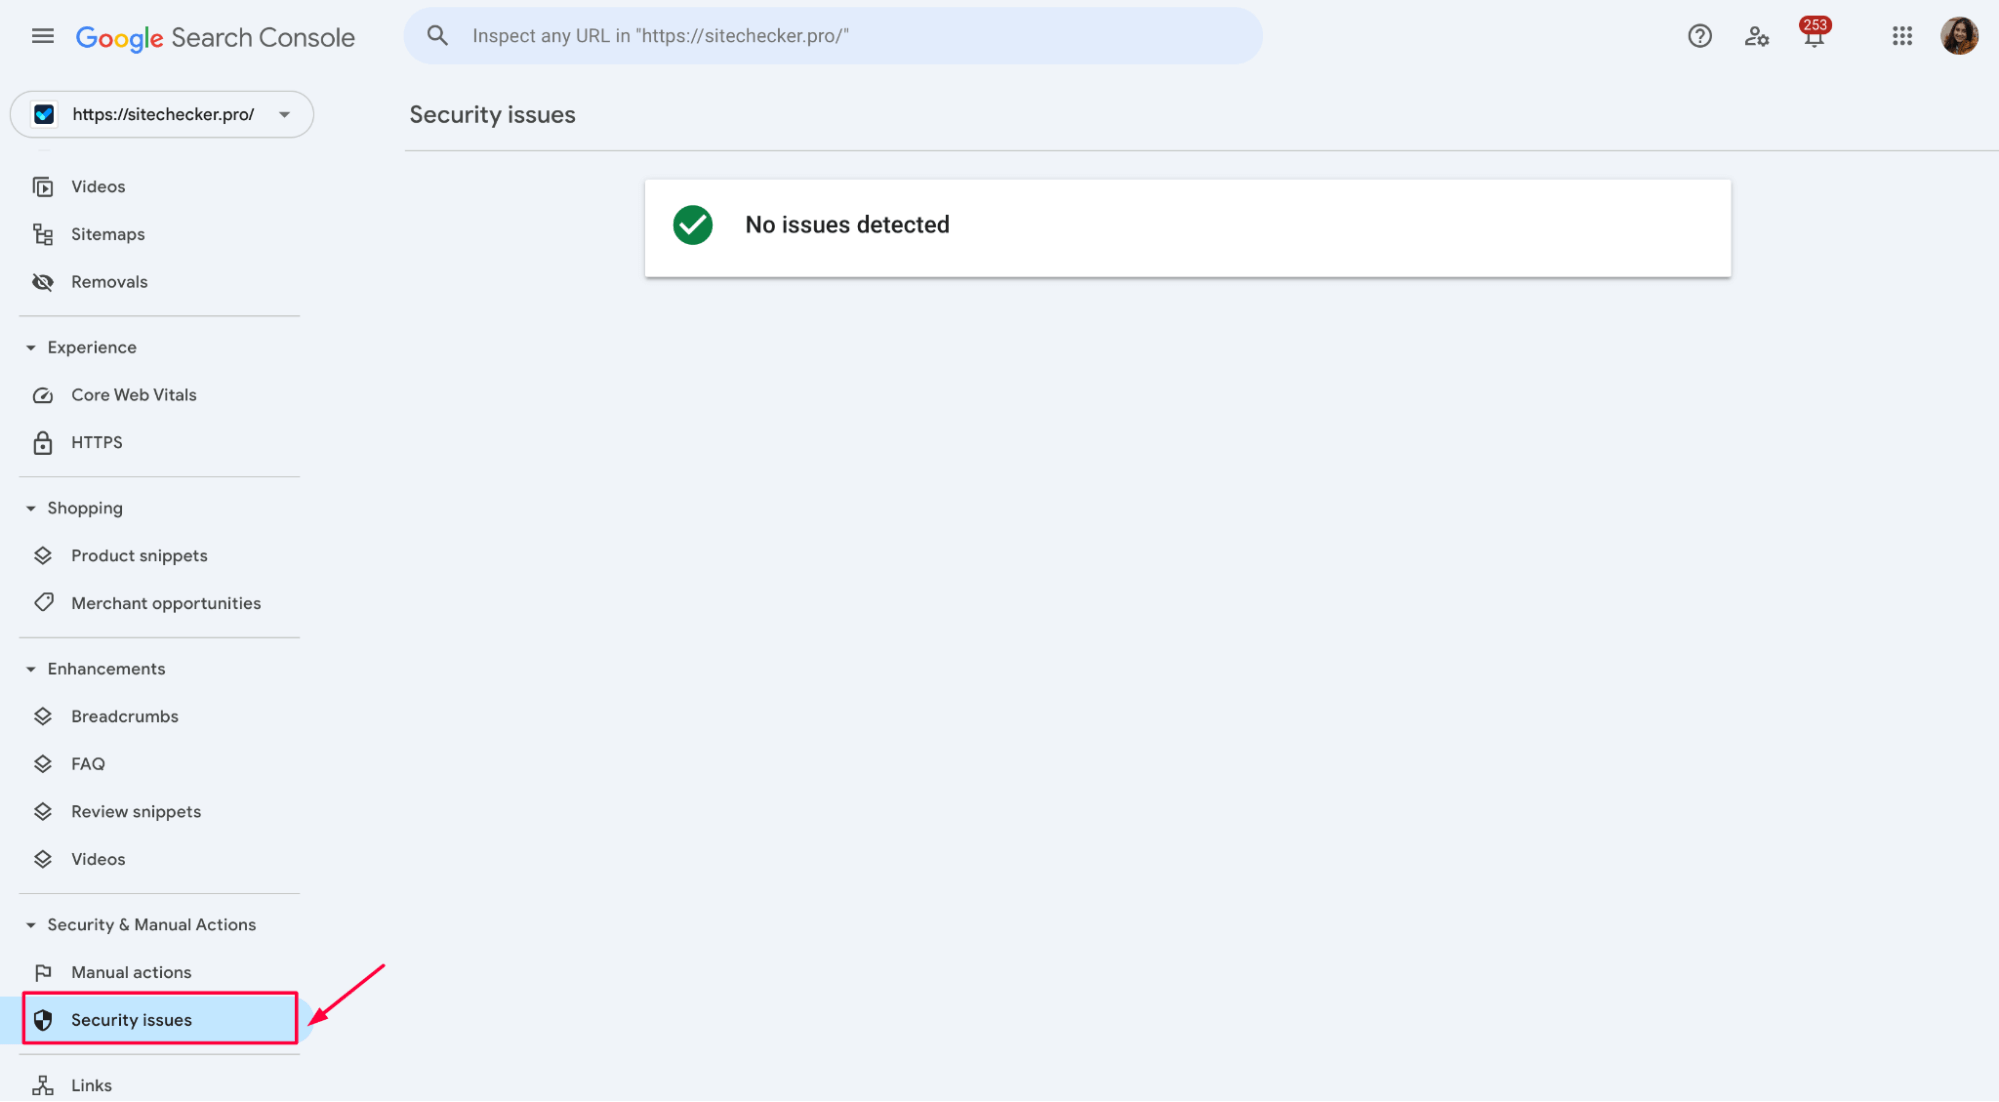
Even if you think everything’s fine, it’s smart to check this tab regularly. One unnoticed hack can kill your rankings overnight
Link report audit
Backlinks and internal links both play a major role in how your site ranks – and Google Search Console gives you a basic but useful snapshot of both. Go to Links in the sidebar to access the report.
Under External Links, you’ll see which pages are getting the most backlinks and which sites are linking to you.
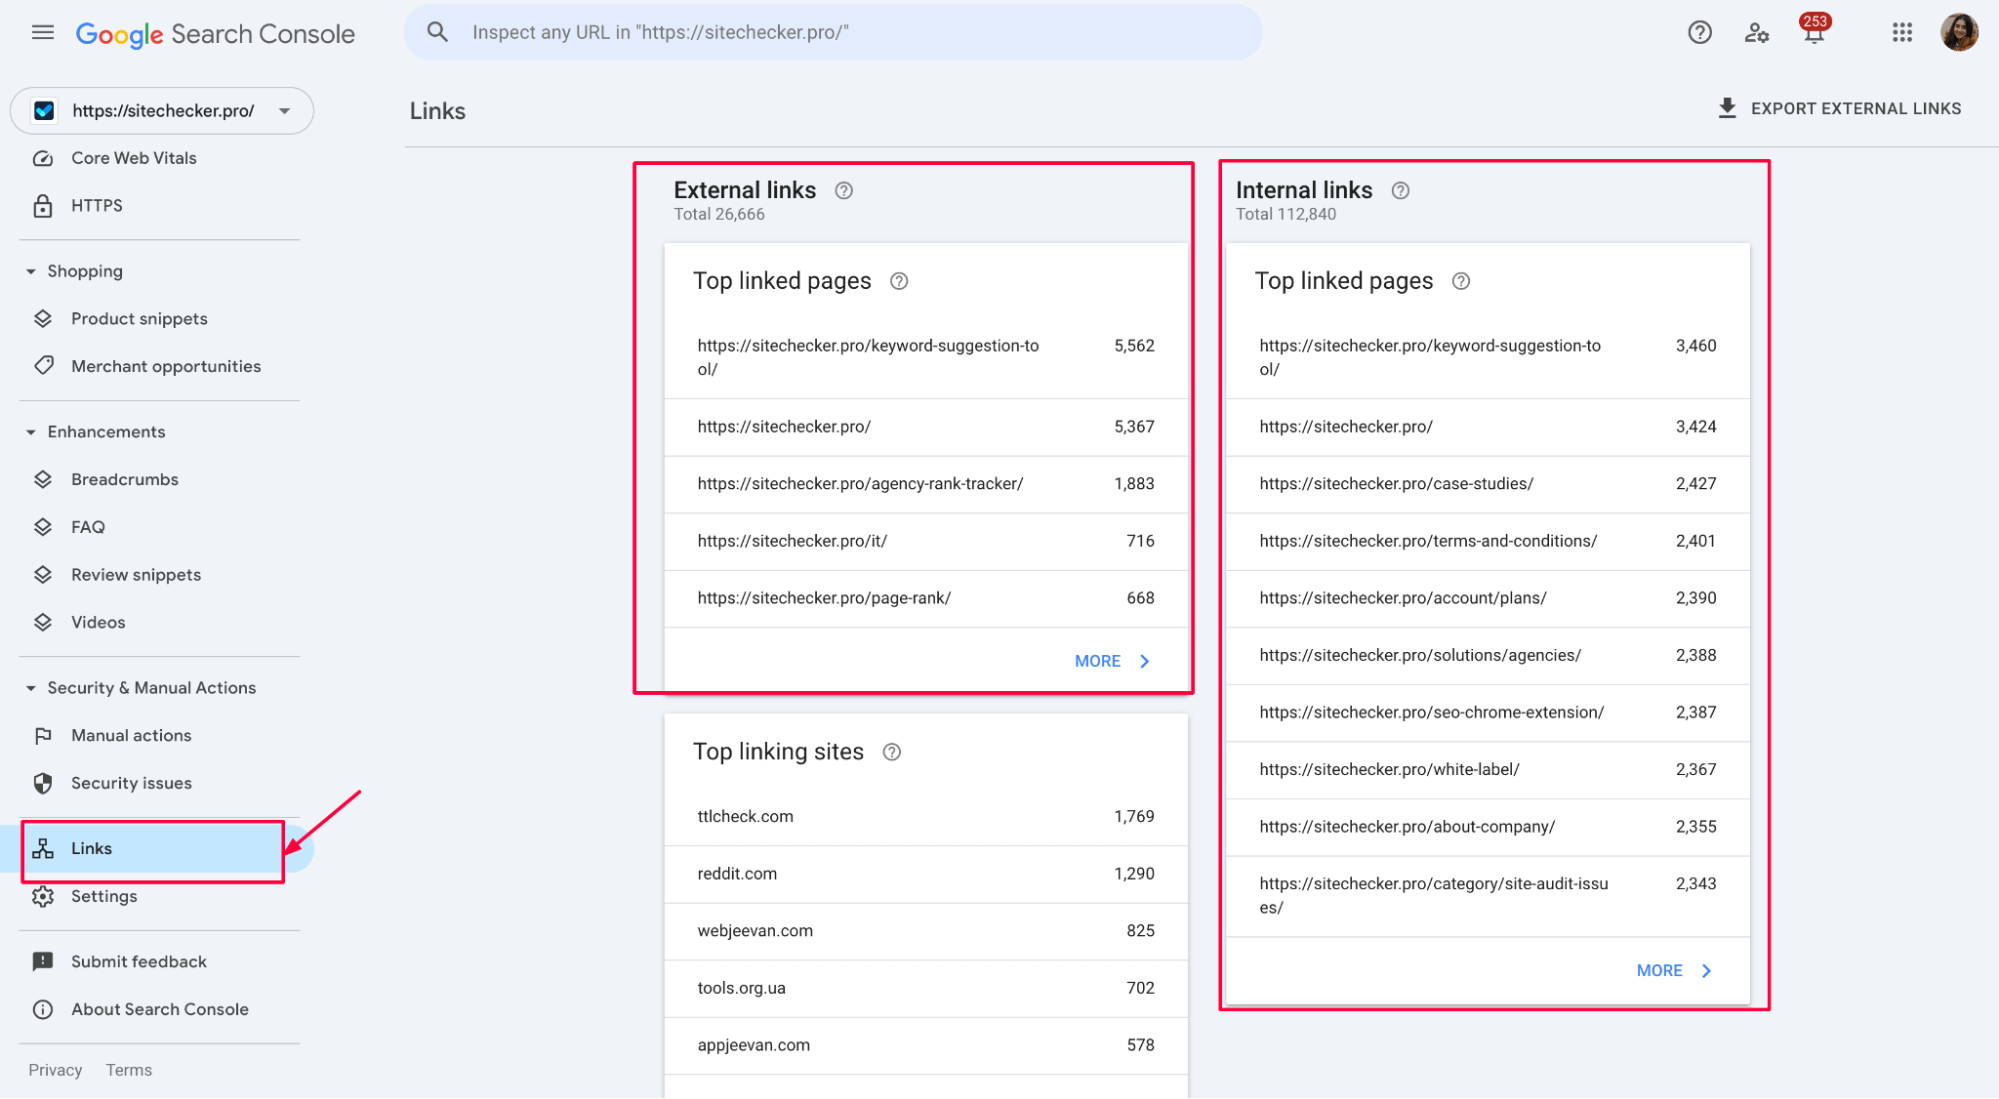
Pay attention to anchor text as well – it can reveal over-optimization or spammy patterns. While GSC won’t show you link quality, it’s a good place to spot odd trends or sudden drops.
Scroll down to Internal Links to check how your site links to itself. Make sure important pages (like service or product pages) have enough internal links pointing to them. If you see key URLs with zero internal links, that’s a missed opportunity for both SEO and crawlability.
Internal linking also helps distribute authority and keep users moving through your content – so treat it like a ranking tool, not just navigation.
Monitor progress & optimize continuously
A one-time audit isn’t enough – SEO is an ongoing process. Use GSC to track how changes you’ve made affect performance over time. Set a schedule to review key reports weekly or monthly: check indexing status:
Monitor Core Web Vitals, watch for new errors, and track keyword movements in the Performance report:

Pay close attention to trends – is traffic dropping for specific pages or queries? Did mobile usability errors appear after a design update?
Also, use the data to spot new opportunities: queries where you’re ranking just off page one, or pages with declining clicks that need fresh content.
GSC won’t give you the full picture alone, but it shows you exactly what Google sees – and that’s what makes it such a valuable tool for long-term optimization.
Automate Your SEO Audit
Check your site’s health in minutes with smart, GSC-aligned SEO tests.
Pro tips & final thoughts
Remember, Google Search Console isn’t a crawler – it doesn’t simulate a crawl like third-party tools do. It shows you what Googlebot actually experiences on your site, which makes it incredibly reliable for diagnosing real-world issues.
Also, don’t overlook the Crawl Stats report under Settings. While GSC isn’t a crawler in the traditional sense, this section shows you actual crawling activity from Googlebot – how often it hits your pages, how much data it downloads, and how your server responds.
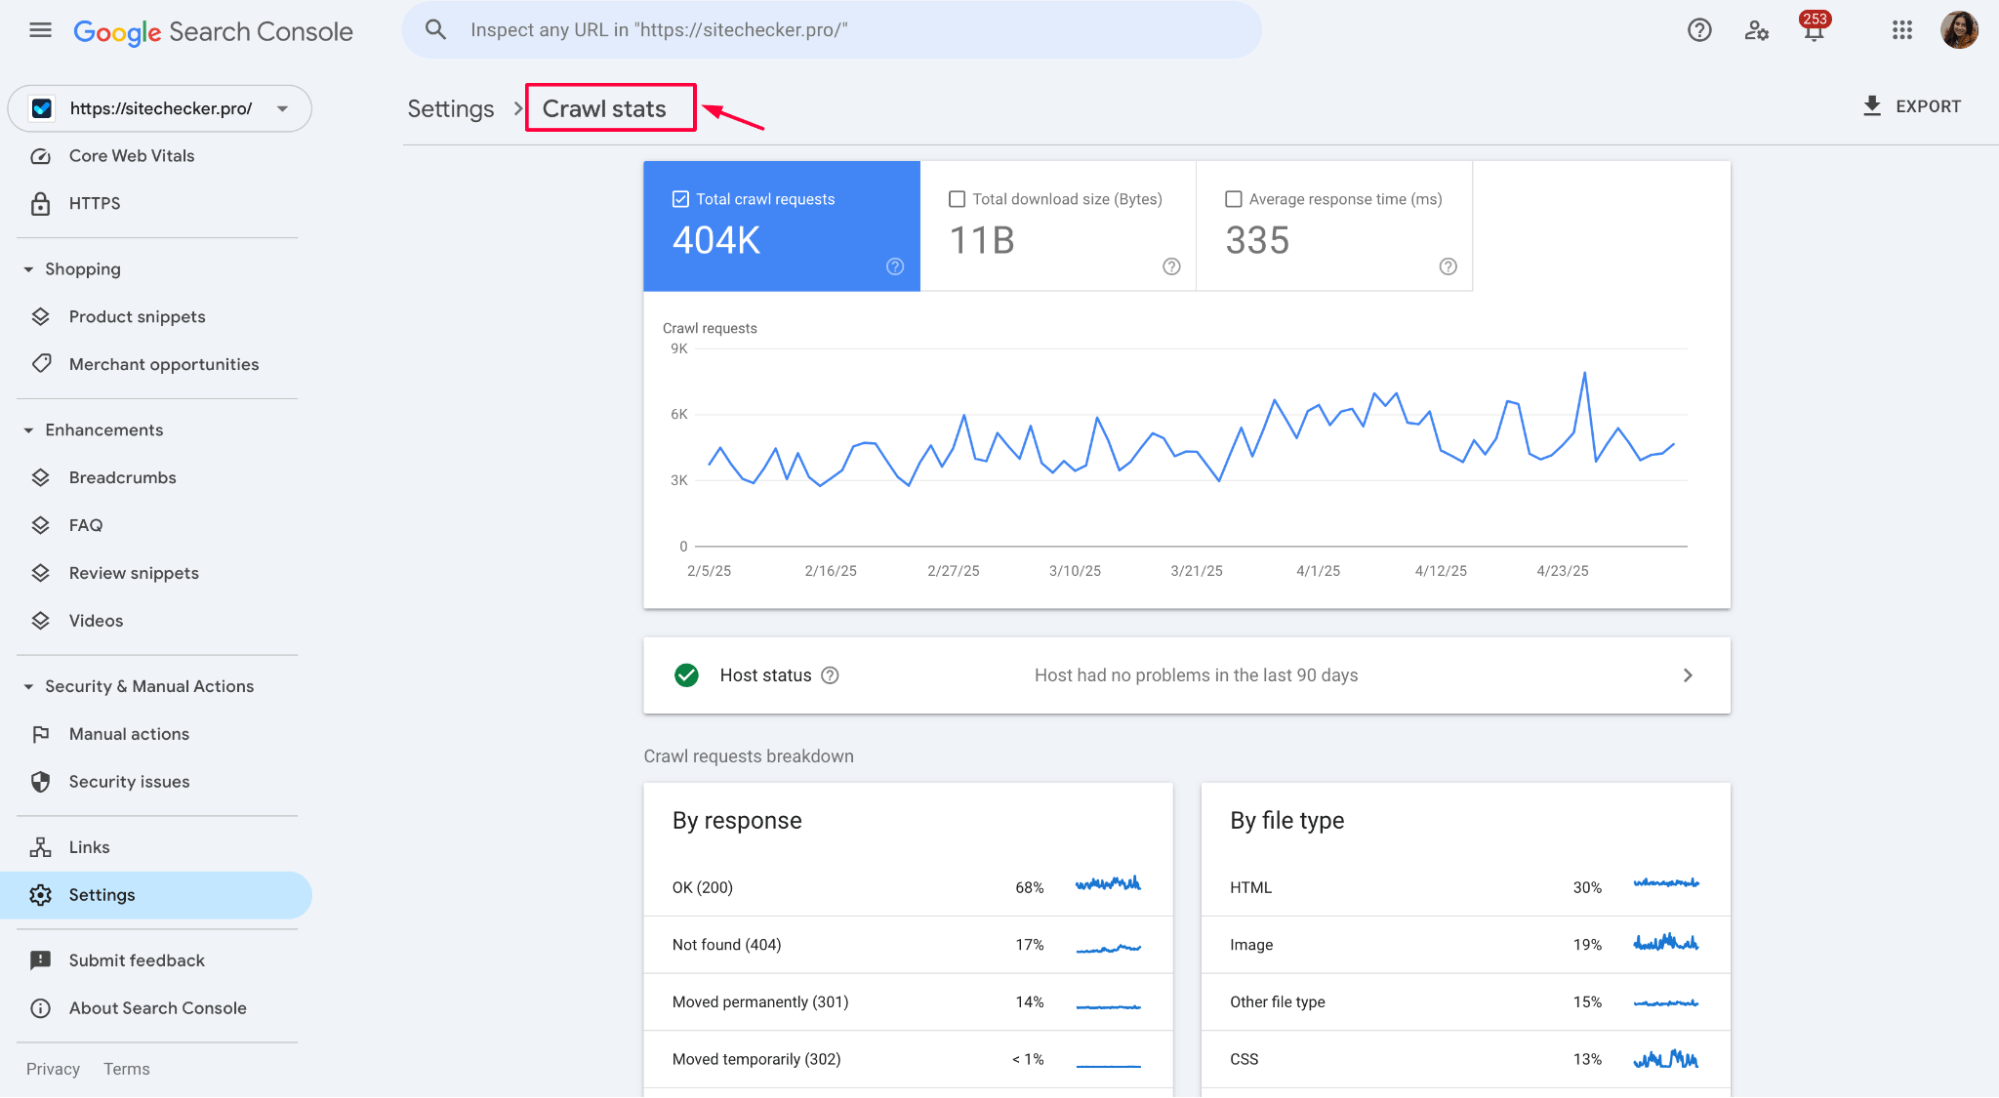
You can spot issues like frequent 404s, slow response times, or unnecessary crawls on non-HTML resources. It’s a great way to see if your site is crawl-efficient and whether any technical barriers are slowing things down.
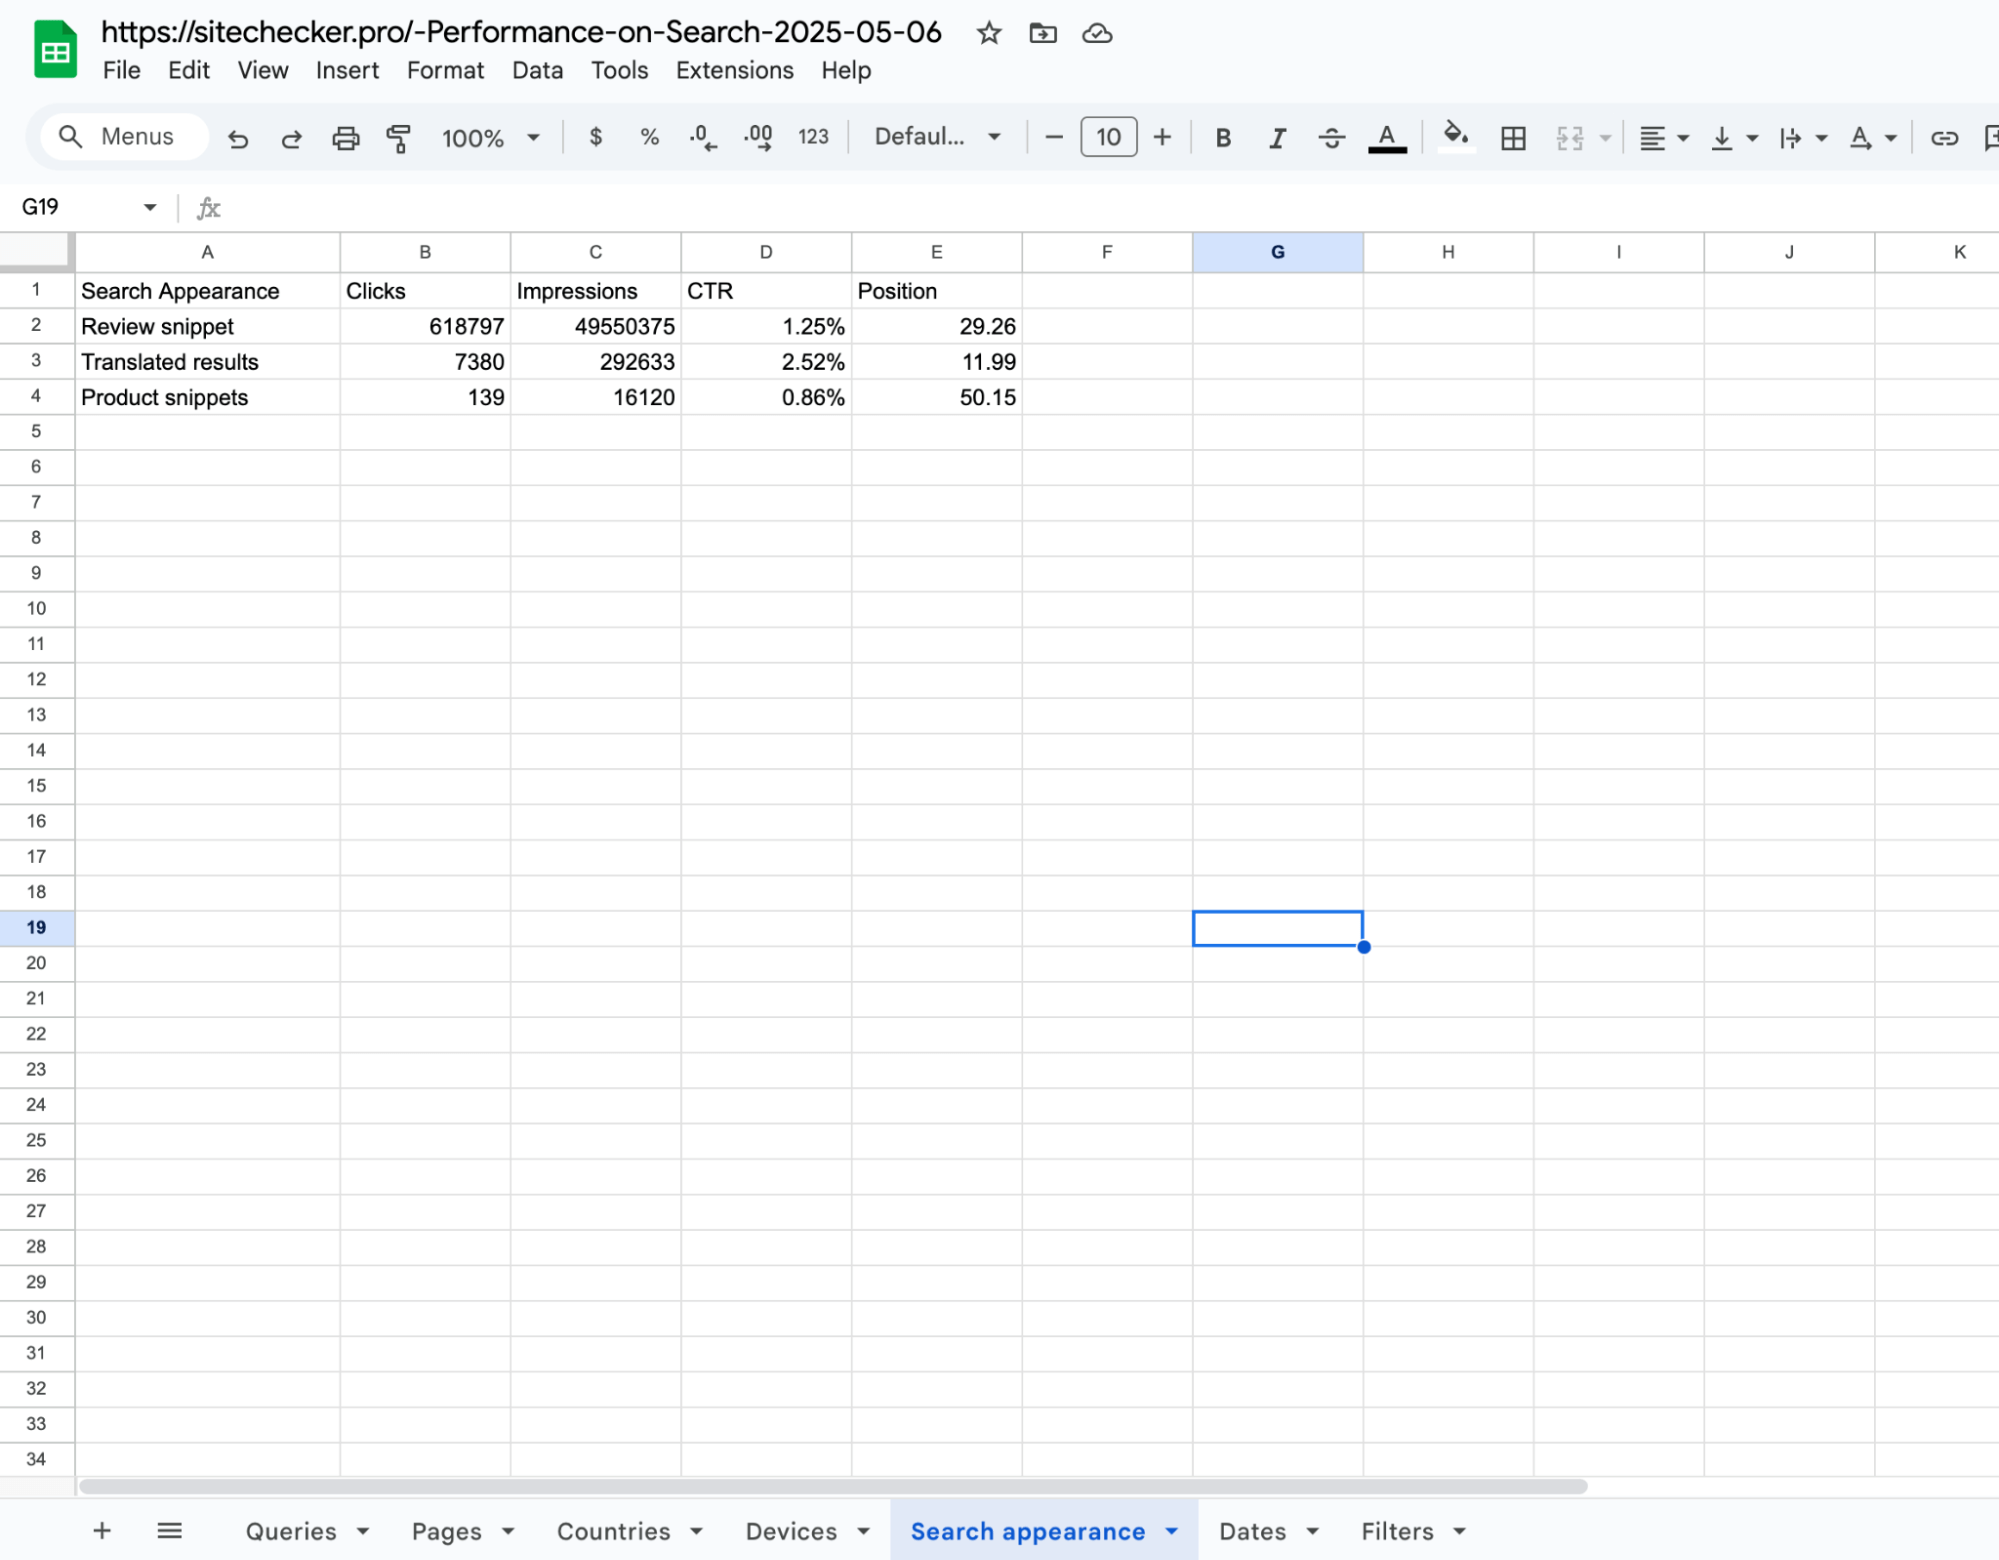
Take advantage of data exports to create custom reports or dashboards in tools like Google Sheets, Looker Studio, or Excel. If you’re building those custom reports in Google Sheets or Excel, you can reduce manual exports by syncing Google Search Console data directly into your spreadsheet with Coefficient Data Connector.
This keeps your tables and dashboards up to date, so the same dataset stays ready for analysis and stakeholder reporting. This makes it easier to spot patterns, track progress, and share findings with stakeholders.
If you work with a team or clients, don’t keep the insights to yourself. Walk them through the key reports, explain what the metrics mean, and show how they connect to business goals. GSC is often underused simply because people don’t understand how to read it.
Lastly, let the data guide your content and SEO strategy. You’ll find out what’s ranking, what’s missing, and what needs fixing – all from the same place. Use it regularly, and it becomes one of the most dependable tools in your SEO toolkit.


 Error")