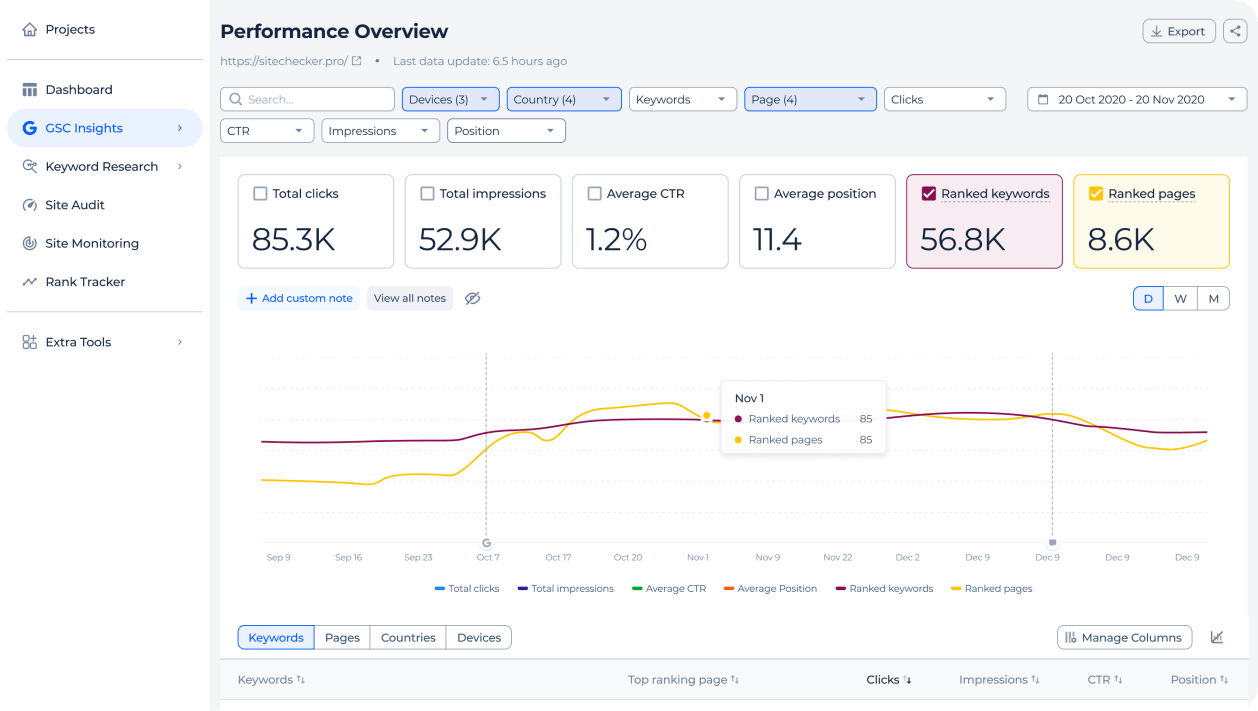
Google Search Console Dashboard
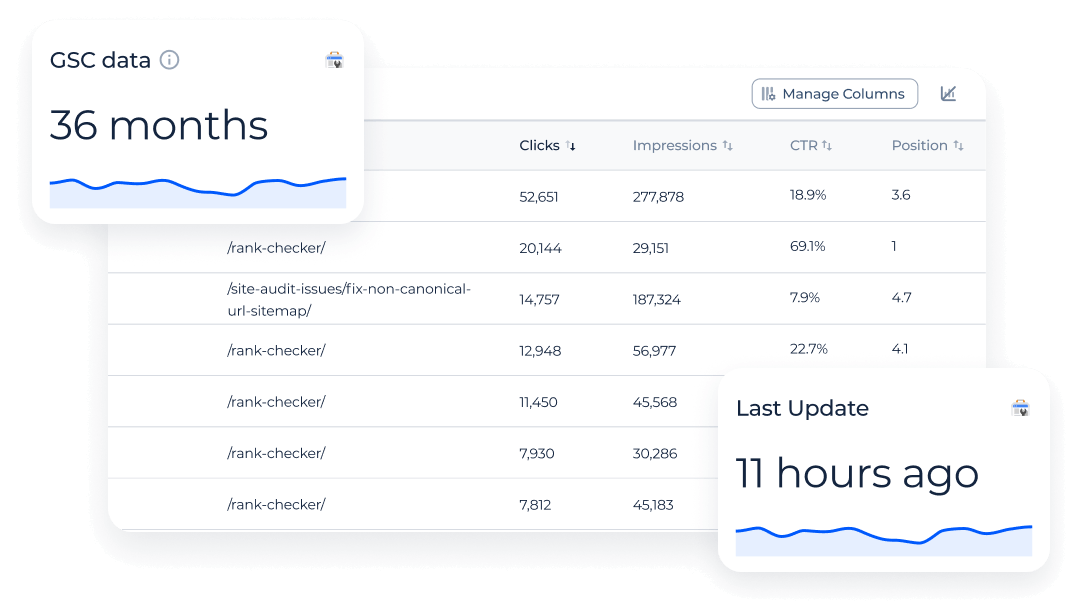
Analyze up to 36 months of Google Search Console data with no 1,000-row limit. Filter keywords and pages, create segments, and compare performance.
Unlimited data
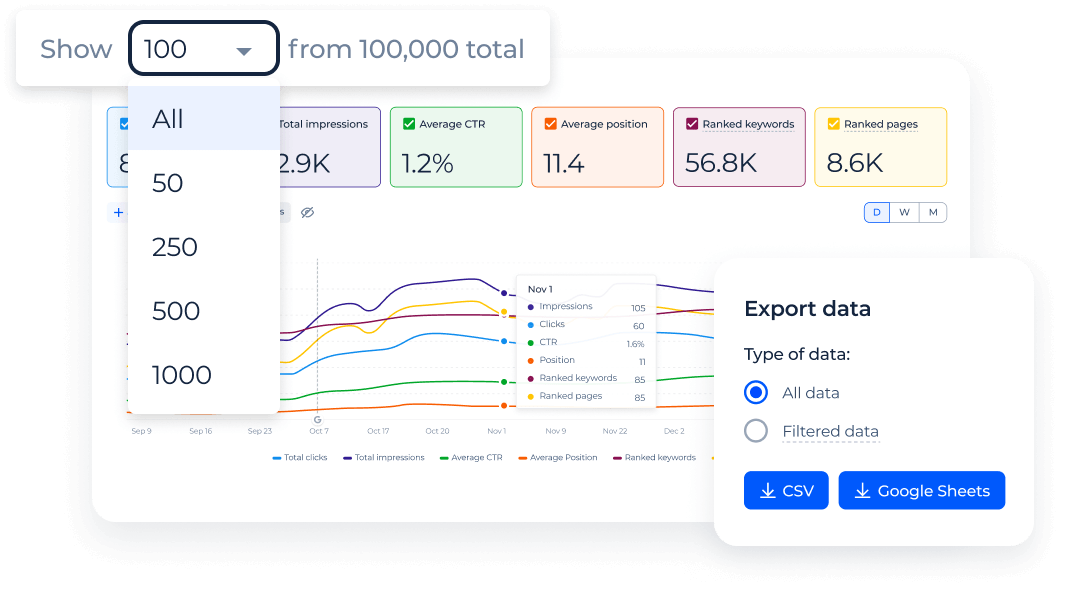
Access all your GSC data with no 1,000-row cap. Export in seconds - no API, no setup, no limits.
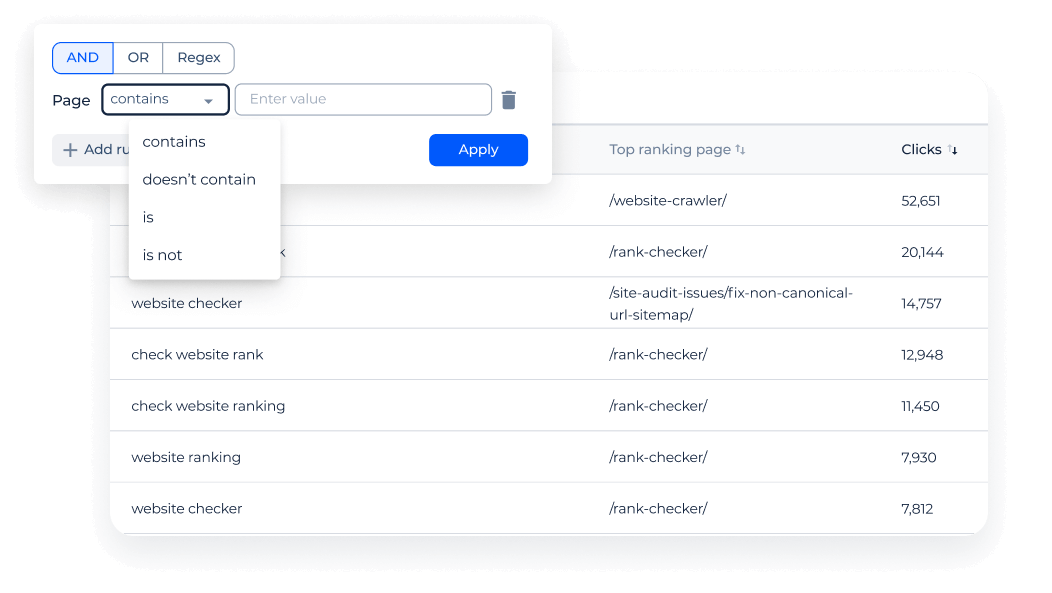
Flexible filtering
Filter keywords or pages with up to 10 rules using AND/OR logic. Use “contains,” regex, or metric ranges like CTR, impressions, or position.
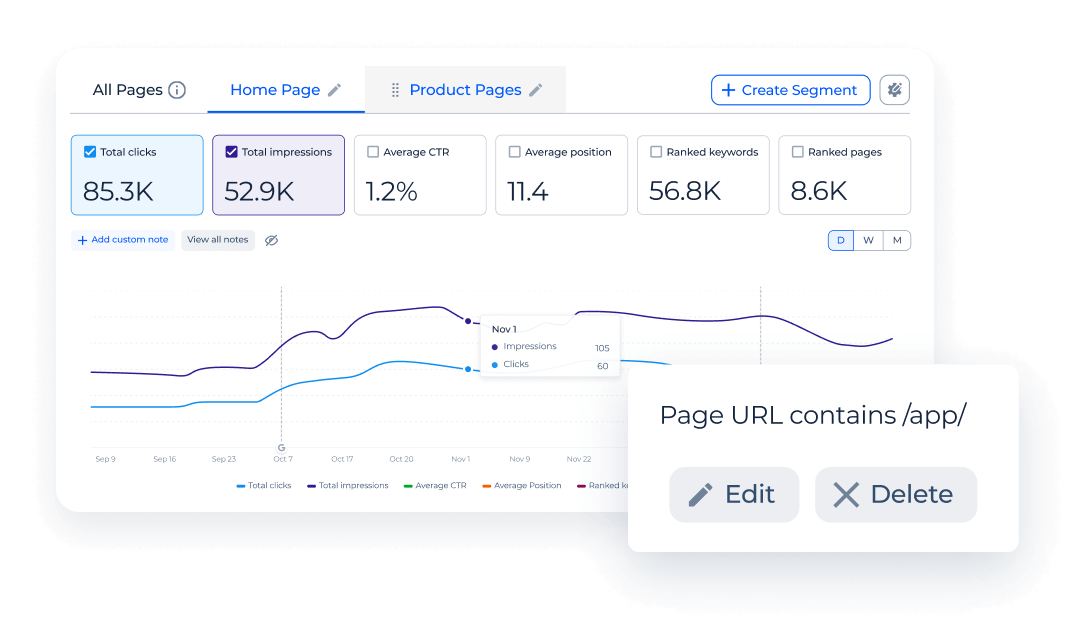
Segments overview
Group pages into segments via URLs or auto-setup. Track performance and see each segment’s share of total clicks, impressions, and rankings.
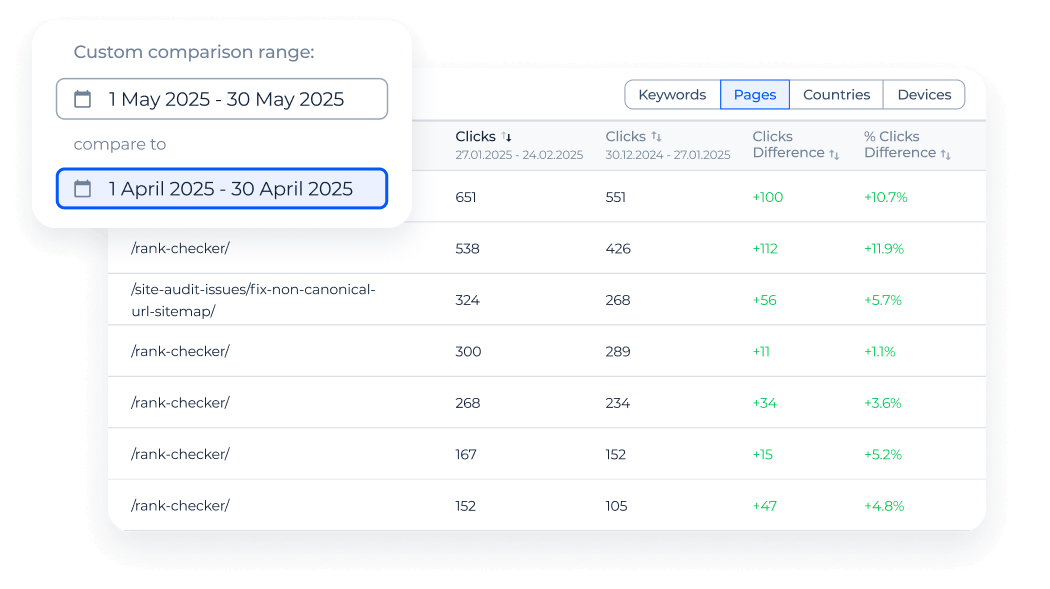
Data comparison
Compare search metrics, keywords, and pages across two periods. Spot absolute and % changes in one clear chart.
Extended data history
Access up to 36 months of data for long-term analysis - no API or manual backups needed.
Most powerful features of GSC dashboard
Unlimited data
Skip the 1,000-row limit in GSC. Get full access to your data without setting up API, Looker Studio, or BigQuery. Export everything in seconds - no caps.
Extended data history
GSC provides up to 16 months of data - which can limit long-term analysis. Our dashboard automatically stores historical data, giving you access to up to 36 months for measuring performance over time. No API setup or manual backups required.
Data comparison
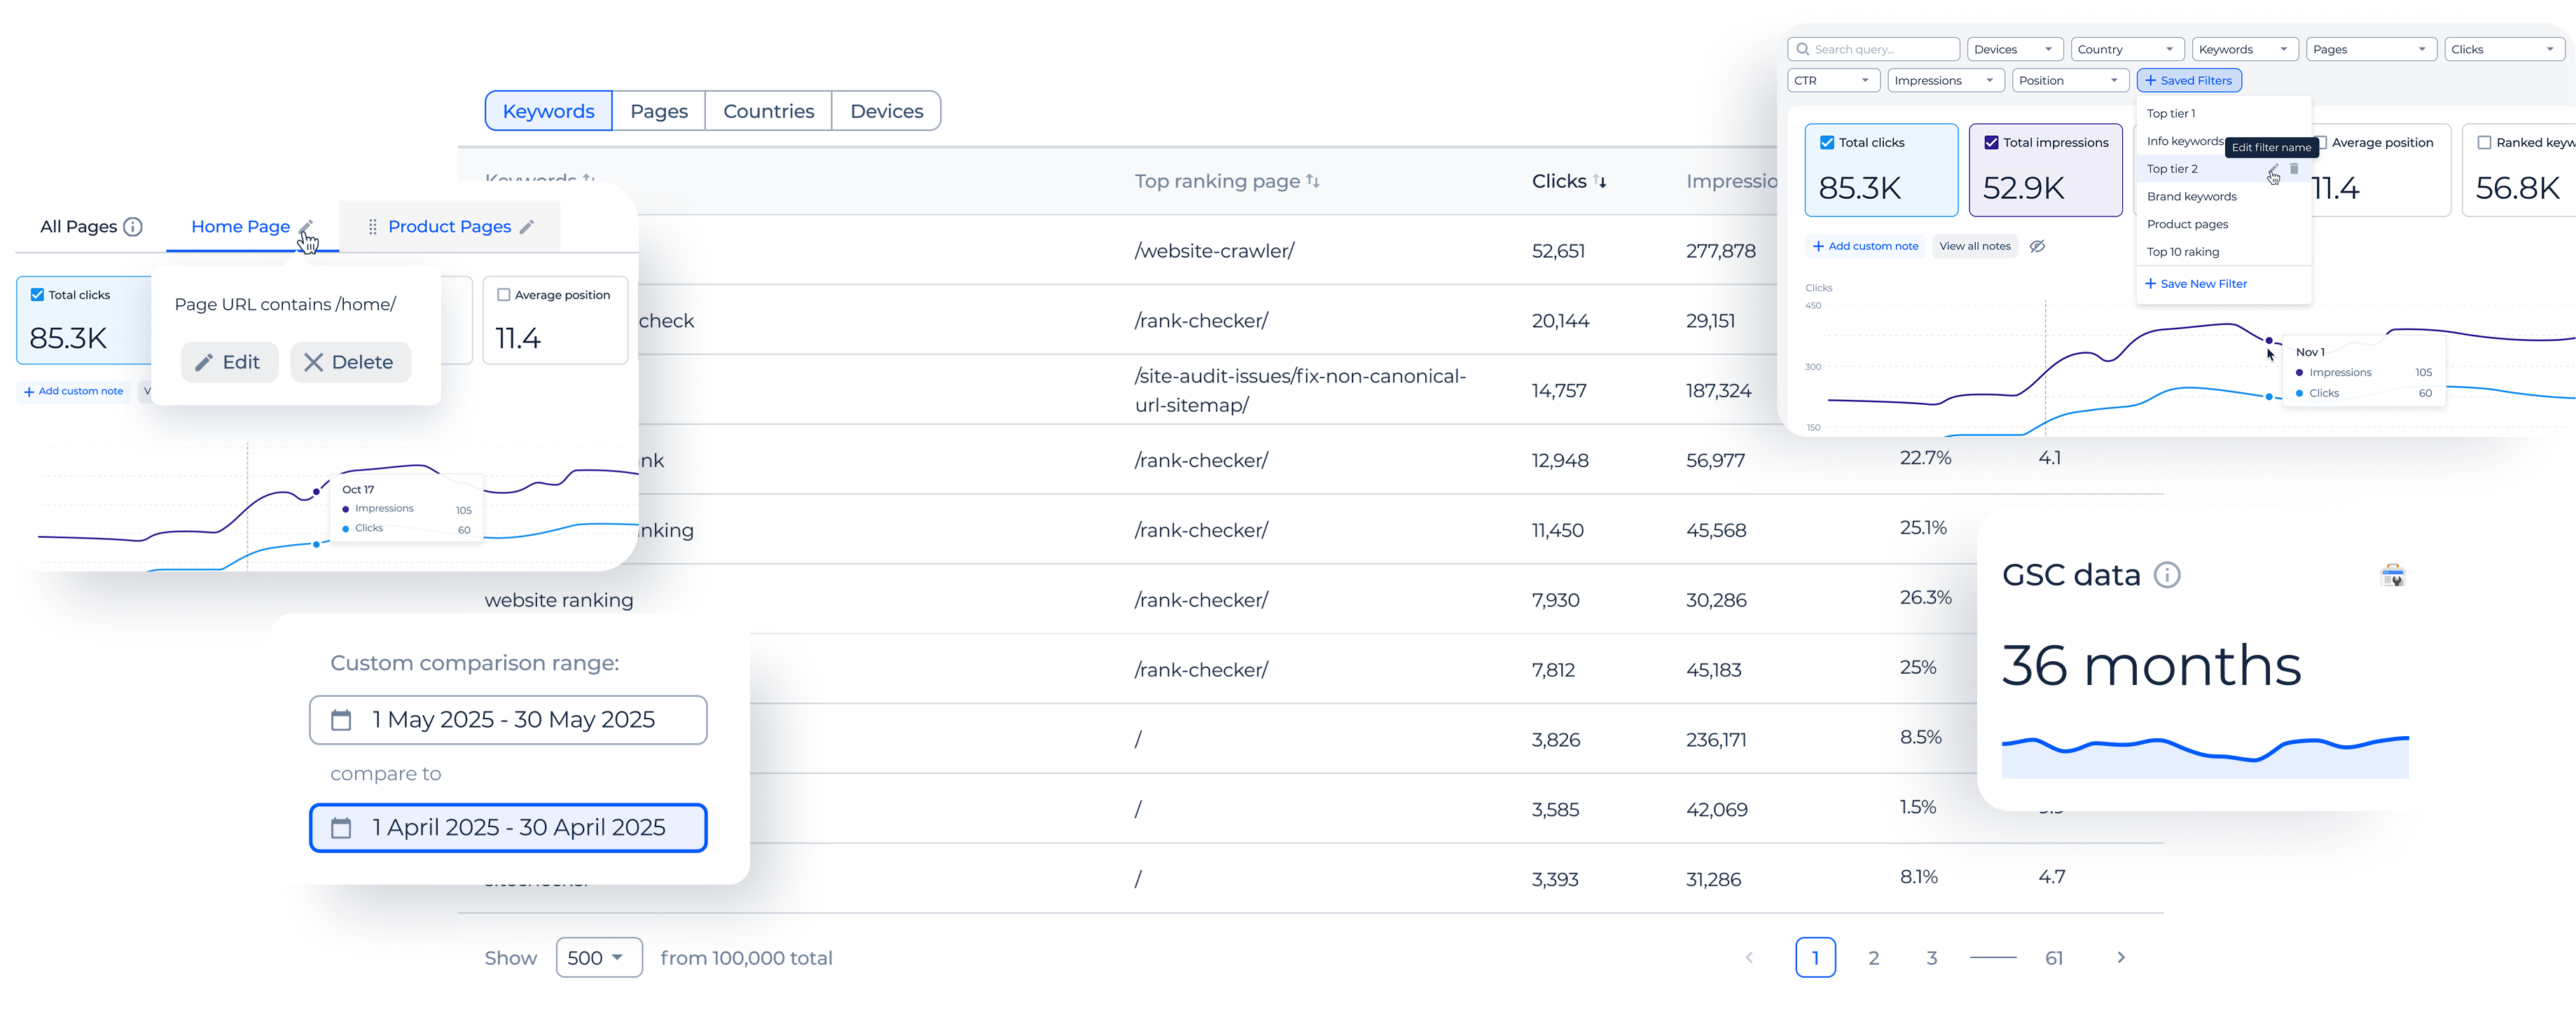
Compare search metrics, ranked keywords, and pages between two custom time periods. See both absolute and percentage changes. All metrics are visualized on a single chart, making it easy to evaluate SEO impact after website updates or algorithm changes.
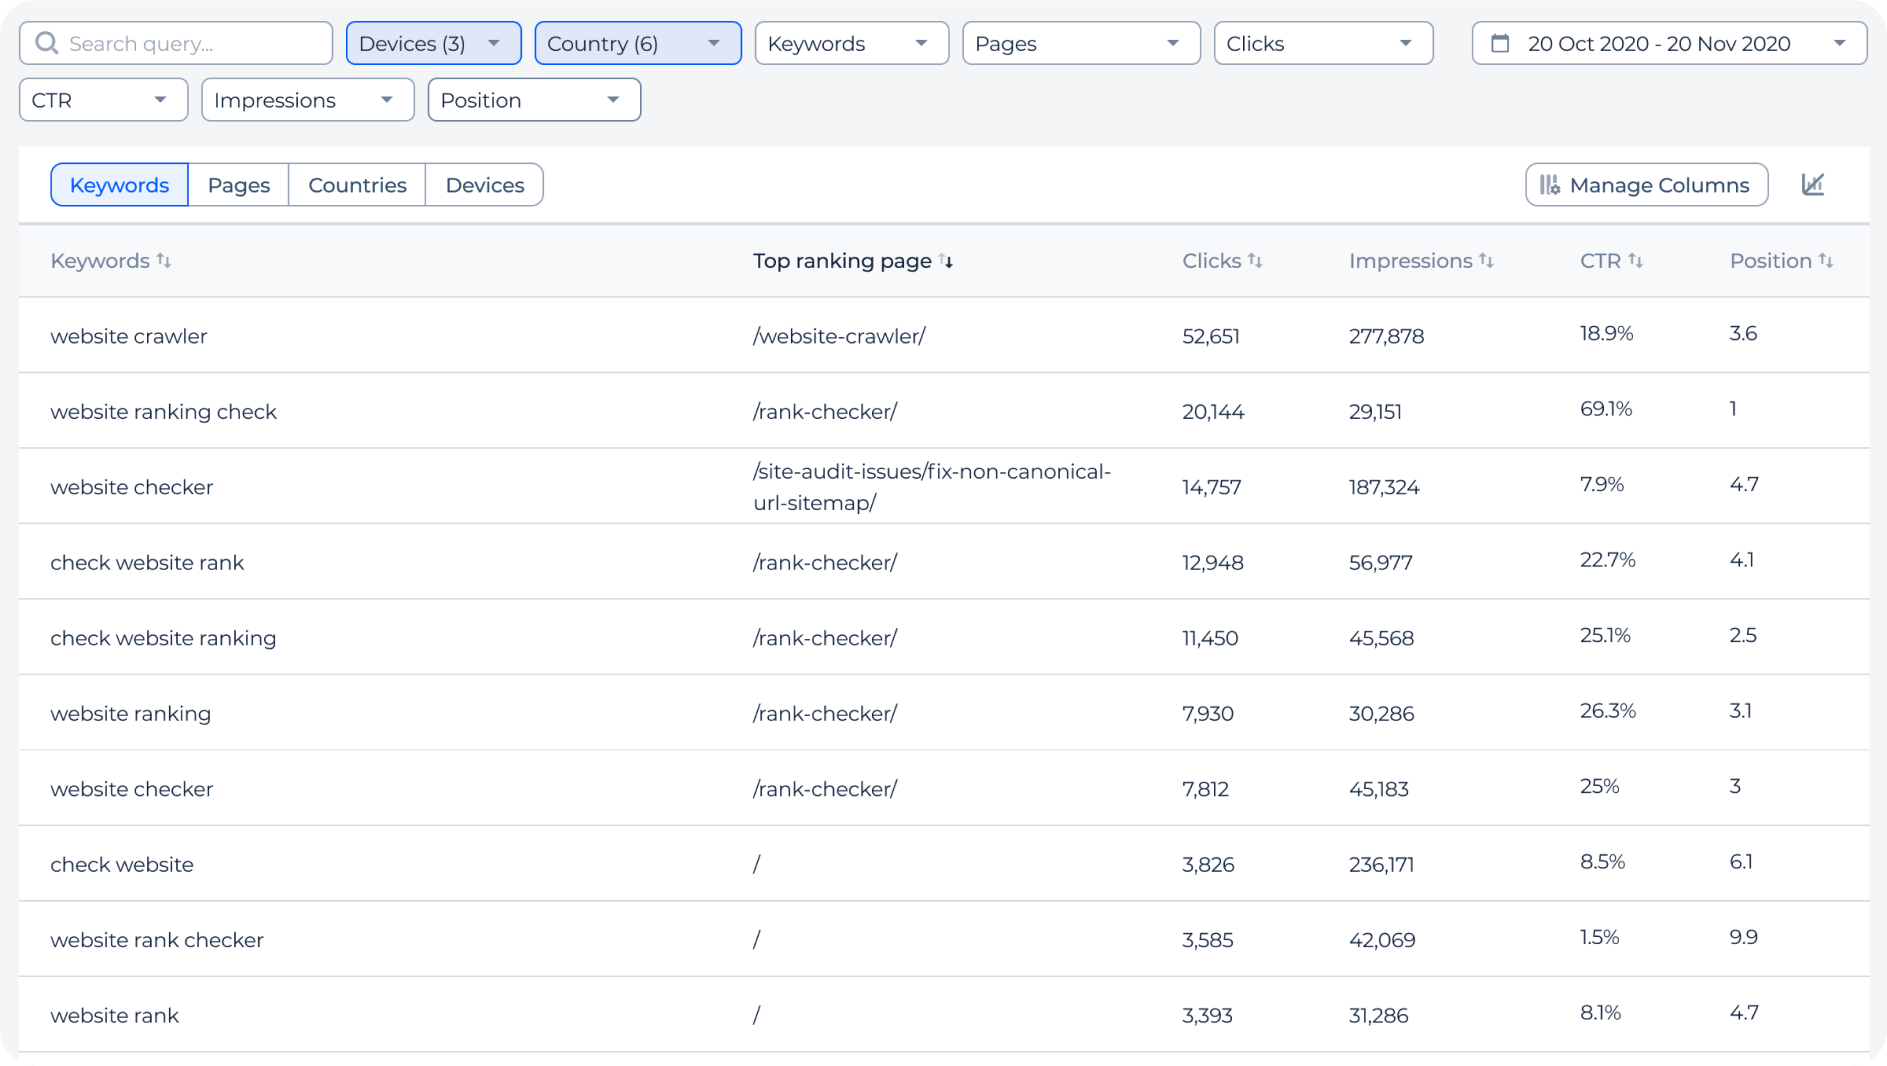
Flexible filtering system
Apply up to 10 rules to filter keywords or pages at once. Combine them with AND or OR logic. Use conditions like “contains,” “doesn’t contain,” or regex. Filter by position, impressions, or CTR ranges to narrow down exactly what matters.
Segments overview
Create page segments using URL lists, rules, or auto-setup based on your site structure. Track search metrics for each segment and compare their performance over time. See what share of total clicks, impressions, and ranked pages each segment contributes.
Google webmaster dashboard features
Ranked pages & keywords count
See how many of your pages and keywords appear in Google search - and how that number changes over time. Our dashboard shows this trend clearly on one chart.
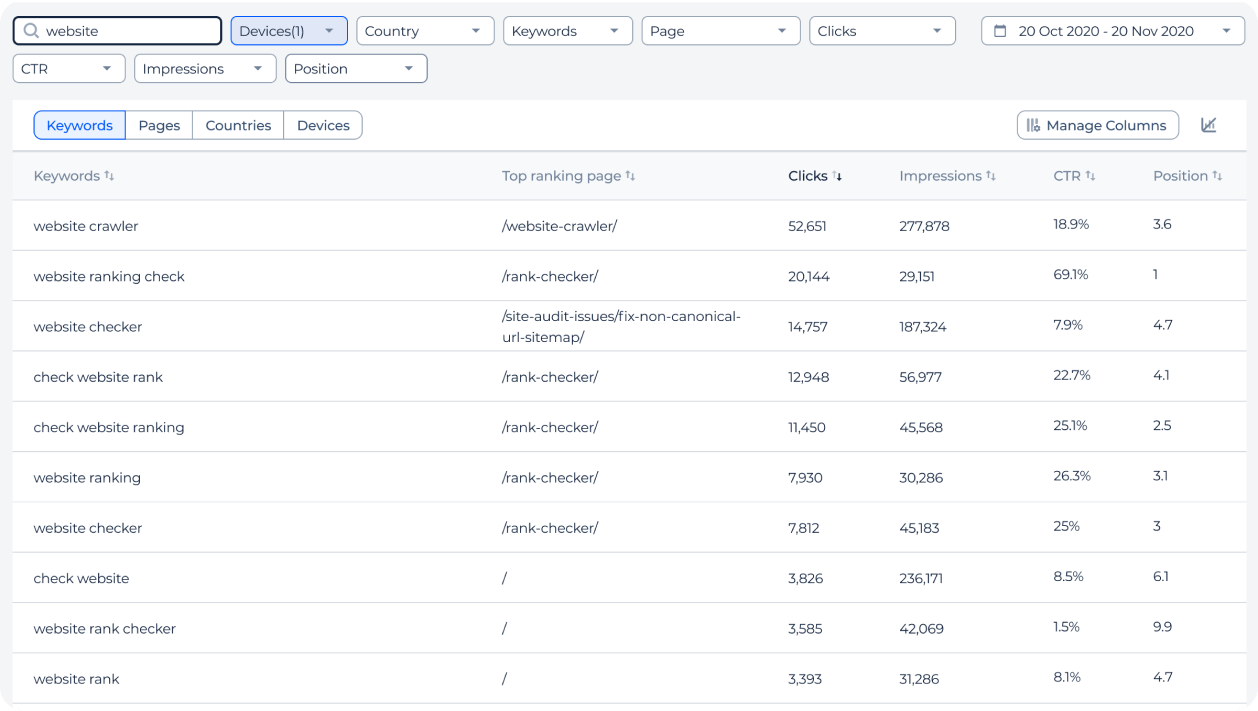
Quick search
Find keywords or pages instantly with a quick search feature. The search adapts to applied filters and works within the filtered results.
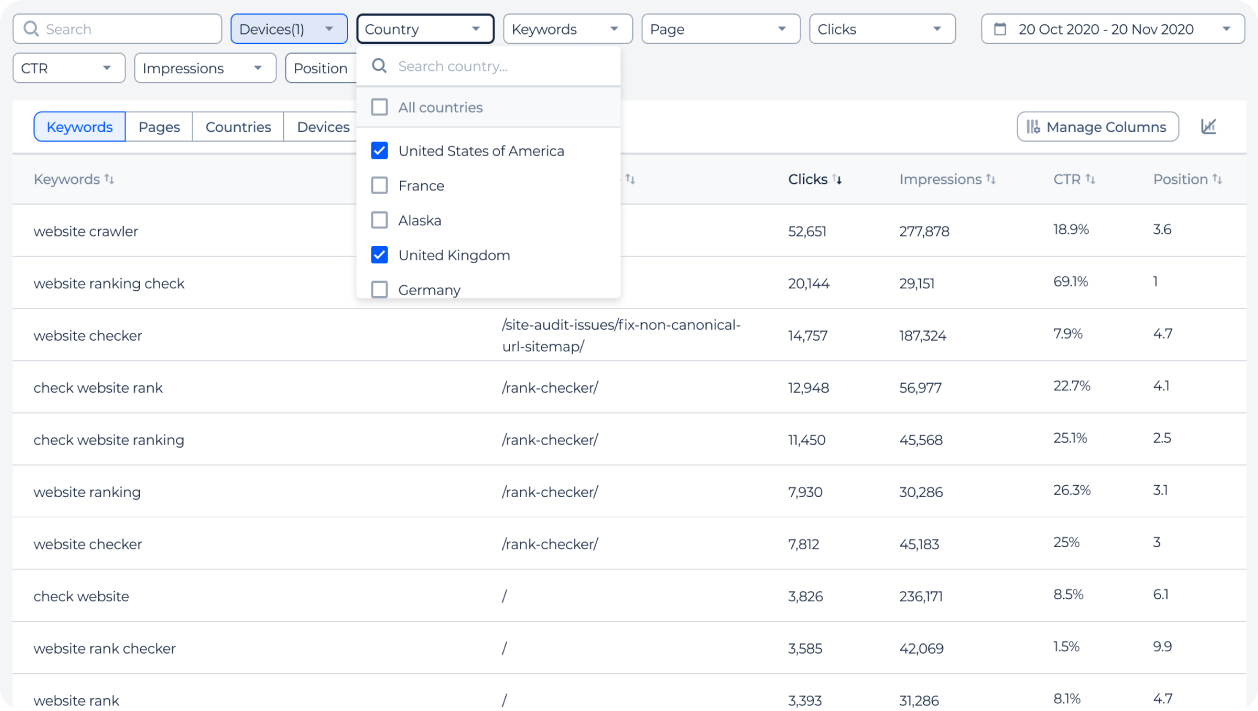
Country & device filters
Analyze traffic across multiple countries and devices in one view - no single-filter limits like in GSC. Combine regions and platforms, like “US + Canada on mobile,” in a few clicks.
Search metrics filtering
Filter keywords and pages by CTR, impressions, clicks, or position using custom ranges. Set up your filters once and reuse anytime with a single click.
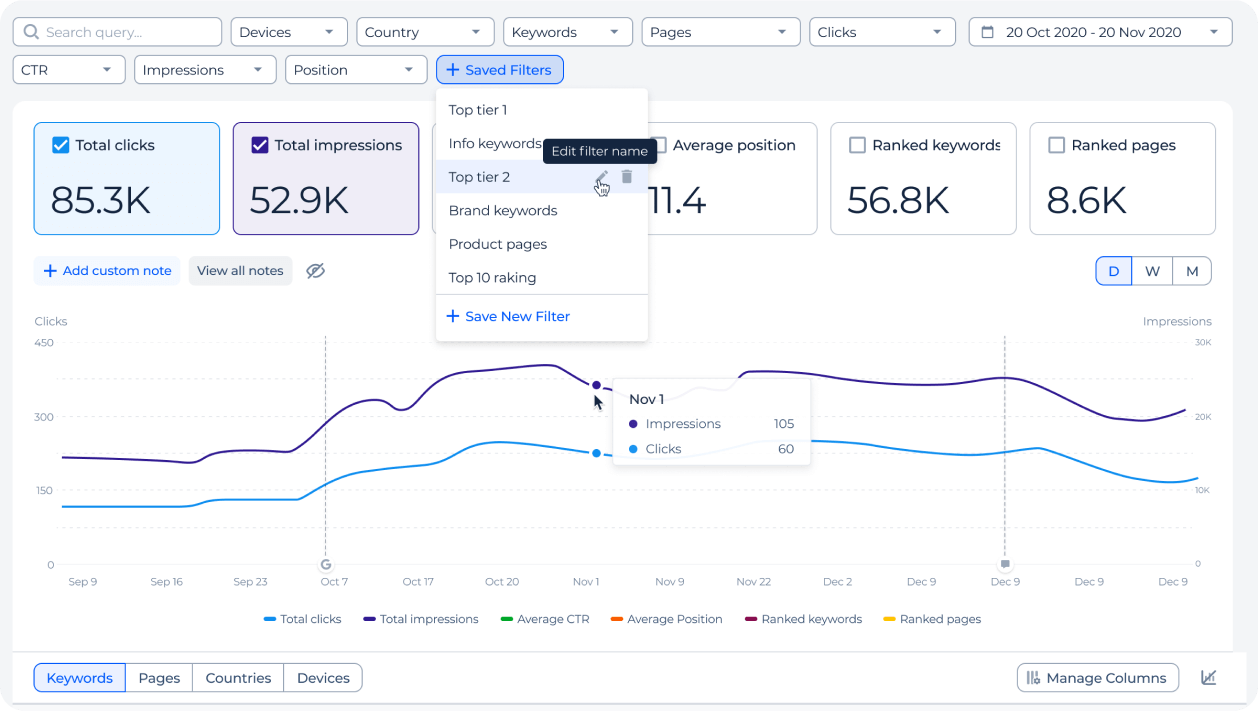
Chart annotations
Add custom notes and see Google updates right on the chart to track what affected performance. Switch between daily, weekly, or monthly views to spot trends clearly over time - all in one place.
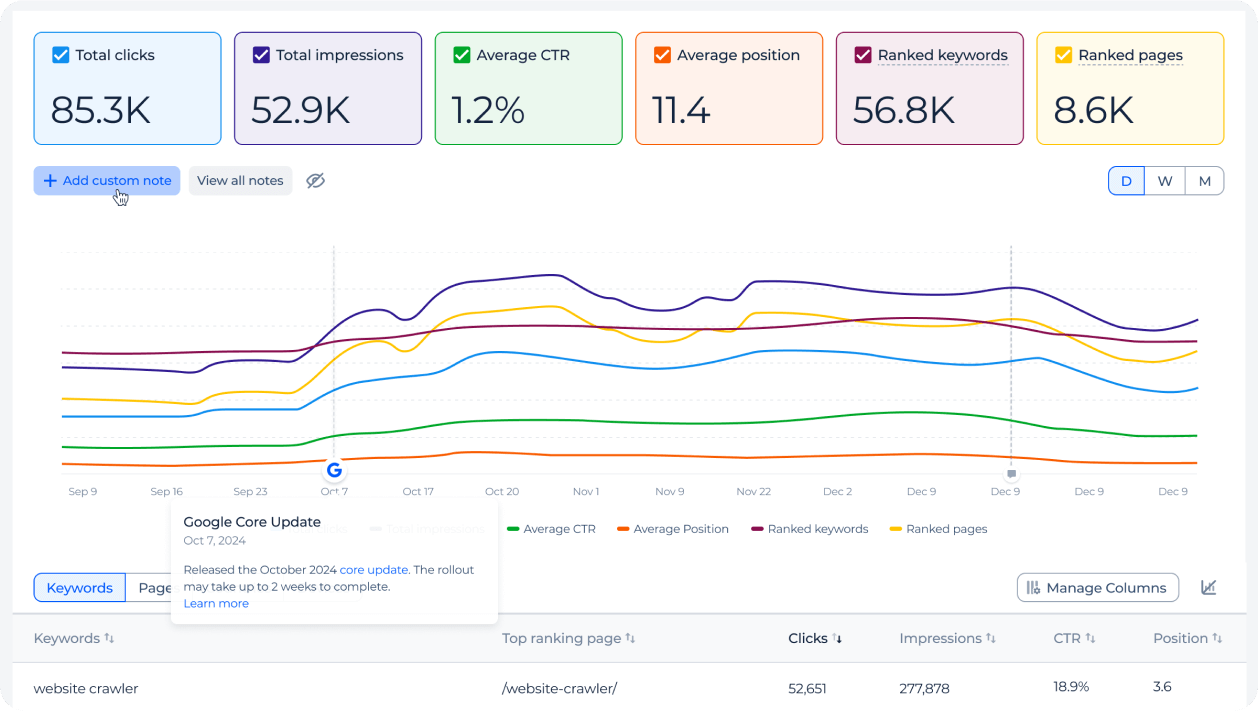
Top ranking keyword & page
See the page that ranks best for each keyword - and the keyword driving the most clicks to each page. No need to switch tabs or apply filters - both are shown instantly in one table.
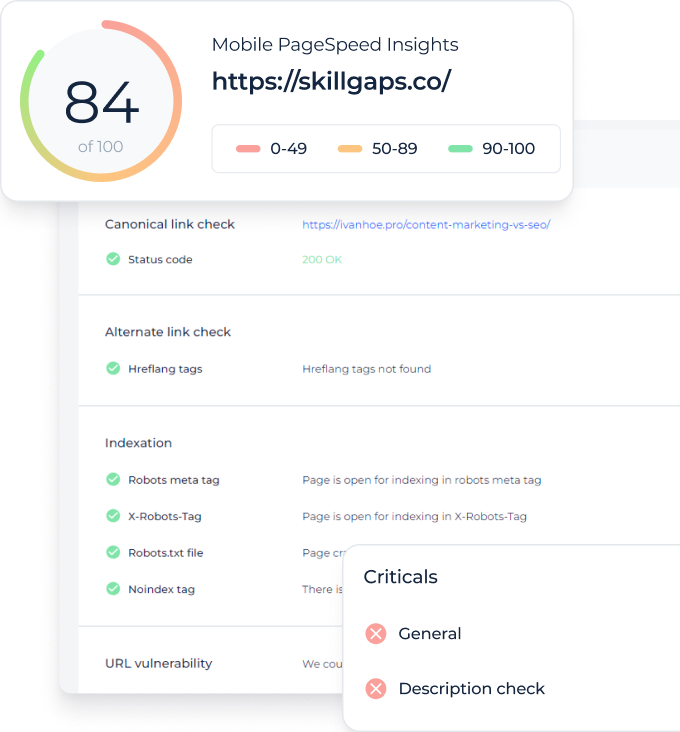
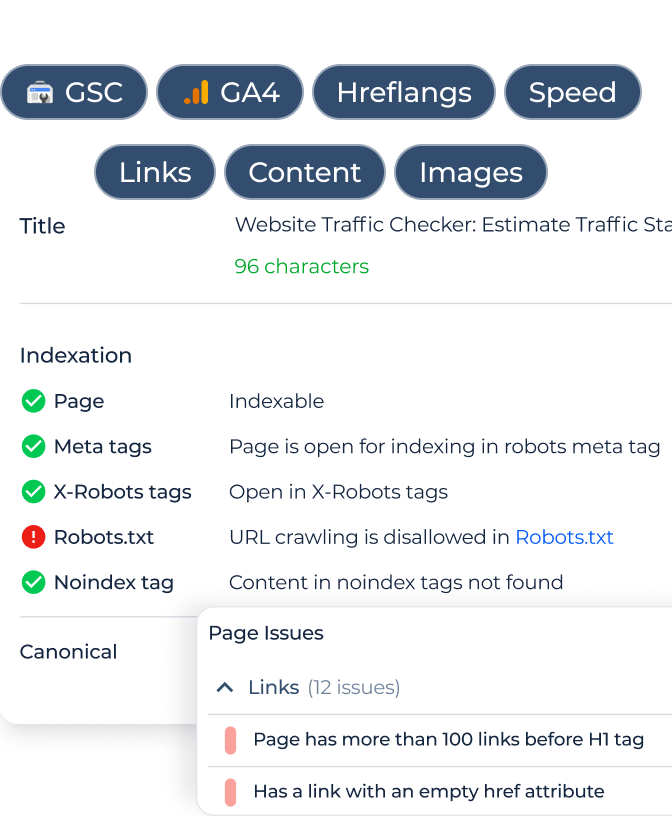
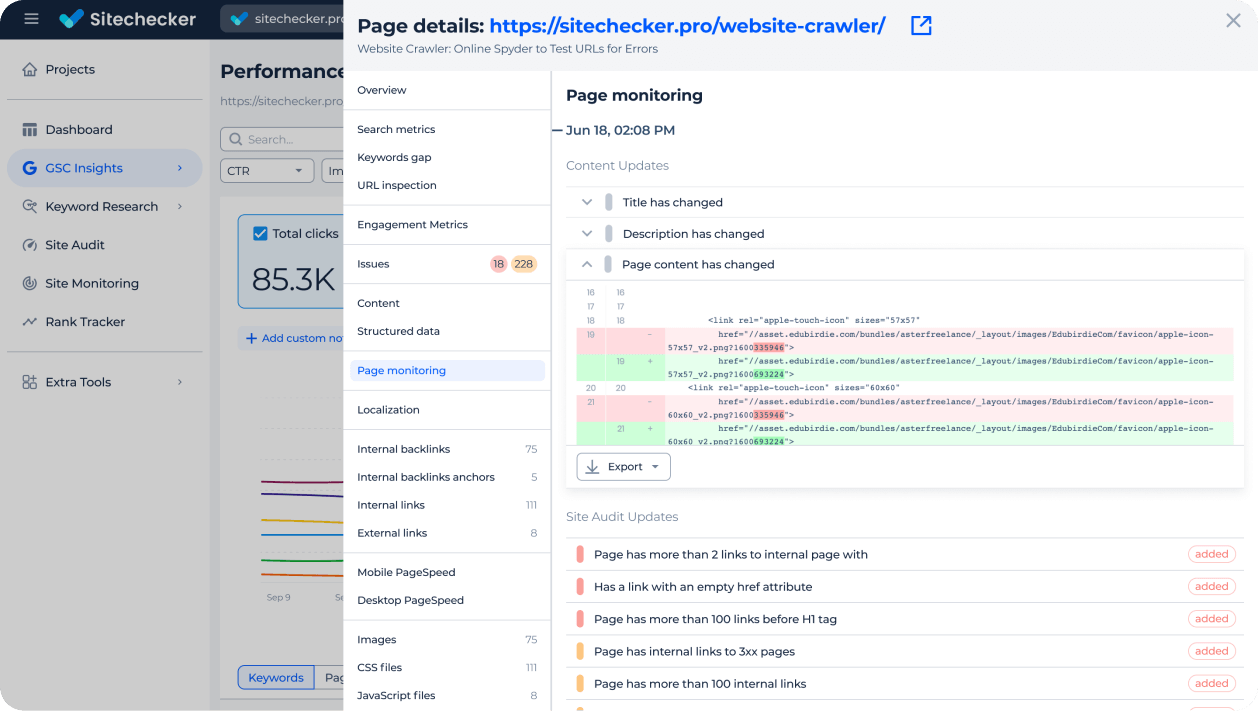
One page SEO audit
Get a full SEO audit for any URL. Spot critical issues and warnings in one place, right inside the dashboard. View content, structured data, links, images, speed, and more.
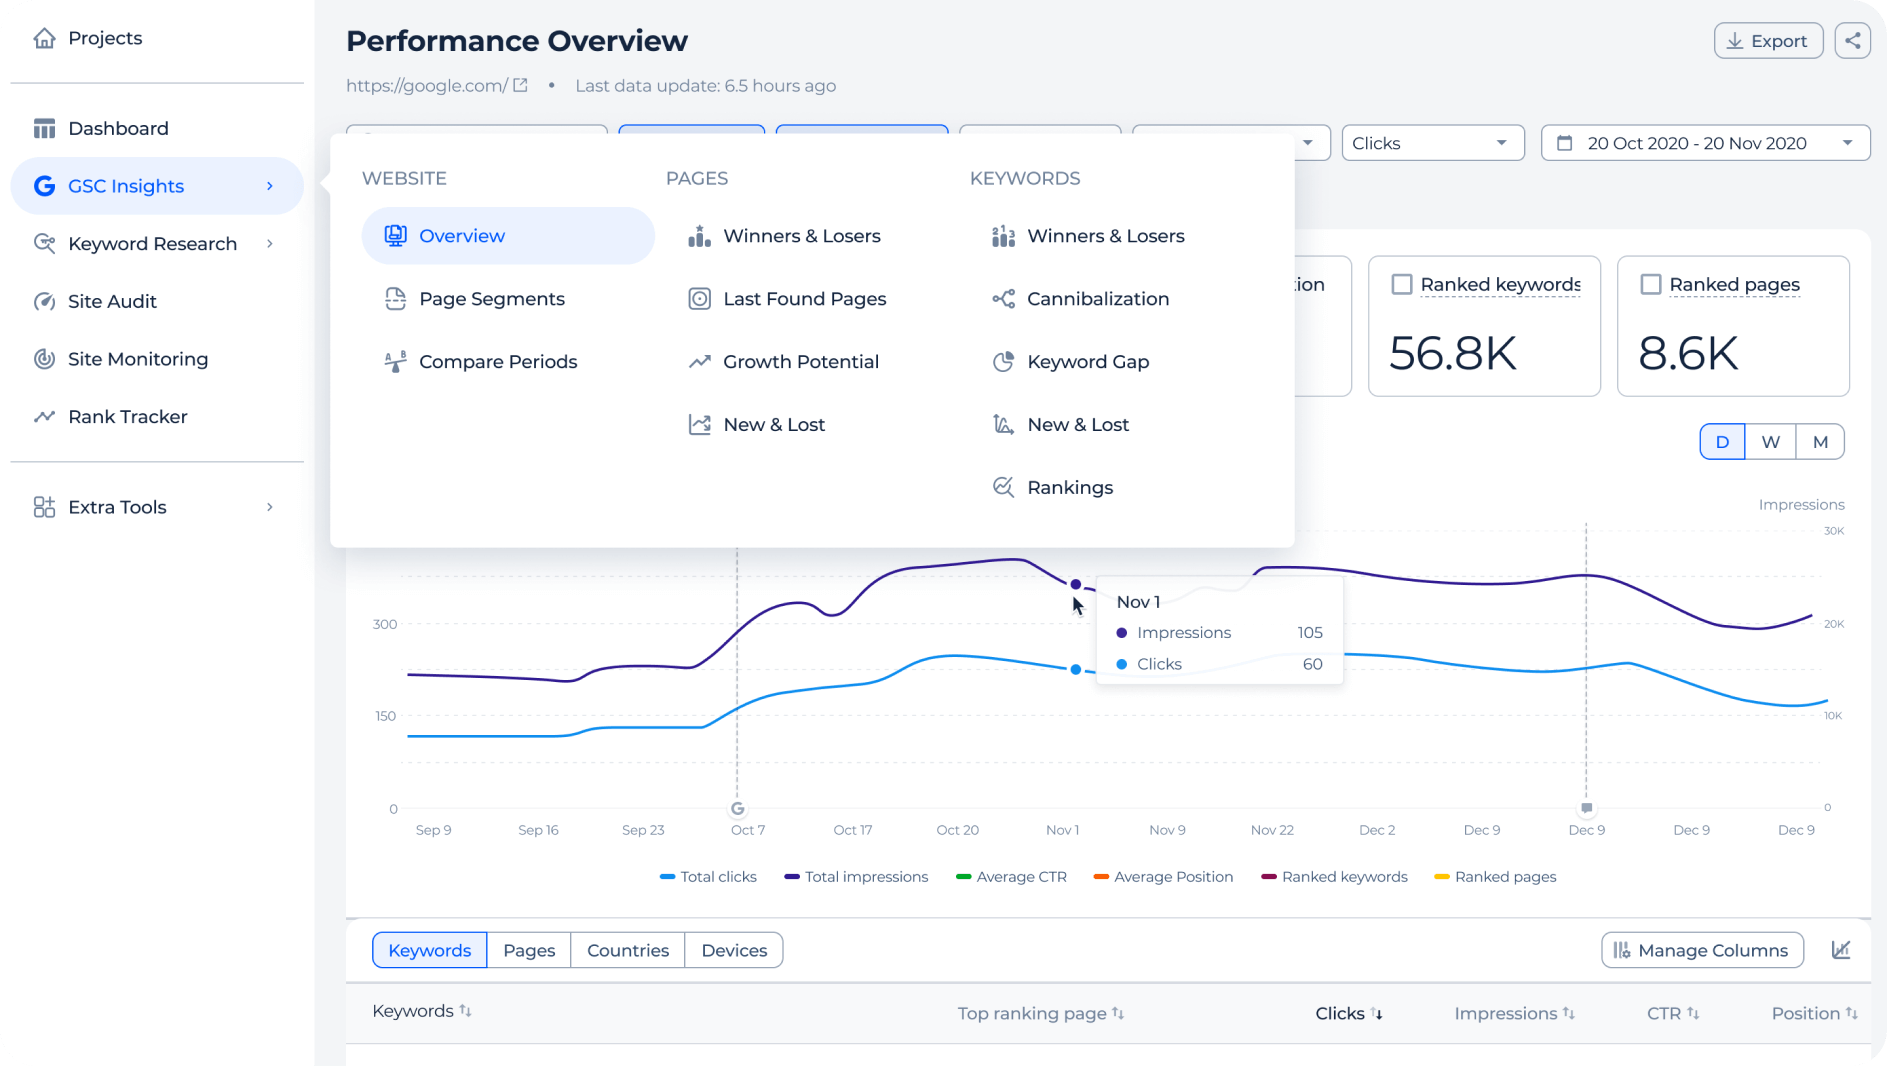
GSC insights reports
Get ready-made reports that highlight major issues and growth opportunities. Instantly see which pages lost traffic, which keywords appeared or dropped out, where cannibalization occurs, branded vs non-branded traffic comparison and which pages perform best. No setup needed - everything’s pre-organized for you.
Join the 1,000+ businesses growing with Sitechecker
All of our clients are growing after we use the platform. For instance, our client Hospital Amazônia had a growth of more than 13.500 impressions from March to September.

After two months there were noticeable improvements in rankings and organic traffic. Backlink and Rank Tracker make it easy to monitor changes, but our website needed also regular SEO audits. We decided to run Sitechecker Audit once a week and it also contributed to the improvement of our results. This audit comes really handy and allows for quick and effective on-site optimization.

Before using Sitechecker our ranking was approx. #4 (mobile SERP) regarding the most important keywords. Now we are #1!

FAQ
Can I export more than 1,000 search query data rows simultaneously?
Yes, the Google Search Console Dashboard allows you to export unlimited keyword and page data rows, without the typical 1,000-row restriction in GSC.
How many months of historical data can I access?
You can access up to 36 months of historical data.
Can I filter data based on multiple conditions simultaneously?
Yes, you can apply multi-condition filters across multiple criteria, including positions, countries, devices, and visibility in a single interface. This allows for precise data segmentation without exporting to external tools.
Can I identify the top-ranking page for each search query?
Yes, you can directly match keywords to their top-ranking pages without manual lookups, making optimizing for high-impact search queries easier.
Does the search bar adjust based on the active data tab?
Yes, the search bar dynamically adapts based on the active tab (Keywords, Pages, Countries, Devices), providing precise, context-aware filtering.
Can data be refined without exporting to Excel or BigQuery?
Yes, the dashboard is designed for in-tool data refinement, eliminating the need for complex external data processing.
Can I combine GSC data with AI visibility insights?
Yes. The AI Visibility Checker connects your keyword and traffic data with AI appearance metrics, so you can compare organic rankings from GSC with your brand’s visibility in AI answers.