sitechecker.pro logo mobile

Interaction to Next Paint (INP): Meaning and Optimization Tips

Interaction to Next Paint (INP): Meaning and Optimization Tips

Free Complete Site Audit

Access a full website audit with over 300 technical insights.

Something went wrong. Please, try again later.
Trusted by
Sitechecker trusted company

Free Website SEO Checker & Audit Tool

  • Scan the site for 300+ technical issues
  • Monitor your site health 24/7
  • Track website rankings in any geo

What is Interaction to Next Paint (INP)?

Interaction to Next Paint (INP) is a crucial web performance metric that provides insights into the responsiveness of a webpage following user interaction. Specifically, INP measures the time taken from when a user interacts with a webpage (like clicking a button or tapping a link) to the moment the browser begins painting the next frame in response to that interaction. It aids developers in understanding the latency experienced by users and offers an avenue for optimization.

What’s a good Interaction to Next Paint value?

Ideal INP values may vary based on the specific web page interaction scenario, but in general, a lower Interaction to Next Paint value indicates a more responsive website. For most webpages:

  • Excellent: Below 100 milliseconds
  • Average: 100-300 milliseconds
  • Poor: Above 300 milliseconds

Achieving “excellent” values ensures that users experience smooth and swift reactions to their interactions, promoting positive user experience.

What user interactions does INP consider?

INP takes into account a range of user-initiated interactions, including:

  • Clicking or tapping buttons or links
  • Input in text fields
  • Selecting options from dropdown menus
  • Interactions with custom elements, like sliders or carousels

However, it’s crucial to note that not all interactions might trigger a paint; INP only measures those that do.

How is INP different from First Input Delay (FID)?

Both INP and FID are metrics that assess the responsiveness of a website, but they focus on different aspects:

  • INP: Measures the time from a user interaction to when the browser starts painting the next frame.
  • FID: Concentrates on the time between a user’s first interaction and the browser’s response to that interaction.
    inp and fid different chart

While INP looks at the visual feedback following an interaction, FID is more concerned with the delay before any processing begins after an initial interaction.

Is Interaction to Next Paint a Core Web Vitals metric?

As of the latest update, Interaction to Next Paint (INP) is not categorized as a Core Web Vital. However, given its importance in assessing webpage responsiveness post-user interaction, it’s a significant metric for developers aiming for holistic web performance optimization.

On September 12, 2023, Barry Schwartz tweeted:

John Mueller said that Interaction to Next Paint is a new metric that Google is testing, but it's not yet a ranking signal. It's a way to measure how quickly a page becomes interactive after a user taps on a link. It's a good metric to track because it can help you improve the user experience of your website.

Why is INP a field metric?

INP is considered a field metric because it evaluates real-world user experiences. Rather than being assessed in a controlled environment (like lab metrics), field metrics provide insights based on actual user interactions and the myriad of variables they might encounter, such as different devices, network conditions, and more.

Does INP measure the slowest response on a page?

INP focuses on the latency experienced after user interactions leading to a paint. It doesn’t specifically target the slowest response on a page but can highlight instances where there are significant delays in visual feedback post-interaction.

Changes to the INP definition

The web performance landscape is evolving, and metrics definitions can undergo refinements to better cater to user needs. As with many metrics, INP’s definition and measurement methods might be updated over time to ensure accuracy and relevance. Developers and webmasters should remain updated with sources like the Web Performance Working Group for any changes.

How to Measure Interaction to Next Paint

Measuring Interaction to Next Paint (INP) accurately is crucial for gauging the responsiveness of a website after user interactions. These measurements can be conducted both in the field (real-world environments) and in the lab (controlled environments).

In the field

Field data is gathered from real-world user interactions, offering insights into how your website performs under varying conditions.

Measure Interaction to Next Paint with DebugBear

DebugBear is a comprehensive website monitoring tool that allows developers to track INP and other performance metrics. Here’s how to measure INP with DebugBear:

  1. Set up a project in DebugBear and input your website URL.
  2. Navigate to the performance metrics section and locate the INP metric.
  3. Monitor the results over time, taking note of any spikes or anomalies.

Interaction to Next Paint in PageSpeed Insights

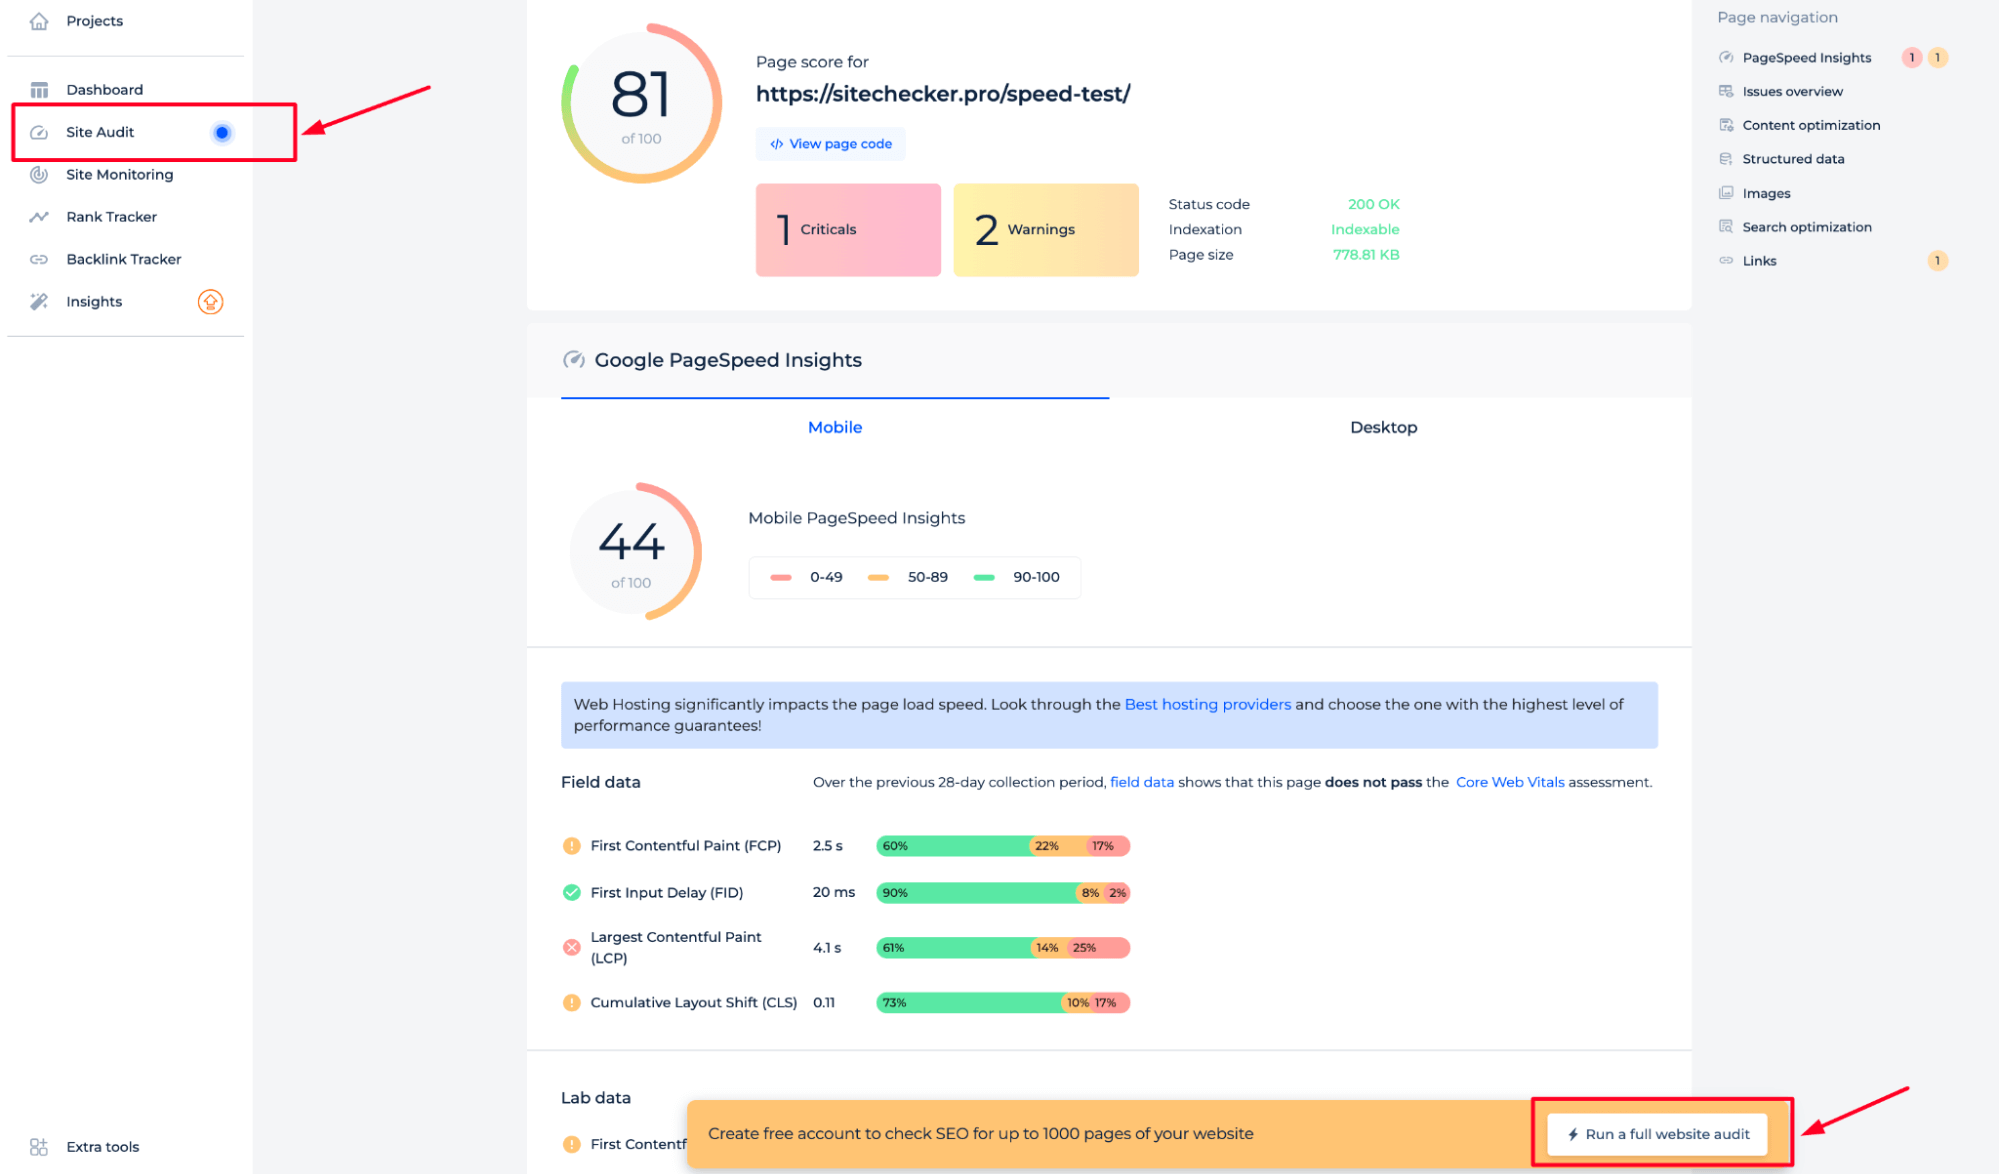
Google’s PageSpeed Insights provides performance scores for webpages, including INP:

  1. Visit the PageSpeed Insights website.
  2. Enter your URL and initiate the analysis.
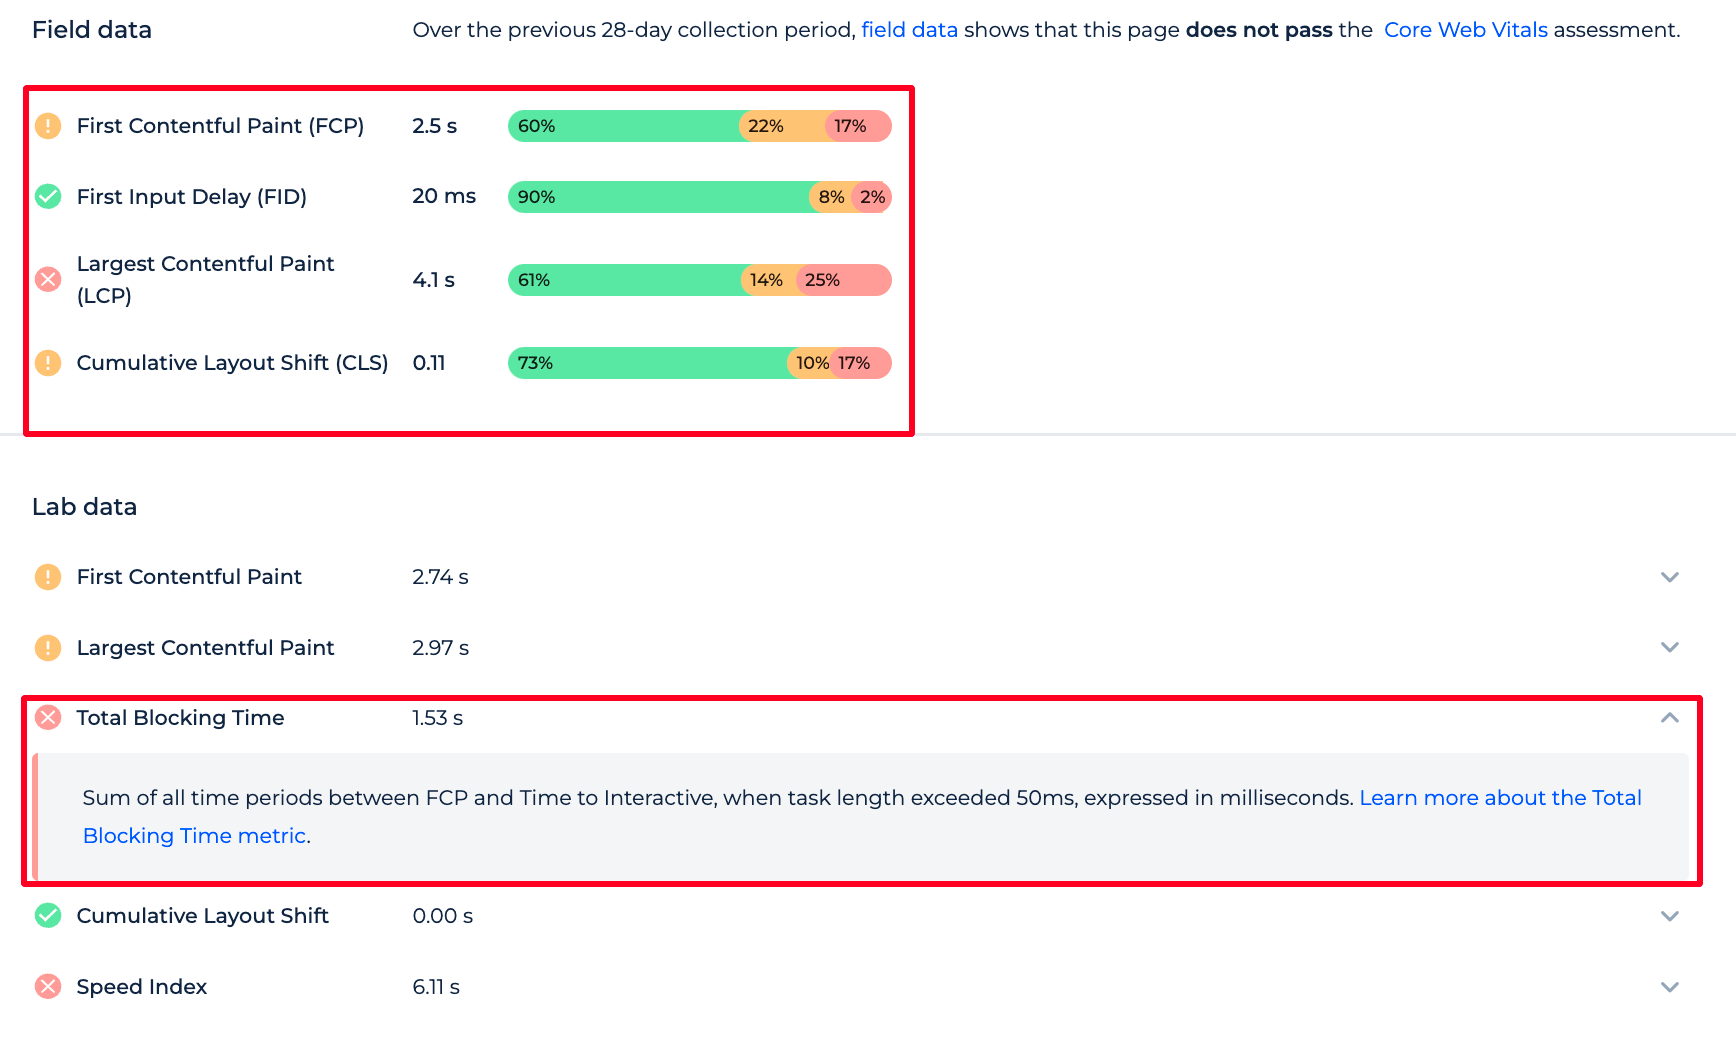
  3. Under the “Field Data” section, you’ll find the INP metric. This will give you a percentile score and highlight areas needing improvement.
    pagespeed insights

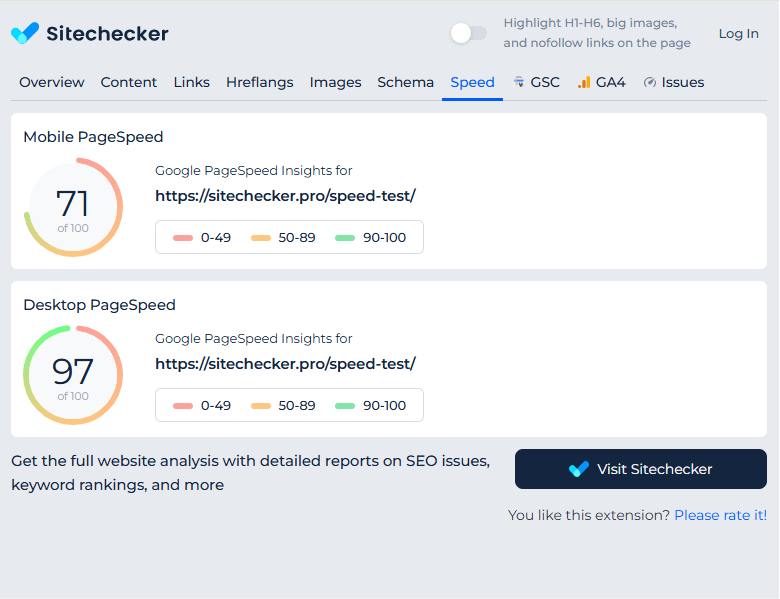
View INP with the Site Speed Chrome extension

The Site Speed Chrome extension is a handy tool for developers:

  1. Install the extension from the Chrome Web Store.
  2. Visit the webpage you wish to analyze.
  3. Activate the extension to get real-time performance data, including INP.

Identify INP issues with the INP Debugger

The INP Debugger is a specialized tool to delve deeper into INP-related issues:

  1. Run the debugger on your desired webpage.
  2. It will provide a breakdown of user interactions and the corresponding INP values, highlighting areas of concern.

INP in Google Search Console

Google Search Console (GSC) offers a new Core Web Vitals’ report, which can include INP data if relevant:

  1. Log into GSC and select your property.
  2. Navigate to the “Experience” section and click on “Core Web Vitals.”
  3. Here, if INP is a recognized metric at the time, you’ll find insights and possible issues related to it.
    inp in google search console

Measure INP with the web-vitals library

The web-vitals library by Google provides a set of helpers to measure web vitals in the field:

  1. Integrate the library into your website codebase.
  2. Use the provided methods to measure and log INP values.
  3. Analyze the data to identify patterns and potential optimization areas.

In the lab

Lab data is gathered in controlled environments, ensuring consistency and allowing for a more isolated analysis.

Tools for measuring in the lab

In a lab setting, tools such as Lighthouse or WebPageTest can be employed. These tools simulate user interactions in controlled environments:

  1. Lighthouse: Integrated with Chrome DevTools, it offers performance analysis, including INP if it’s an adopted metric in future versions.
    tools for measuring
  2. WebPageTest: This online tool provides in-depth performance tests, potentially capturing INP data under its custom metrics.
    webpagetest

Running these tools in a consistent environment ensures that variables like network speed or device type don’t affect the results, providing a baseline for performance.

How to Optimize Interaction to Next Paint

Optimizing Interaction to Next Paint (INP) is pivotal for enhancing user experience, as a responsive website often leads to better user engagement and satisfaction. The optimization strategies can be broadly categorized into reducing the input delay component, minimizing the processing time, and curtailing the presentation delay.

Reduce the Input Delay component

Input delay refers to the time between when a user initiates an interaction and when the browser starts processing that interaction. Reducing this delay ensures a swift reaction to user actions. Here’s how to minimize it:

  1. Defer non-essential JavaScript: Heavy scripts can block the main thread. Use techniques like async and defer attributes to ensure non-essential scripts don’t hinder the immediate response to user inputs.
  2. Use passive event listeners: This allows the page to continue scrolling without waiting for JavaScript, improving the immediate response feel for users.
  3. Break up long tasks: Split extensive JavaScript tasks into smaller chunks using techniques like requestIdleCallback, preventing them from monopolizing the main thread.

Reduce the processing component

Once the browser starts processing an interaction, ensuring it does so efficiently can further enhance INP.

Avoid native alert, confirm, and prompt dialogs

These dialog methods are synchronous and block the main thread, causing notable delays in page responsiveness.

  • Use asynchronous UI solutions: Implement custom modal dialogs or third-party libraries that don’t block the main thread.
  • Educate developers: Ensure that the development team understands the performance implications of using blocking dialogs.

Other techniques include:

  • Optimize JavaScript execution: Minify and compress JS files. Also, consider using Web Workers for off-thread computations.
  • Limit third-party scripts: Some third-party scripts can be performance hogs. Regularly audit and remove non-essential third-party scripts or search for more efficient alternatives.
  • Use efficient data structures and algorithms: Ensure that the code is optimized for performance, especially in critical interaction paths.

Reduce the presentation delay

After processing, the browser paints the required changes on the screen. Reducing this paint time is the final step in optimizing INP.

  1. Optimize CSS: Complex CSS can slow down painting. Minimize the use of expensive properties like box-shadow or gradients, especially on elements that change frequently.
  2. Reduce layout thrashing: Limit direct DOM manipulations. Batch DOM reads and writes to prevent multiple reflows and repaints.
  3. Use GPU-accelerated animations: For animations, stick to properties like transform and opacity, which can be offloaded to the GPU, ensuring smoother animations without hampering the main thread.
  4. Implement lazy loading: Only load assets like images or iframes when they’re needed, reducing the paint workload on initial interactions.

Monitoring Interaction to Next Paint

Monitoring Interaction to Next Paint (INP) consistently is crucial for understanding the real-world performance of a website and ensuring that the end-users experience a seamless interaction. Continuous monitoring allows developers to detect performance regressions early, understand how code changes affect INP, and make informed decisions for improvements. Here’s a comprehensive guide on how to approach INP monitoring:

Why Monitor INP

  1. User Experience: As a measure of interaction responsiveness, INP directly impacts user satisfaction. A site with a low INP score may see decreased user engagement.
  2. Web Vitals and SEO: As the web evolves, performance metrics like INP can become more prominent in search engine ranking algorithms.
  3. Identifying Regressions: Continuous monitoring can help pinpoint when and where performance drops happen, correlating them to specific code changes or updates.

Tools for Monitoring INP

Various tools are available to monitor INP both in real-world environments (field data) and controlled settings (lab data).

  • Google Search Console: Offers Core Web Vitals reports which might include INP if it’s recognized as a vital metric.
  • PageSpeed Insights: Provides real-world INP data aggregated from Chrome users.
  • DebugBear: Monitors website performance over time, including INP.
  • Site Speed Chrome Extension: For on-the-go, real-time monitoring of web pages.
  • WebPageTest: In-depth performance analysis, useful for lab data, which might include INP in its custom metrics.

Setting up Alerts for INP Regressions

To proactively manage INP, set up alerting mechanisms:

  1. Threshold Alerts: Set a benchmark INP score. If your page’s INP crosses this threshold, the monitoring tool can send an alert.
  2. Regression Alerts: Some tools can detect significant changes in INP scores over a specified period and trigger alerts.
  3. Integration with DevOps: Integrate INP monitoring tools with your CI/CD pipelines. This allows for automated performance tests and alerts before deploying changes to production.

Analyzing and Interpreting INP Data

Once you’ve collected INP data:

  1. Compare Field vs. Lab Data: Understand if real-world user data aligns with controlled tests. Discrepancies can highlight external factors affecting INP.
  2. Segment Data: Break down INP scores by device type, network conditions, geographical location, etc., to understand where optimizations are most needed.
  3. Correlate with Other Metrics: See how INP scores relate to other performance metrics, providing a holistic view of website performance.

Website Speed Test to Check Page Speed for Entire Website or Specific Page

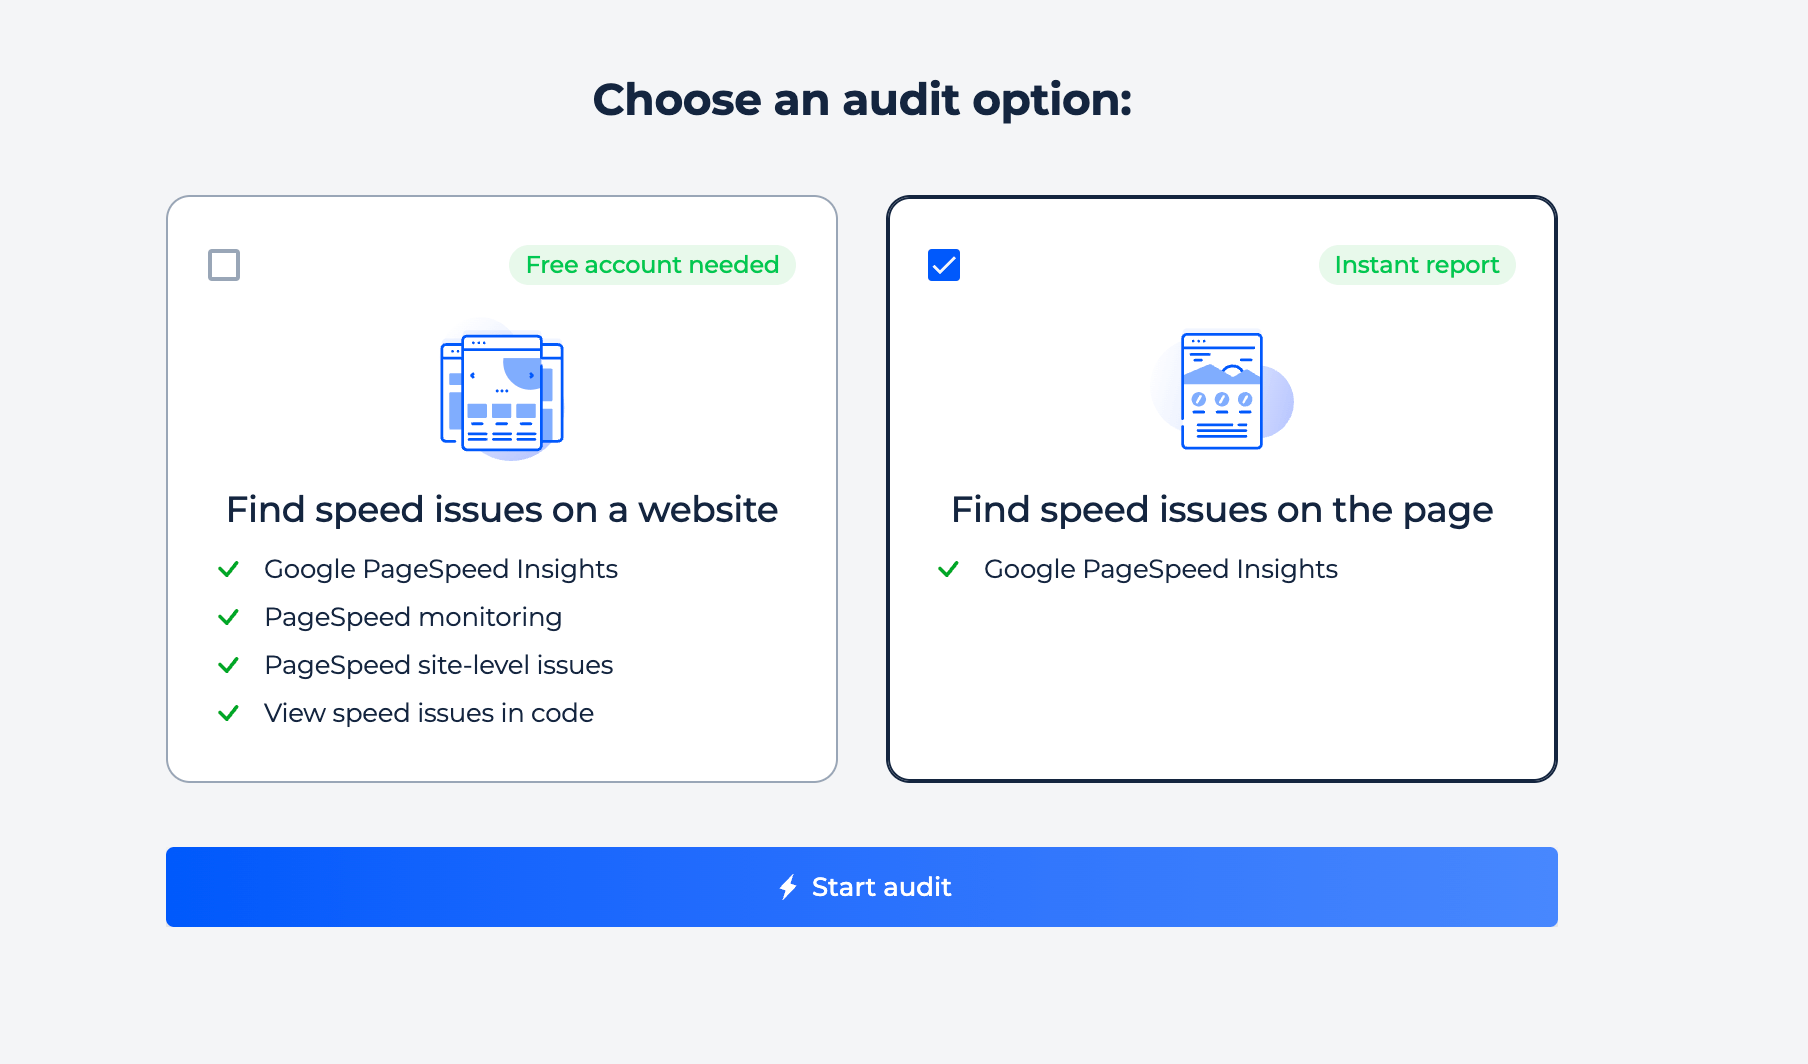
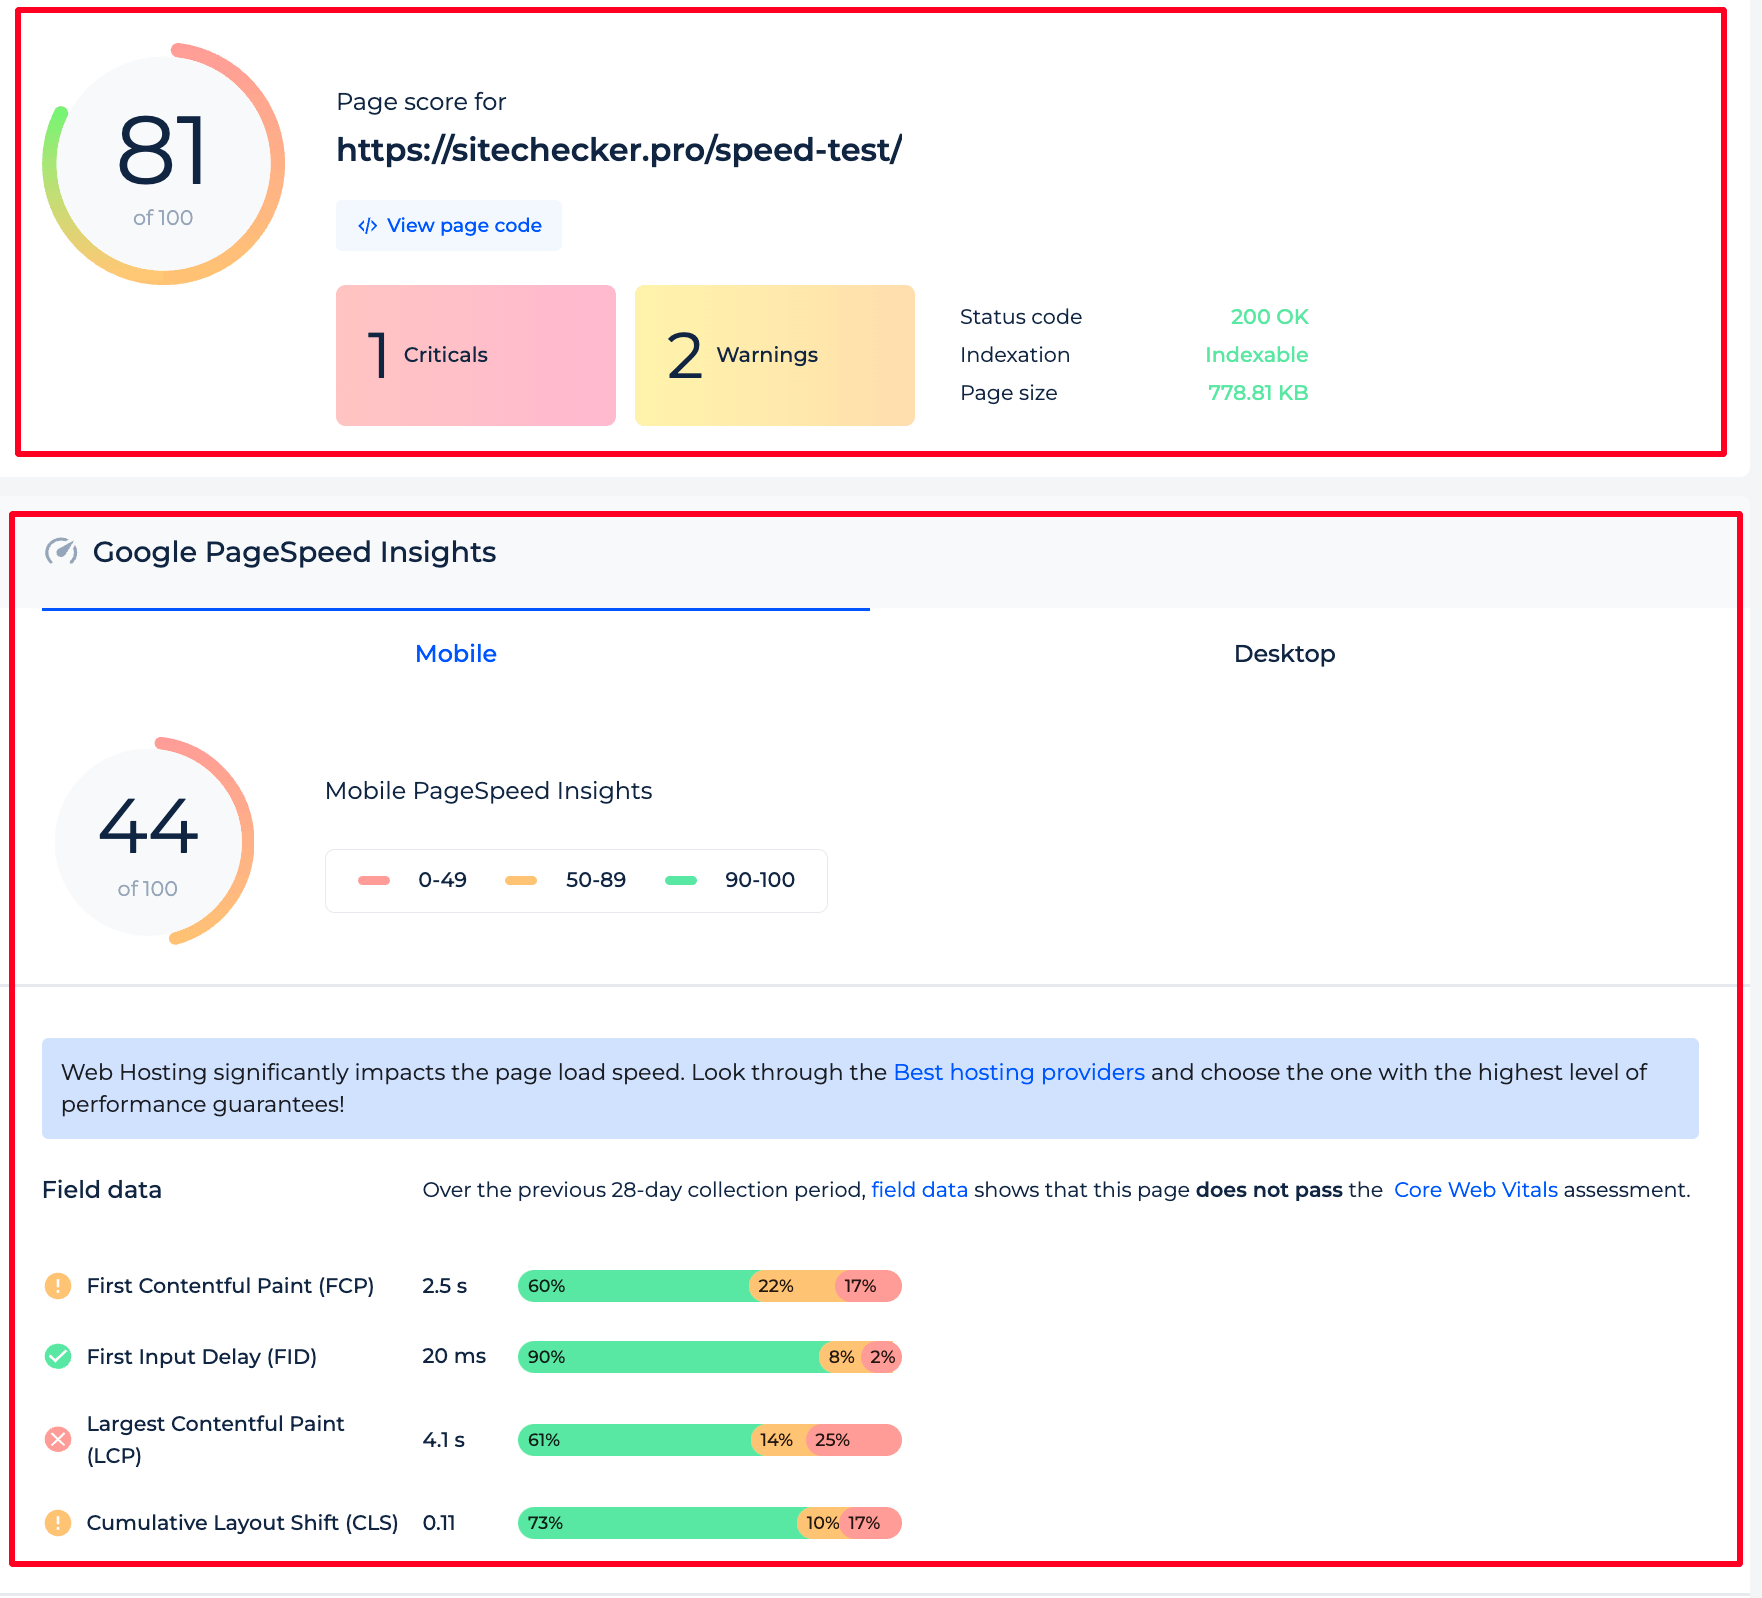
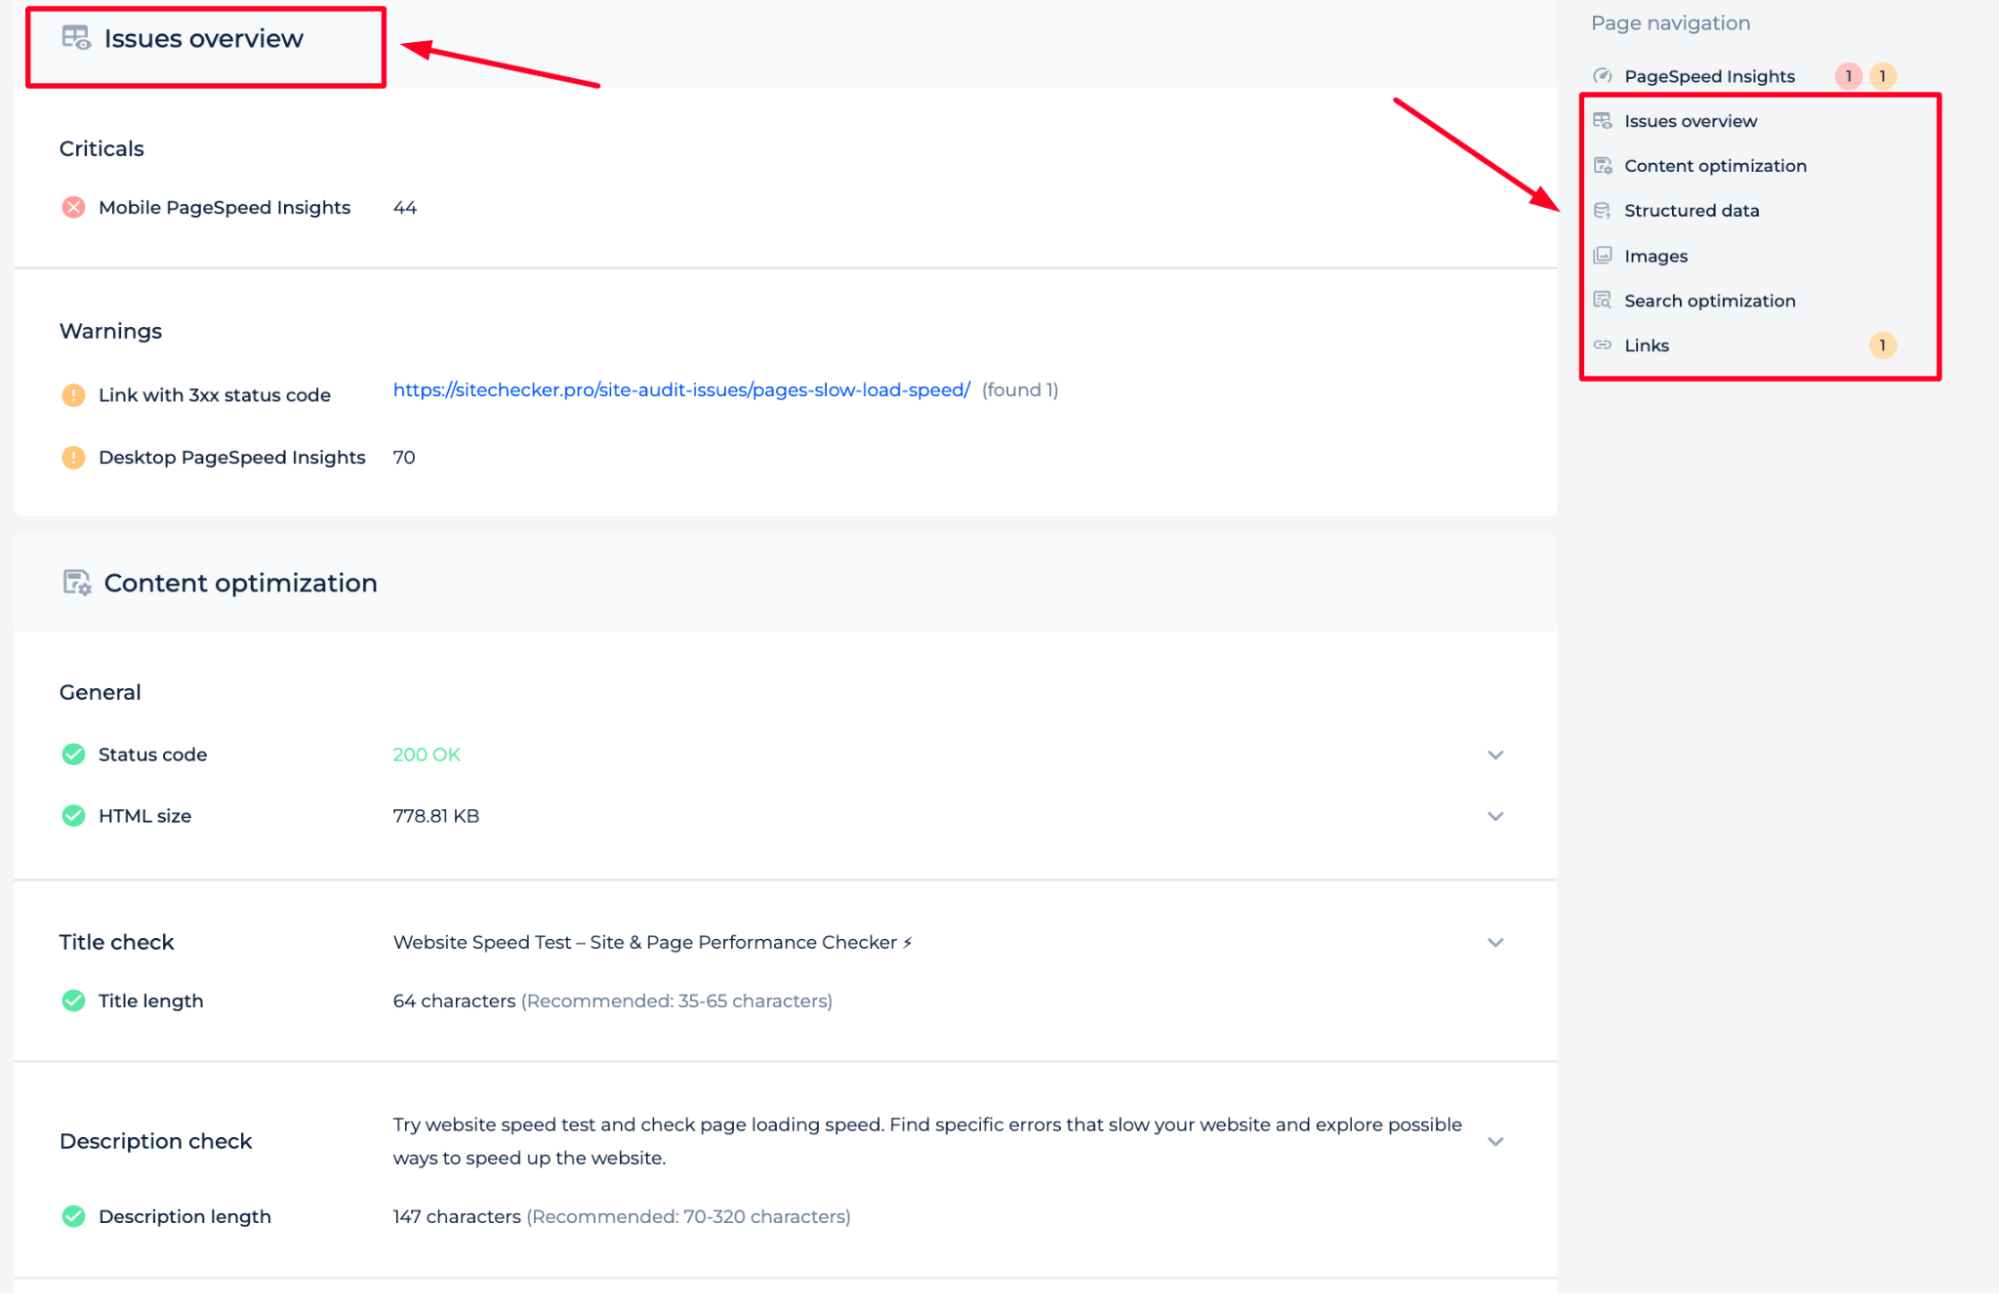
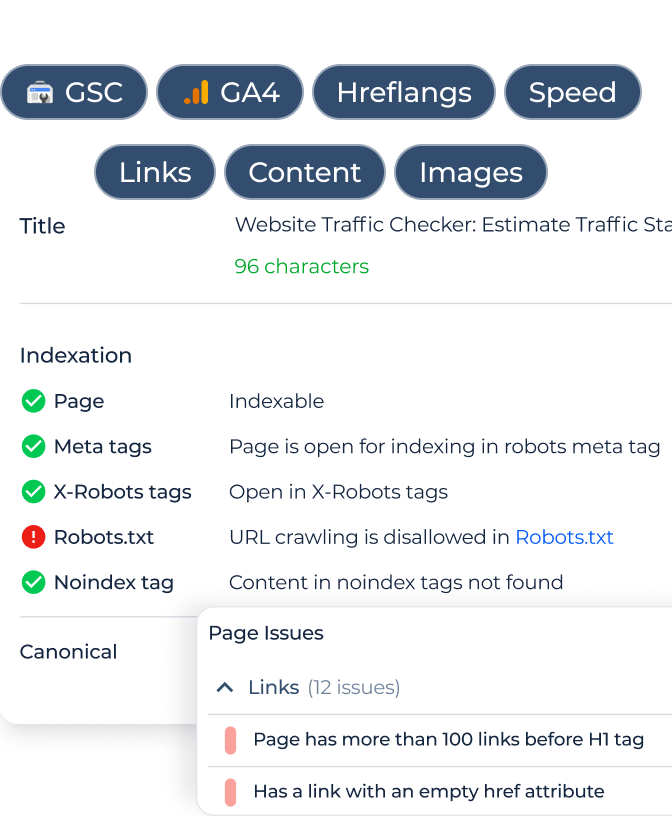
The Website Speed Test tool from Sitechecker is a vital asset for anyone seeking to understand and improve their website’s performance. In a world where split-second load times can drastically affect user experience and search rankings, this tool provides an instant analysis of your site’s speed, giving clear insights into what’s working and what needs attention.

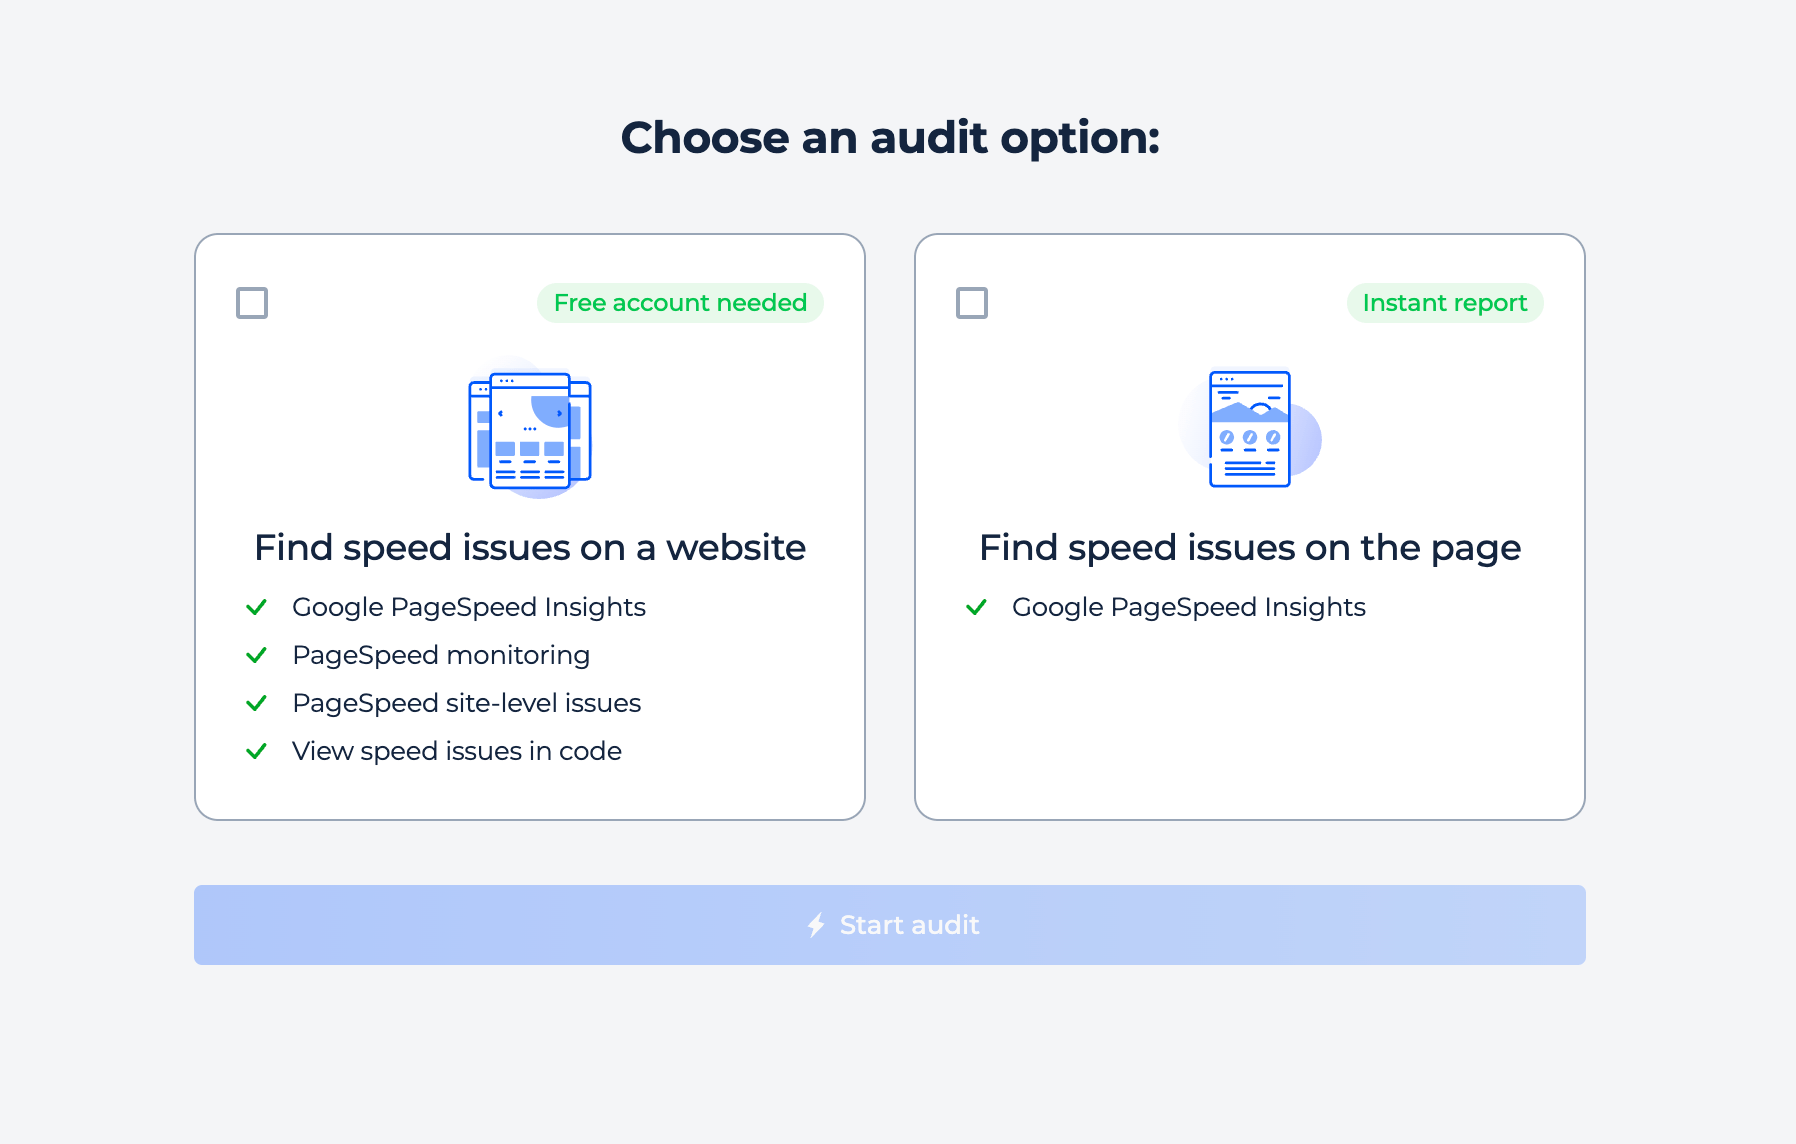
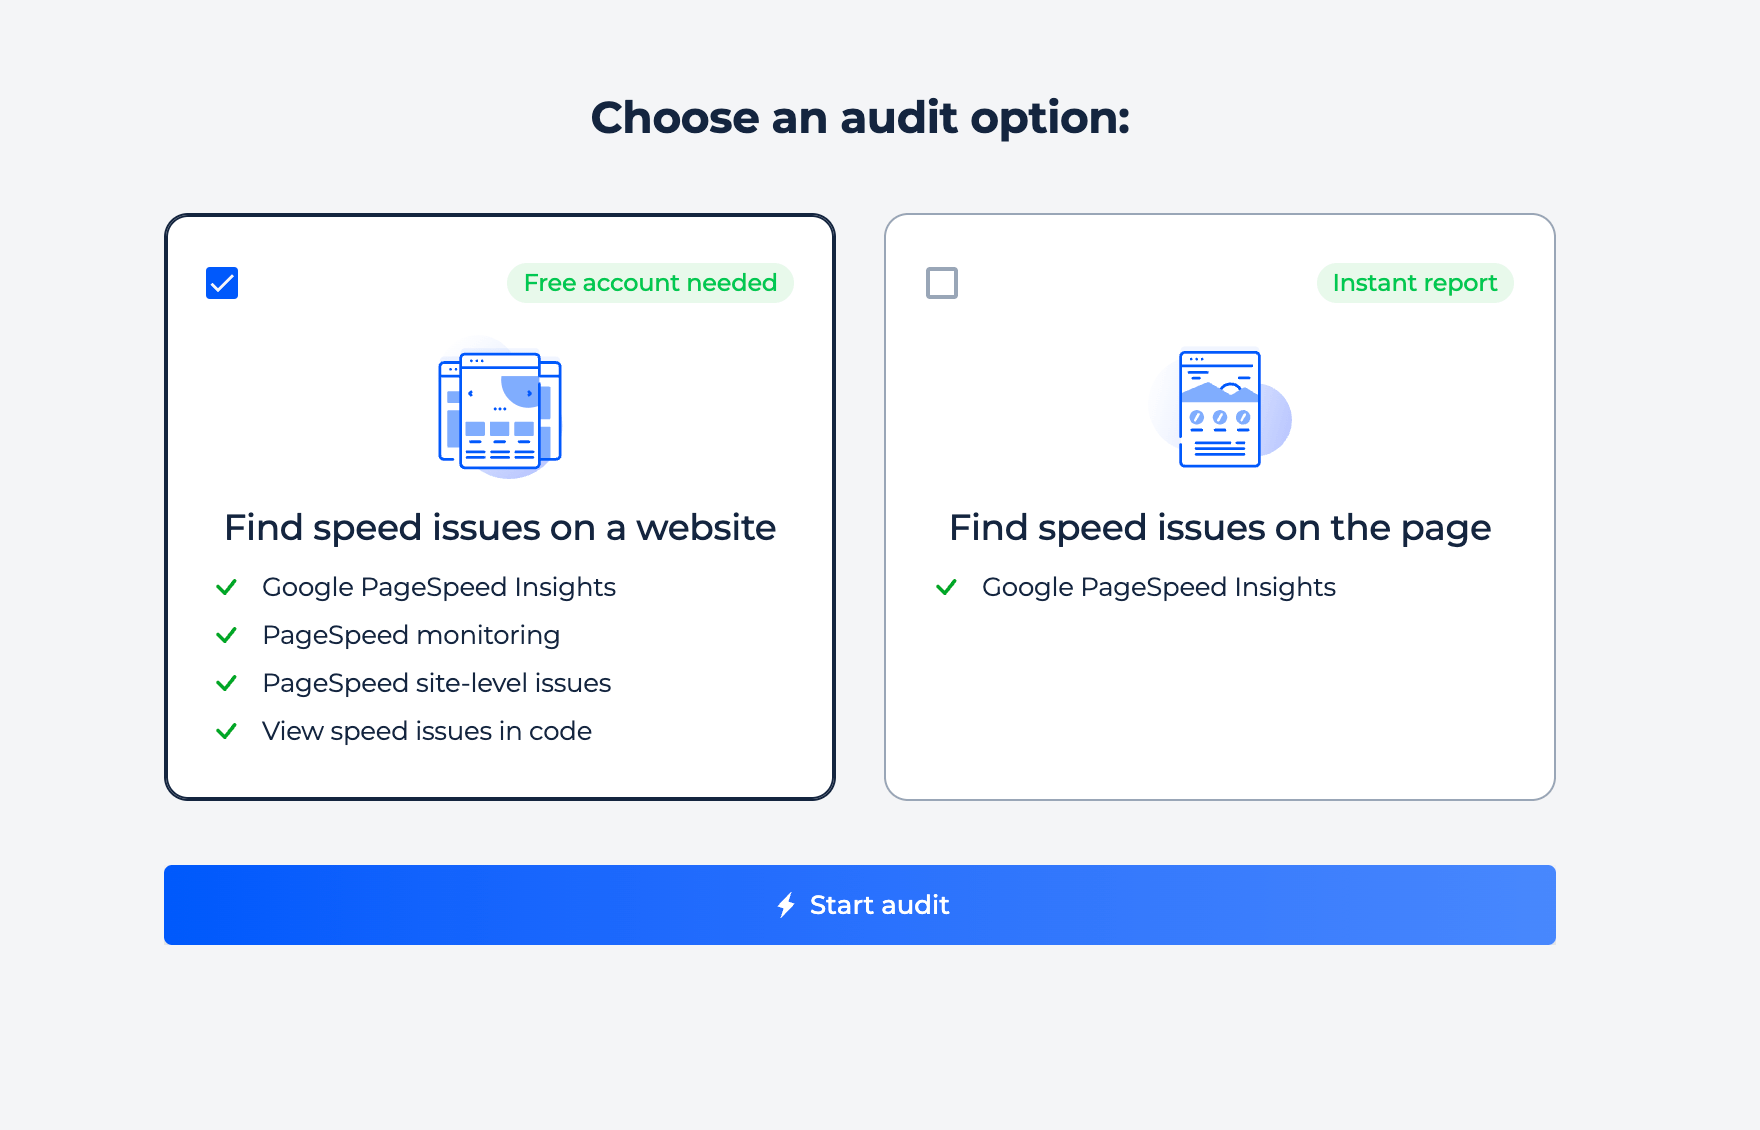
website speed test page

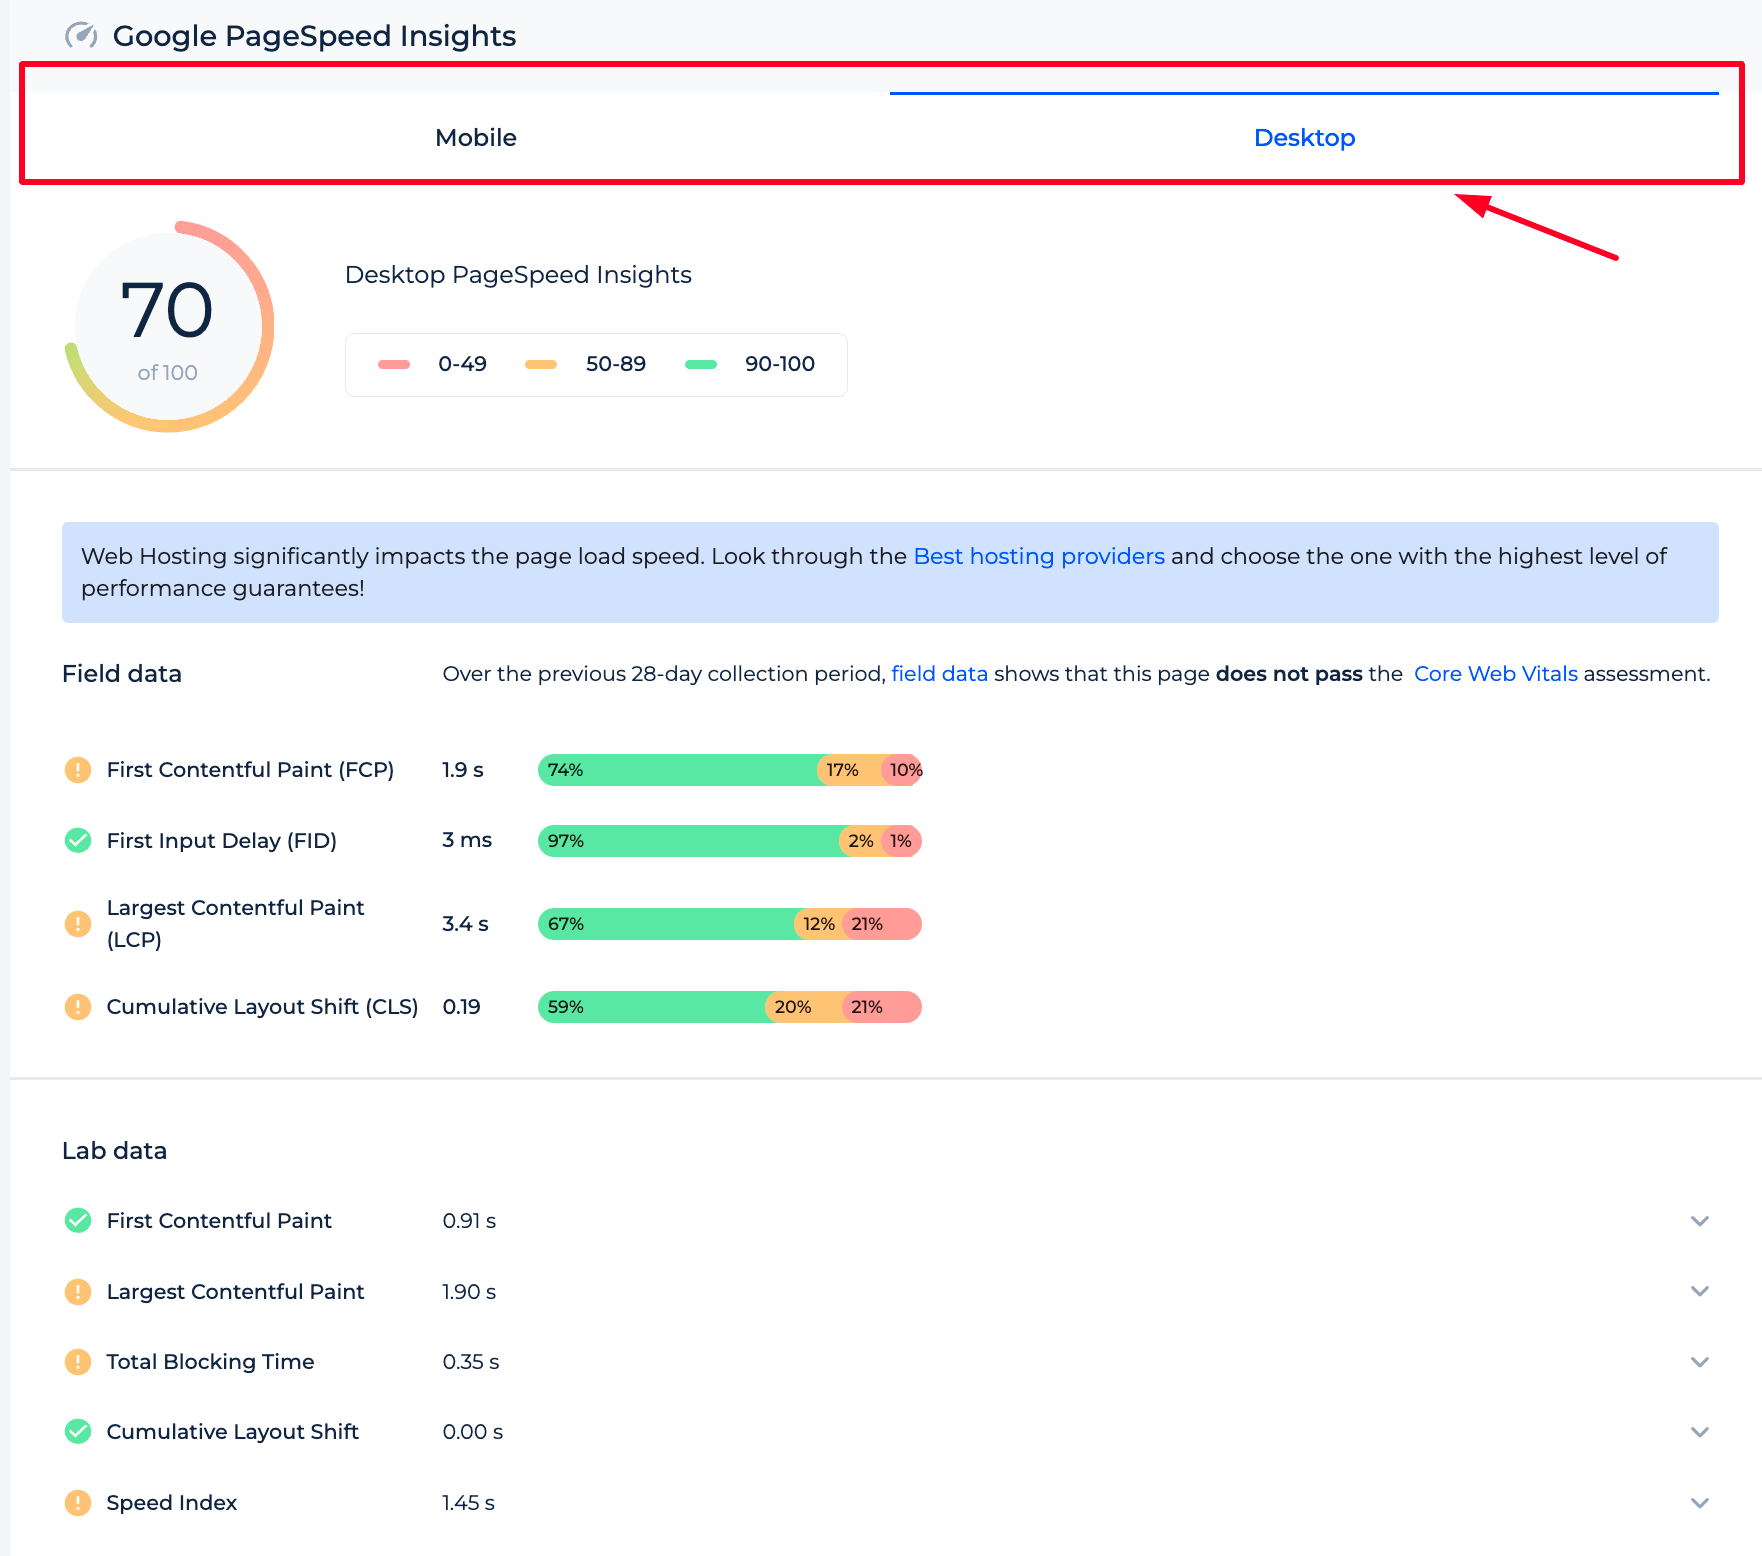
Beyond just providing a speed score, the tool digs deeper. It highlights specific elements, from images to scripts, that may be bogging down your site. Its detailed breakdowns and actionable recommendations mean that not only can you diagnose issues, but you can also implement effective solutions immediately. Dive in and ensure your website is operating at peak efficiency!

Unlock Peak Website Performance!

Discover what's holding you back and optimize it for the best user experience.

Something went wrong. Please, try again later.

Conclusion

Interaction to Next Paint (INP) stands as a pivotal metric, shedding light on a website’s responsiveness during user interactions. As the digital landscape continues to evolve, the nuances of how users perceive website performance become even more critical. Monitoring, measuring, and optimizing INP doesn’t just cater to technical benchmarks; it fundamentally enhances the user experience. By staying vigilant about Interaction to Next Paint and the surrounding methodologies, developers and web administrators can ensure that their sites remain agile, efficient, and user-centric, meeting the ever-increasing demands of the modern web user. As we move forward, INP will undoubtedly play an even more significant role in shaping the broader discourse on web performance and user engagement.

FAQ
INP directly impacts how swiftly a site responds to user actions. A low INP ensures users experience immediate feedback, leading to greater satisfaction and engagement.
Heavy scripts, non-optimized JavaScript, blocking dialog methods, and intricate CSS can slow down INP, affecting the website's responsiveness.
Field data captures real-world user experiences, while lab data is obtained in controlled settings. Comparing both highlights external factors influencing INP and ensures comprehensive performance analysis.
Fast Links

You may also like

View More Posts
Pages Per Session: How to Calculate, Improve, and Understand Different Benchmarks Across Niches
SEO Basics
Pages Per Session: How to Calculate, Improve, and Understand Different Benchmarks Across Niches
Ivan Palii
Feb 28, 2024
The Impact of JavaScript on Web Performance & SEO
SEO Basics
The Impact of JavaScript on Web Performance & SEO
Ivan Palii
Oct 11, 2023
What is 401 Status Code: Tips on How to Identify and Fix
SEO Basics
What is 401 Status Code: Tips on How to Identify and Fix
Ivan Palii
Sep 27, 2023

So, soon? Well, before you go…

Get instant on-page SEO analysis of your home page

  • Detect broken links
  • Detect issues with content optimization
  • Check PageSpeed for mobile and desktop
Something went wrong. Please, try again later.
You’ll get the report in 2 seconds without required signup
exit-popup-image
close