")


What is Total Blocking Time (TBT)?
Total Blocking Time (TBT) is a performance metric that quantifies the amount of time between the First Contentful Paint (FCP) and the Time to Interactive (TTI) during which the main thread was blocked for long enough to prevent input responsiveness. In simpler terms, it’s a measure of the “lag” a user might experience when interacting with a webpage during its loading phase.
Let’s break this down a bit:
- First Contentful Paint (FCP): This metric denotes the point when the browser renders the first bit of content from the Document Object Model (DOM), which could be text, an image, or even a canvas render. It provides an initial indication that the page is “doing something” and isn’t stuck.
- Time to Interactive (TTI): TTI marks the point when the main thread has had the chance to process the necessary tasks, ensuring consistent interaction for the user. In other words, it’s the time when the user can actively engage with a page, and the page is reliably responsive.
During the interval between FCP and TTI, various processes and tasks are performed, which could potentially block the main thread. For instance, when a user tries to click a link or button, but there’s a delay or nothing happens, it’s usually because the main thread is blocked by some other task. The total duration of all such blocking events is what’s referred to as Total Blocking Time.
For website owners, developers, and SEO professionals, TBT is a crucial metric because it directly impacts user experience. A high TBT suggests that users may face noticeable delays when trying to interact with the page, leading to potential frustration and a likelihood of bouncing off the page. Thus, optimizing to reduce TBT can significantly enhance the user experience and, in turn, the overall performance of a webpage.H2 How Google Measures TBT
How to Measure Total Blocking Time
Total Blocking Time (TBT) offers insights into the interactivity of your page. But how do we accurately measure it? Getting a grasp on TBT begins with understanding long tasks, and then leveraging the right tools.
Understanding Long Tasks
In the realm of web performance, any task that blocks the main thread for more than 50 milliseconds is considered a “long task.” Why 50 milliseconds? This is based on the idea that to maintain a smooth user experience, pages should run at 60 frames per second, which means each frame has just 16 milliseconds to execute. Any task that exceeds this limit can potentially impact the interactivity and responsiveness of a page.
Long tasks can occur due to various reasons:
- Heavy JavaScript Execution: Large scripts, or scripts that aren’t optimized, can keep the main thread busy.
- Large Styles Calculations: This can happen when the browser recalculates styles for many elements at once.
- Resource Loading: Especially if these resources are large and not optimized.
Identifying and optimizing these long tasks is the first step in reducing your TBT.
2 Tools to Measure Total Blocking Time
- Lighthouse: This is an open-source, automated tool by Google that assesses a webpage’s quality. It can be run against any web page and provides audits for performance, accessibility, progressive web apps, and more. Within the performance audit, Lighthouse reports on TBT, giving details on the long tasks that contribute to it.
- Chrome DevTools: The Performance Panel in Chrome DevTools allows for a more in-depth examination of a page’s runtime. By recording a session, you can inspect each task that runs on the main thread. Tasks taking longer than 50 milliseconds will be highlighted, helping you pinpoint the culprits behind high TBT.
What’s a Good Total Blocking Time (TBT) Score?
The ideal TBT score can vary based on the nature and complexity of a webpage. However, as a general guideline from Google’s web performance benchmarks:
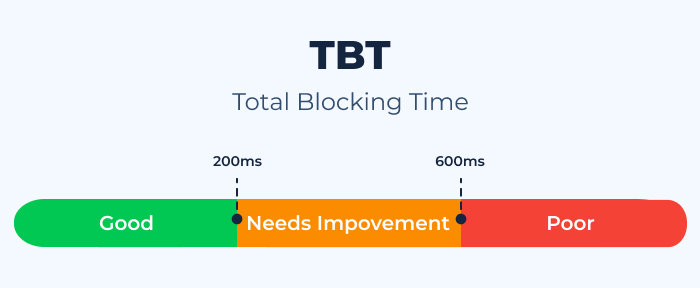
- 0 to 200 milliseconds: This is considered a good range. It means that users are less likely to notice any lag or unresponsiveness during page load.
- 200 to 500 milliseconds: This range is moderate. Some users might notice slight delays, but it might not be critical for all types of websites.
- Above 500 milliseconds: This is considered poor. Delays are noticeable, and user experience might be significantly affected, especially on web pages where interactivity is crucial.
Remember, while TBT is an important metric, it’s also vital to consider it in conjunction with other performance metrics to get a holistic view of your webpage’s performance.
What is the Difference Between Total Blocking Time and First Input Delay?
Both Total Blocking Time (TBT) and First Input Delay (FID) are vital metrics when gauging the interactivity and responsiveness of a webpage. However, they measure different aspects of the user experience. Let’s dive into their definitions and key differences.
Total Blocking Time (TBT):
Definition: TBT quantifies the total amount of time between the First Contentful Paint (FCP) and the Time to Interactive (TTI) where the main thread was blocked for long enough to prevent input responsiveness.
Key Characteristics:
- TBT captures the total duration of all blocking events (i.e., tasks that exceed 50ms) during the loading phase.
- It’s more of a lab metric, meaning it’s often used during testing environments to diagnose and improve performance.
First Input Delay (FID):
Definition: FID measures the time from when a user first interacts with a page (e.g., when they click a link, tap on a button, or use custom JavaScript-powered controls) to the time when the browser is actually able to respond to that interaction.
Key Characteristics:
- FID focuses specifically on the delay of the first user interaction. It doesn’t account for the delays of subsequent interactions.
- It’s a real-world metric, capturing actual experiences of real users in the wild. FID can be measured using field tools like the Chrome User Experience Report (CrUX).
Key Differences:
- Scope of Measurement: While TBT measures the total blockage time during the loading phase, FID captures the delay of the first input event. TBT might be influenced by multiple blocking events, whereas FID only considers the initial interaction delay.
- Usage Context: TBT is predominantly a lab metric used for diagnostic purposes during development and testing. In contrast, FID is a field metric that provides insights into real user experiences on live sites.
- User Interaction: TBT doesn’t necessarily require user interaction; it’s gauging potential interactivity delays during loading. FID, however, is explicitly based on actual user interactions with a page.
While both TBT and FID shed light on a webpage’s interactivity, they offer different perspectives. TBT gives a comprehensive view of potential blockages during load, while FID provides a snapshot of the user experience during their first interaction. Both metrics are valuable, and together, they can offer a fuller understanding of a page’s performance and areas for improvement.
What Is the Difference Between Total Blocking Time and Time to Interactive?
Total Blocking Time (TBT) and Time to Interactive (TTI) are both crucial performance metrics that gauge different aspects of a webpage’s interactivity and responsiveness. Let’s delve into their definitions and delineate their differences.
Total Blocking Time (TBT):
Definition: TBT represents the total amount of time between the First Contentful Paint (FCP) and the Time to Interactive (TTI) where the main thread was blocked for long enough (more than 50ms) to prevent input responsiveness.
Key Characteristics:
- TBT focuses on quantifying the total duration of all blocking events that could hinder interactivity during the loading phase.
- It gives an insight into how much “lag” a user might encounter when trying to interact with a page during its load.
Time to Interactive (TTI):
Definition: TTI measures the time from when the page starts loading to when its main sub-resources have loaded and it’s capable of reliably responding to user input in a timely manner.
Key Characteristics:
- TTI is concerned with pinpointing the exact moment when a page becomes fully interactive.
- It doesn’t just account for when content is displayed (like First Contentful Paint) but ensures that user interactions like clicks, scrolls, and input entries can be processed without noticeable delays.
Key Differences:
- Nature of Measurement:
- TBT: Reflects the accumulated potential delay times a user might face when trying to interact with content during the loading process.
- TTI: Marks the point where the page becomes reliably responsive to user interactions.
- Interactivity vs. Responsiveness:
- TBT: Gauges the degree of interactivity during page load, shedding light on periods where the main thread is too busy to handle user input.
- TTI: Highlights the shift from a page being visually ready to being both visually ready and responsive.
- Evaluation Context:
- TBT: Accumulates all instances where task execution exceeds 50ms during the loading phase.
- TTI: Assesses the broader readiness of a page, ensuring no significant tasks are running and recent user inputs are processed efficiently.
In essence, while both metrics are intertwined and related to a page’s interactivity, they offer distinct perspectives. TBT emphasizes the potential “hiccups” a user might face during page loading, whereas TTI signifies the transition from visual readiness to full interactivity. To holistically assess and improve web performance, developers and website owners should consider both metrics in tandem.
How to Check Which Tasks Hurt Your TBT
When optimizing for Total Blocking Time (TBT), it’s crucial to identify which tasks contribute the most to delays. By addressing the main culprits, you can significantly reduce TBT and enhance the overall user experience. Here’s a step-by-step guide to help you determine which tasks are impacting your TBT:
1. Use Chrome DevTools:
Chrome’s built-in DevTools offers a powerful suite for diagnosing performance issues.
- Open DevTools: Right-click on your webpage and select “Inspect” or press Ctrl + Shift + I (or Cmd + Option + I on Mac). Navigate to the “Performance” tab.
- Start a Performance Recording: Click the record button (a circle) at the top-left corner of the “Performance” tab. Refresh your webpage or interact with it. Once done, stop the recording.
2. Analyze the Main Thread:
Within the Performance panel, there will be a section labeled “Main” which visualizes tasks over time.
- Look for Long Tasks: Tasks that block the main thread for more than 50ms are considered “long tasks” and will contribute to TBT. These will appear as longer bars on the timeline.
3. Dive Deeper into Long Tasks:
Click on a long task bar to get detailed information.
- JavaScript Execution: One of the most common causes of long tasks. Check for large scripts or complex calculations.
- Style & Layout: Look for frequent recalculations or large style recalculations. These can be triggered by JavaScript modifying the DOM, forcing the browser to recalculate styles and layouts.
- Resource Loading: Check for long network requests or resource parsing times, especially for JavaScript and CSS files.
4. Check for Third-Party Scripts:
Often, third-party scripts (like ads, trackers, or widgets) can introduce unexpected delays. Identify these scripts in your performance recording and evaluate their necessity.
5. Use Lighthouse:
Besides DevTools, Google Lighthouse provides recommendations specifically for TBT. After running a Lighthouse audit on your page, check the “Diagnostics” section for insights related to TBT. It will often list problematic tasks or scripts.
6. Prioritize and Optimize:
Once you’ve identified the primary culprits:
- Optimize or Defer Large Scripts: Break large scripts into smaller chunks, defer non-essential scripts, or use the async attribute.
- Reduce Layout Shifts: Minimize DOM manipulations and avoid triggering style recalculations unless necessary.
- Limit Third-Party Scripts: If possible, reduce the number of third-party scripts or load them asynchronously.
- Optimize Resources: Ensure all resources (JS, CSS, images) are optimized, compressed, and served efficiently.
By following this process and continually monitoring your TBT, you can identify problematic tasks, make necessary optimizations, and offer users a smoother, more responsive experience on your webpage.H2 What Is the Impact of Total Blocking Time on Performance?
What Causes a High Total Blocking Time?
Total Blocking Time (TBT) is an indicator of your website’s interactivity and responsiveness. A high TBT suggests that users may experience noticeable delays when interacting with your site, especially during the loading phase. Several factors can contribute to a high TBT:
1. Heavy JavaScript Execution:
- Large Scripts: Running large or complex JavaScript files can hog the main thread, causing delays.
- Inefficient Code: Poorly optimized or redundant code can lead to unnecessary computation.
- Non-Deferred Scripts: Scripts that run as soon as the page loads can delay other critical tasks.
2. Excessive Layout Thrashing:
Frequent calculations or updates to the layout can cause the browser to continuously recalculate styles and layouts, thereby increasing TBT.
3. Main Thread Contention:
When multiple scripts or tasks compete for the main thread simultaneously, it leads to blocking.
4. Third-Party Scripts:
External scripts, like ads, trackers, and widgets, can introduce unexpected and uncontrolled tasks that block the main thread.
5. Large Styles Calculations:
If there are many styles or if styles are complex, the browser can take more time to calculate how elements should look.
6. Resource Loading Delays:
Slow server response times or fetching large resources can tie up the main thread, especially if these resources are parsed or executed immediately upon fetching.
7. Web Workers:
While web workers run tasks off the main thread, they can sometimes send data back to the main thread in an inefficient manner, leading to blocks.
8. Long Tasks:
Any task that runs for more than 50ms can contribute to TBT. Identifying and breaking down these long tasks can significantly reduce TBT.
9. Unoptimized Images & Media:
High-resolution images and media that aren’t optimized can cause layout recalculations and repainting, further blocking the main thread.
10. Lack of Browser Optimization:
Not leveraging browser capabilities, such as the async and defer attributes for scripts, can result in avoidable blocking.
11. Web Fonts:
Web fonts, especially if they are not loaded efficiently, can cause a delay in rendering, which can impact TBT if scripts are waiting for the font to be available.
12. Server-Side Rendering (SSR):
While SSR can improve the First Contentful Paint, if not done properly, it can introduce additional JavaScript that needs to be processed on the client side, impacting TBT.
13. Complex Animations & Transitions:
Animations that are not optimized, especially those triggered during the initial page load, can increase the main thread’s work.
To improve TBT, it’s essential to identify which of these factors affect your site the most and then prioritize optimizing them. Regularly monitoring your site’s performance using tools like Chrome DevTools and Lighthouse can provide insights and recommendations tailored to your website’s specific issues.
How to Reduce Total Blocking Time Longer Than 300 ms
Reducing Total Blocking Time (TBT) is critical for enhancing user experience, especially if TBT values exceed 300ms, which can be noticeably detrimental to interactivity. Here’s a detailed breakdown of how each optimization strategy can help reduce such prolonged TBT:
1. Defer JS:
Deferring JavaScript means preventing JS files from loading until after the main content of the page has loaded.
Benefits:
- Prioritizes rendering of the main content.
- Reduces the number of tasks during the initial load, lessening the potential for high TBT.
How to Implement:
- Use the defer attribute in your script tags: <script defer src=”path-to-script.js”></script>.
- Ensure the scripts are not crucial for the initial render or user interaction.
2. Delay JS:
Delaying JS execution involves waiting for specific events or time durations before running a script.
Benefits:
- Provides more control over when scripts run.
- Allows for smoother initial page loading by pushing non-essential JS to execute later.
How to Implement:
- Use tools or plugins that offer script delay features.
- Manually set timeouts for non-essential scripts.
3. Prefetch DNS Requests:
DNS prefetching resolves domain names before a user follows a link.
Benefits:
- Faster domain name resolution for third-party resources and linked pages.
- Reduces potential wait time for network requests.
How to Implement:
- Add the prefetch link to your HTML head: <link rel=”dns-prefetch” href=”//example.com”>.
4. Minify JS:
Minification removes unnecessary characters (like spaces and comments) from JavaScript without affecting functionality.
Benefits:
- Smaller file sizes lead to faster downloading and parsing times.
- Reduces the time the main thread spends processing JS.
How to Implement:
- Use tools like UglifyJS or Terser.
- Implement build processes that automatically minify JS, like Webpack or Gulp.
5. Use GZIP Compression:
GZIP compresses resources, making files smaller during transmission.
Benefits:
- Faster download times for resources.
- Less data to parse, reducing main thread work.
How to Implement:
- Configure your server to enable GZIP compression.
- Ensure resources, especially JS and CSS, are GZIP-compressed.
6. Minify CSS Files:
Just like with JS, minifying CSS involves removing unnecessary characters.
Benefits:
- Quicker style calculations and parsing.
- Faster download times for CSS files.
How to Implement:
- Use tools like CSSNano or CleanCSS.
- Incorporate CSS minification into your build process.
7. Optimize CSS Delivery:
Ensure only necessary CSS is loaded initially, and defer non-essential styles.
Benefits:
- Reduces render-blocking resources.
- Faster initial paint and potentially quicker interactivity.
How to Implement:
- Inline critical CSS.
- Use tools or plugins to extract and inline above-the-fold styles, deferring the rest.
8. Reduce Server Response Time and Time to First Byte (TTFB):
TTFB is the time it takes for a user’s browser to receive the first byte from the server.
Benefits:
- Faster start to resource download.
- Quicker beginning of resource processing, reducing potential blocking.
How to Implement:
- Optimize your server’s performance (use a Content Delivery Network, upgrade server hardware, or optimize server software).
- Reduce database lookup times by optimizing queries and using caching.
Incorporating these strategies can drastically reduce TBT, especially when it exceeds the 300ms mark, leading to a more fluid and responsive user experience.
How to Fix the TBT Score
Fixing the Total Blocking Time (TBT) score is crucial for ensuring a smooth user experience. One of the premier tools to measure and offer solutions for TBT issues is Google’s PageSpeed Insights. For WordPress users, there are specific optimizations that can be applied to improve TBT scores.
Running the PageSpeed Insights Audit:
PageSpeed Insights (PSI) is a tool by Google that provides insights into how well a web page performs on the Lighthouse performance metrics, including TBT.
Steps:
- Visit the PageSpeed Insights tool.
- Enter your website URL and click “Analyze.”
-
Review the report. Under the “Diagnostics” section, you’ll find insights related to TBT.
- Implement the recommended fixes. PSI often gives specific actionable recommendations to reduce TBT.
Enabling the WP:
When you mention “Enabling the WP,” I assume you’re talking about optimizations for WordPress (WP) sites, as WP is a popular Content Management System (CMS). Let’s dive into specific optimizations:
1. Optimization of JS files (Defer and Delay):
For WordPress sites, many plugins and themes load JavaScript, often leading to TBT issues.
Steps:
- Use WP Plugins: Plugins like WP Rocket or Autoptimize can automatically defer non-essential scripts.
- Manually Defer: Add defer attribute to script tags in your theme.
- Delay Execution: For non-essential scripts, consider using plugins that allow you to delay the execution until user interaction or a set time.
2. Optimization of CSS files:
Optimizing CSS delivery can speed up render times, impacting TBT.
Steps:
- Inline Critical CSS: Use tools or plugins to identify and inline critical path CSS, ensuring the most important styles load first.
- Defer Non-Critical CSS: Load non-essential styles asynchronously or after the main content.
- Minify CSS: WP plugins like Autoptimize can automatically minify your CSS.
3. URLs to prefetch:
Prefetching can speed up the loading of resources from third-party sites or other pages in your domain.
Steps:
- Identify Key Domains: Determine which third-party scripts or linked pages are frequently accessed.
- Use WP Plugins: Some caching or performance plugins allow you to set prefetch URLs easily.
- Manually Add Prefetch: In your theme’s header.php file, add lines like .
4. Preload fonts:
Web fonts can block rendering if not loaded efficiently. Preloading can ensure they’re available as soon as they’re needed.
Steps:
- Identify Essential Fonts: Determine which fonts are critical for the initial render.
- Use the Preload Attribute: In your theme, add lines like .
- WP Font Plugins: Plugins like WP Rocket have font optimization features that can automate this process.
By implementing these optimizations, especially on WordPress sites, you can drastically improve your TBT score, leading to a significantly enhanced user experience.
Achieving Excellent Performance Results
Achieving excellent performance results for a website isn’t a one-time task but a continuous effort that integrates best practices, optimization techniques, and regular performance audits. Improving website performance enhances user experience, improves SEO rankings, and can even have a positive impact on conversion rates. Here’s how you can strive for and achieve superior performance outcomes:
1. Establish Performance Benchmarks:
- Baseline Metrics: Before making optimizations, assess where you currently stand. Tools like Google PageSpeed Insights, WebPageTest, and GTmetrix can provide comprehensive performance reports.
- Set Targets: Based on your initial assessments, establish achievable targets for metrics like Total Blocking Time, Time to First Byte, First Contentful Paint, and Cumulative Layout Shift.
2. Prioritize Content Delivery:
- Content Delivery Network (CDN): Utilize CDNs like Cloudflare or Akamai to ensure rapid content delivery irrespective of the geographical location of your users.
- Optimize Images: Use next-gen formats like WebP, implement responsive images with the srcset attribute, and compress images without losing quality.
3. Streamline Code:
- Minify & Compress: Use tools and plugins to minify CSS, JavaScript, and HTML. Implement GZIP or Brotli compression to reduce the file size of resources.
- Eliminate Unnecessary Libraries/Plugins: Audit the libraries and plugins you use. Remove those that aren’t necessary and search for lightweight alternatives.
4. Implement Advanced Web Technologies:
- HTTP/3: Utilize the HTTP/3 protocol, which offers enhanced performance benefits over its predecessor, HTTP/2.
- Service Workers: Use service workers for caching strategies, providing a boost in loading speeds, especially for returning visitors.
5. Regular Monitoring & Audits:
- Performance Monitoring Tools: Tools like New Relic, Dynatrace, or LogRocket can help monitor real-time performance and user experiences.
- Routine Audits: Monthly or quarterly audits using Lighthouse or similar tools can help in identifying new areas of optimization and ensuring that performance remains top-notch.
6. Optimize Server Performance:
- Server Response Time: Opt for high-performance hosting, reduce server processing time, and implement server caching.
- Database Optimization: Regularly clean and optimize your database, especially if you’re using systems like WordPress. Plugins like WP-Optimize can be handy.
7. Prioritize Mobile Performance:
- Responsive Design: Ensure your website is mobile-responsive. Google’s Mobile-Friendly Test can provide insights.
- AMP (Accelerated Mobile Pages): Consider implementing AMP for near-instant mobile loading times, especially if you’re in the publishing industry.
8. Engage & Educate Your Team:
- Performance Culture: Foster a culture where performance is a priority. This can involve regular training sessions or workshops.
- Stay Updated: The web is ever-evolving. Stay updated with the latest in web performance techniques, metrics, and best practices.
Achieving excellent performance is a mix of technology, best practices, and regular attention. By optimizing both the front and back ends of your website and staying updated with the latest trends, you can ensure consistently superior performance results.
Website Speed Test to Check Page Speed for Entire Website or Specific Page
The Website Speed Test tool by Sitechecker is a crucial instrument for webmasters and website owners aiming for optimal site performance. In an age where milliseconds can influence user decisions, ensuring your website loads swiftly is paramount. This tool offers a real-time evaluation, swiftly determining how your site performs and highlighting areas that might be hampering its speed.
Beyond just a basic speed check, the tool delves deep, providing users with a detailed breakdown of each element affecting load time. Whether it’s large media files, server delays, or uncompressed scripts, this tool identifies the culprits and provides actionable suggestions to rectify these issues. The intuitive interface and comprehensive insights make it a must-have for anyone serious about website optimization.
Unlock Peak Website Performance!
Discover what's holding you back and optimize it for the best user experience.
Conclusion
Website performance is an essential aspect of today’s digital landscape, influencing both user experience and search engine rankings. As we delved into metrics like Total Blocking Time (TBT) and the various intricacies of optimization, it became evident that performance enhancement is a continuous endeavor. With the ever-evolving web, staying updated, conducting regular audits, and maintaining a user-centric focus are paramount. In essence, optimizing your website is not just about meeting benchmarks; it’s about ensuring your users have the best experience possible. Here’s to a web that’s faster, more efficient, and continually user-friendly.