



1. AI Chat Visibility
You can now track how your brand shows up in AI chat answers, see how your competitors rank and see the actual AI outputs.
It covers ChatGPT, Gemini, Perplexity, Google AI Mode, and Copilot. You set up prompts, we run them every day, and you see when your brand gets mentioned, which sources get cited, and how you stack up against competitors.
How tracking works
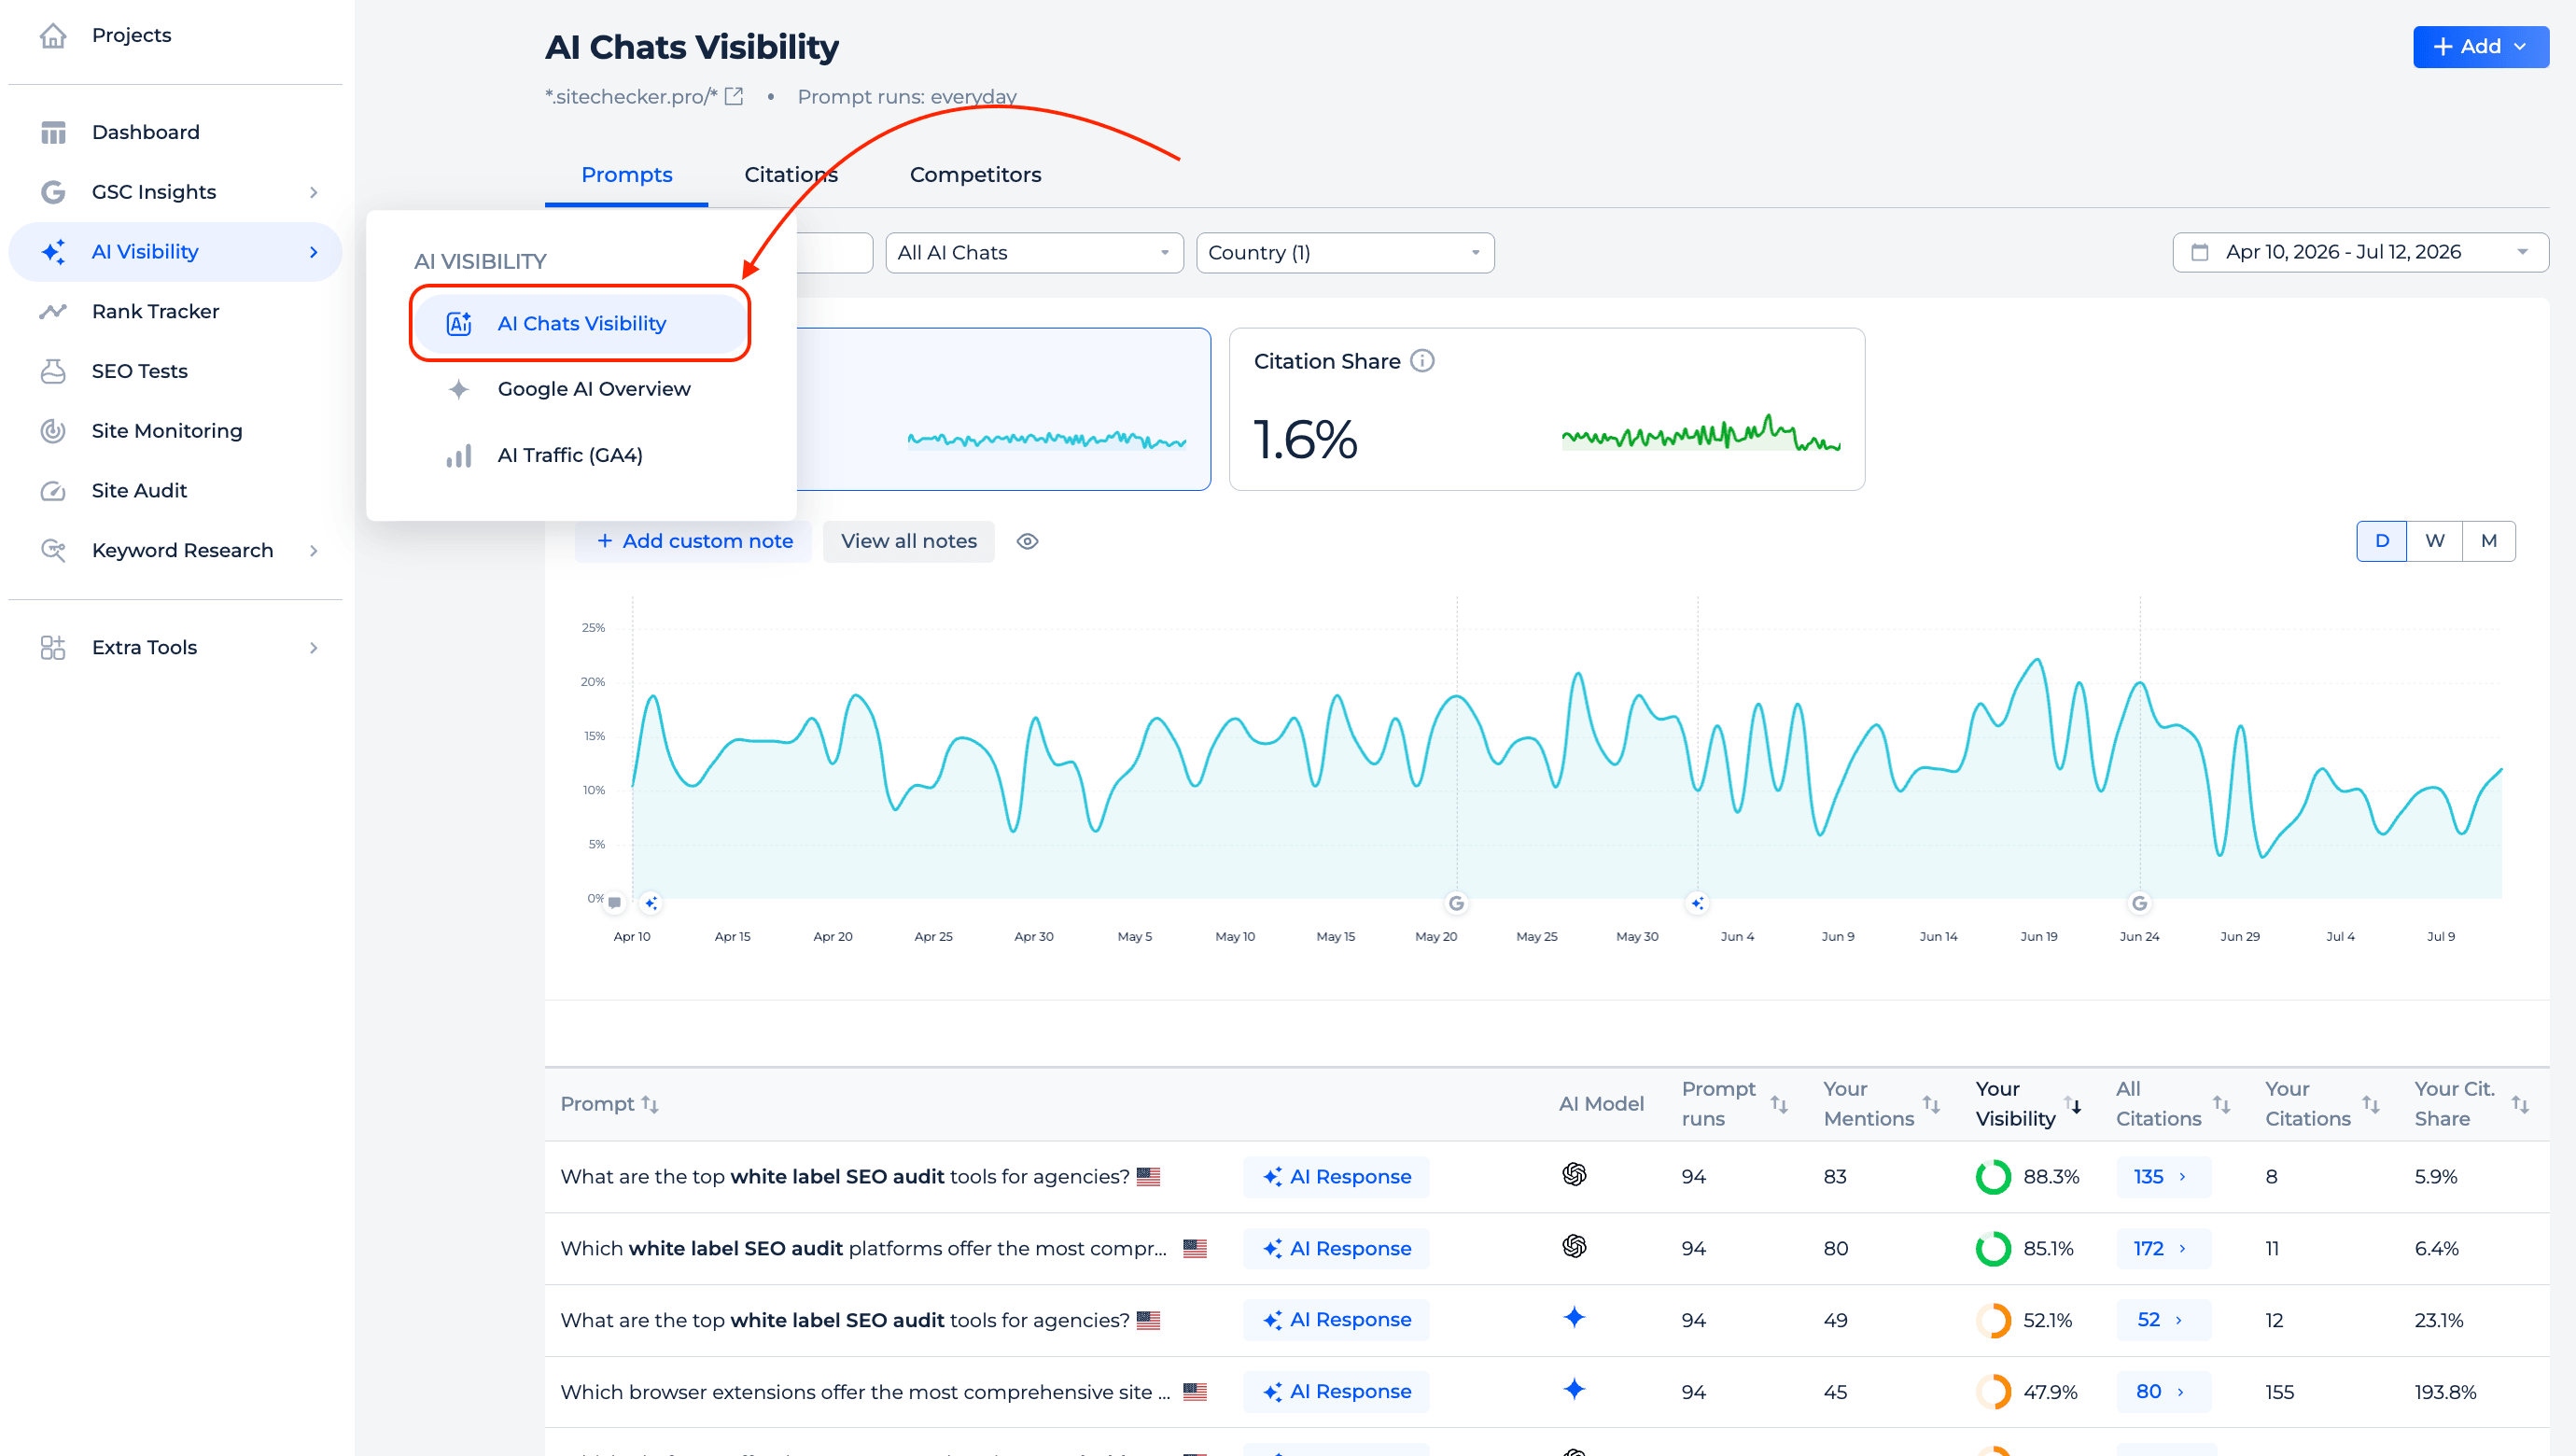
Add keywords with strong search volume and we generate prompts for each one, or pick from suggestions. You can also add your own prompts.
Each prompt runs once a day for every AI model you select.
You can track a prompt on one model or all five, and narrow it down to a specific region. Data from every model rolls up into your overall visibility and citation numbers, and you can filter any tab down to a single model when you need to.
Prompts tab
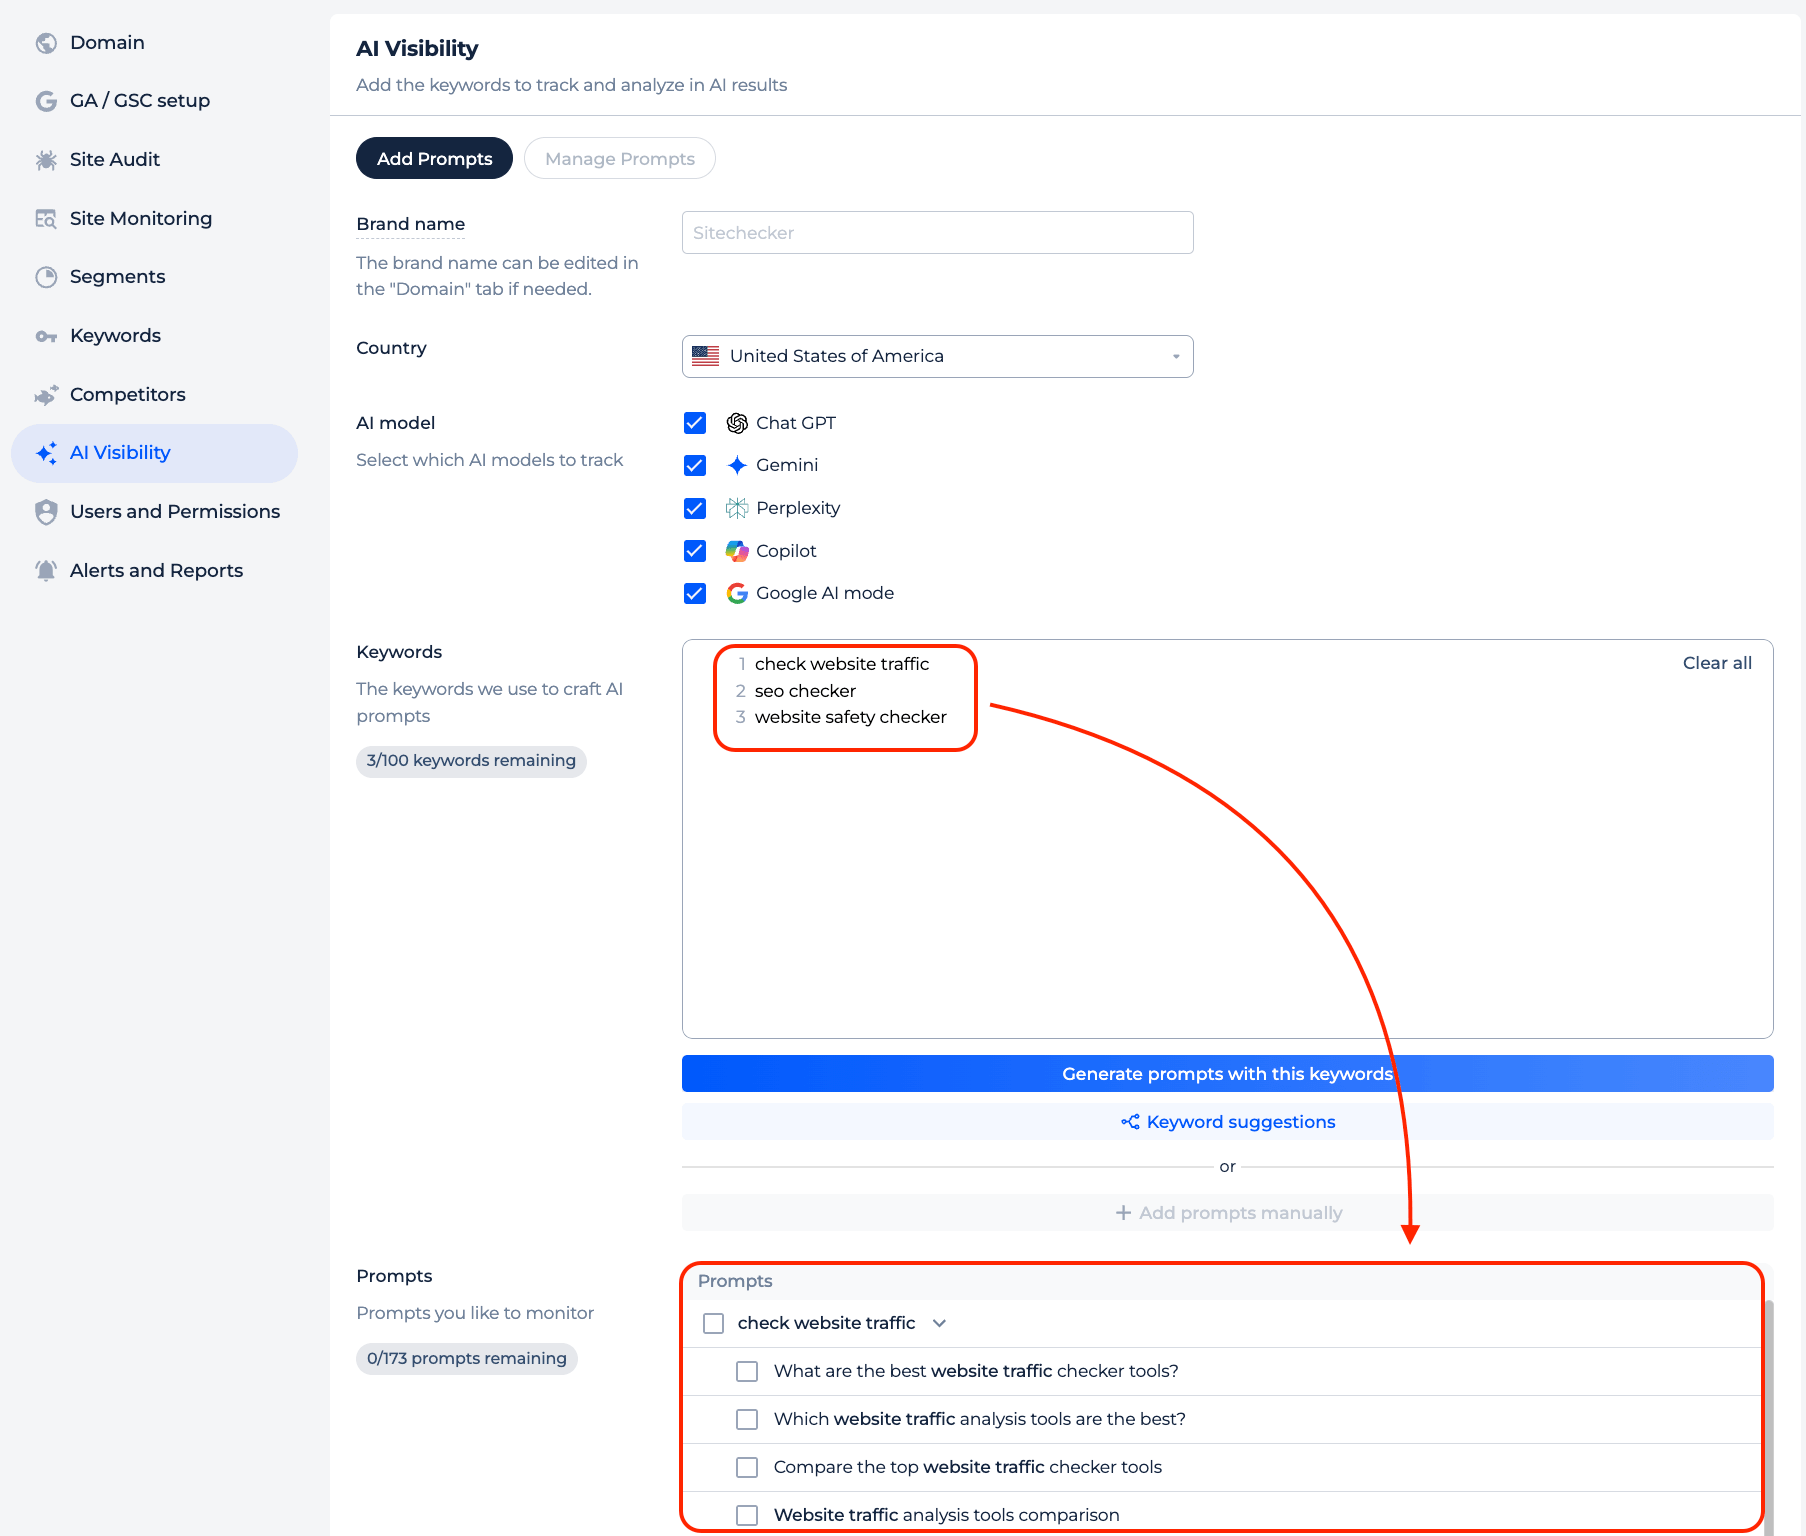
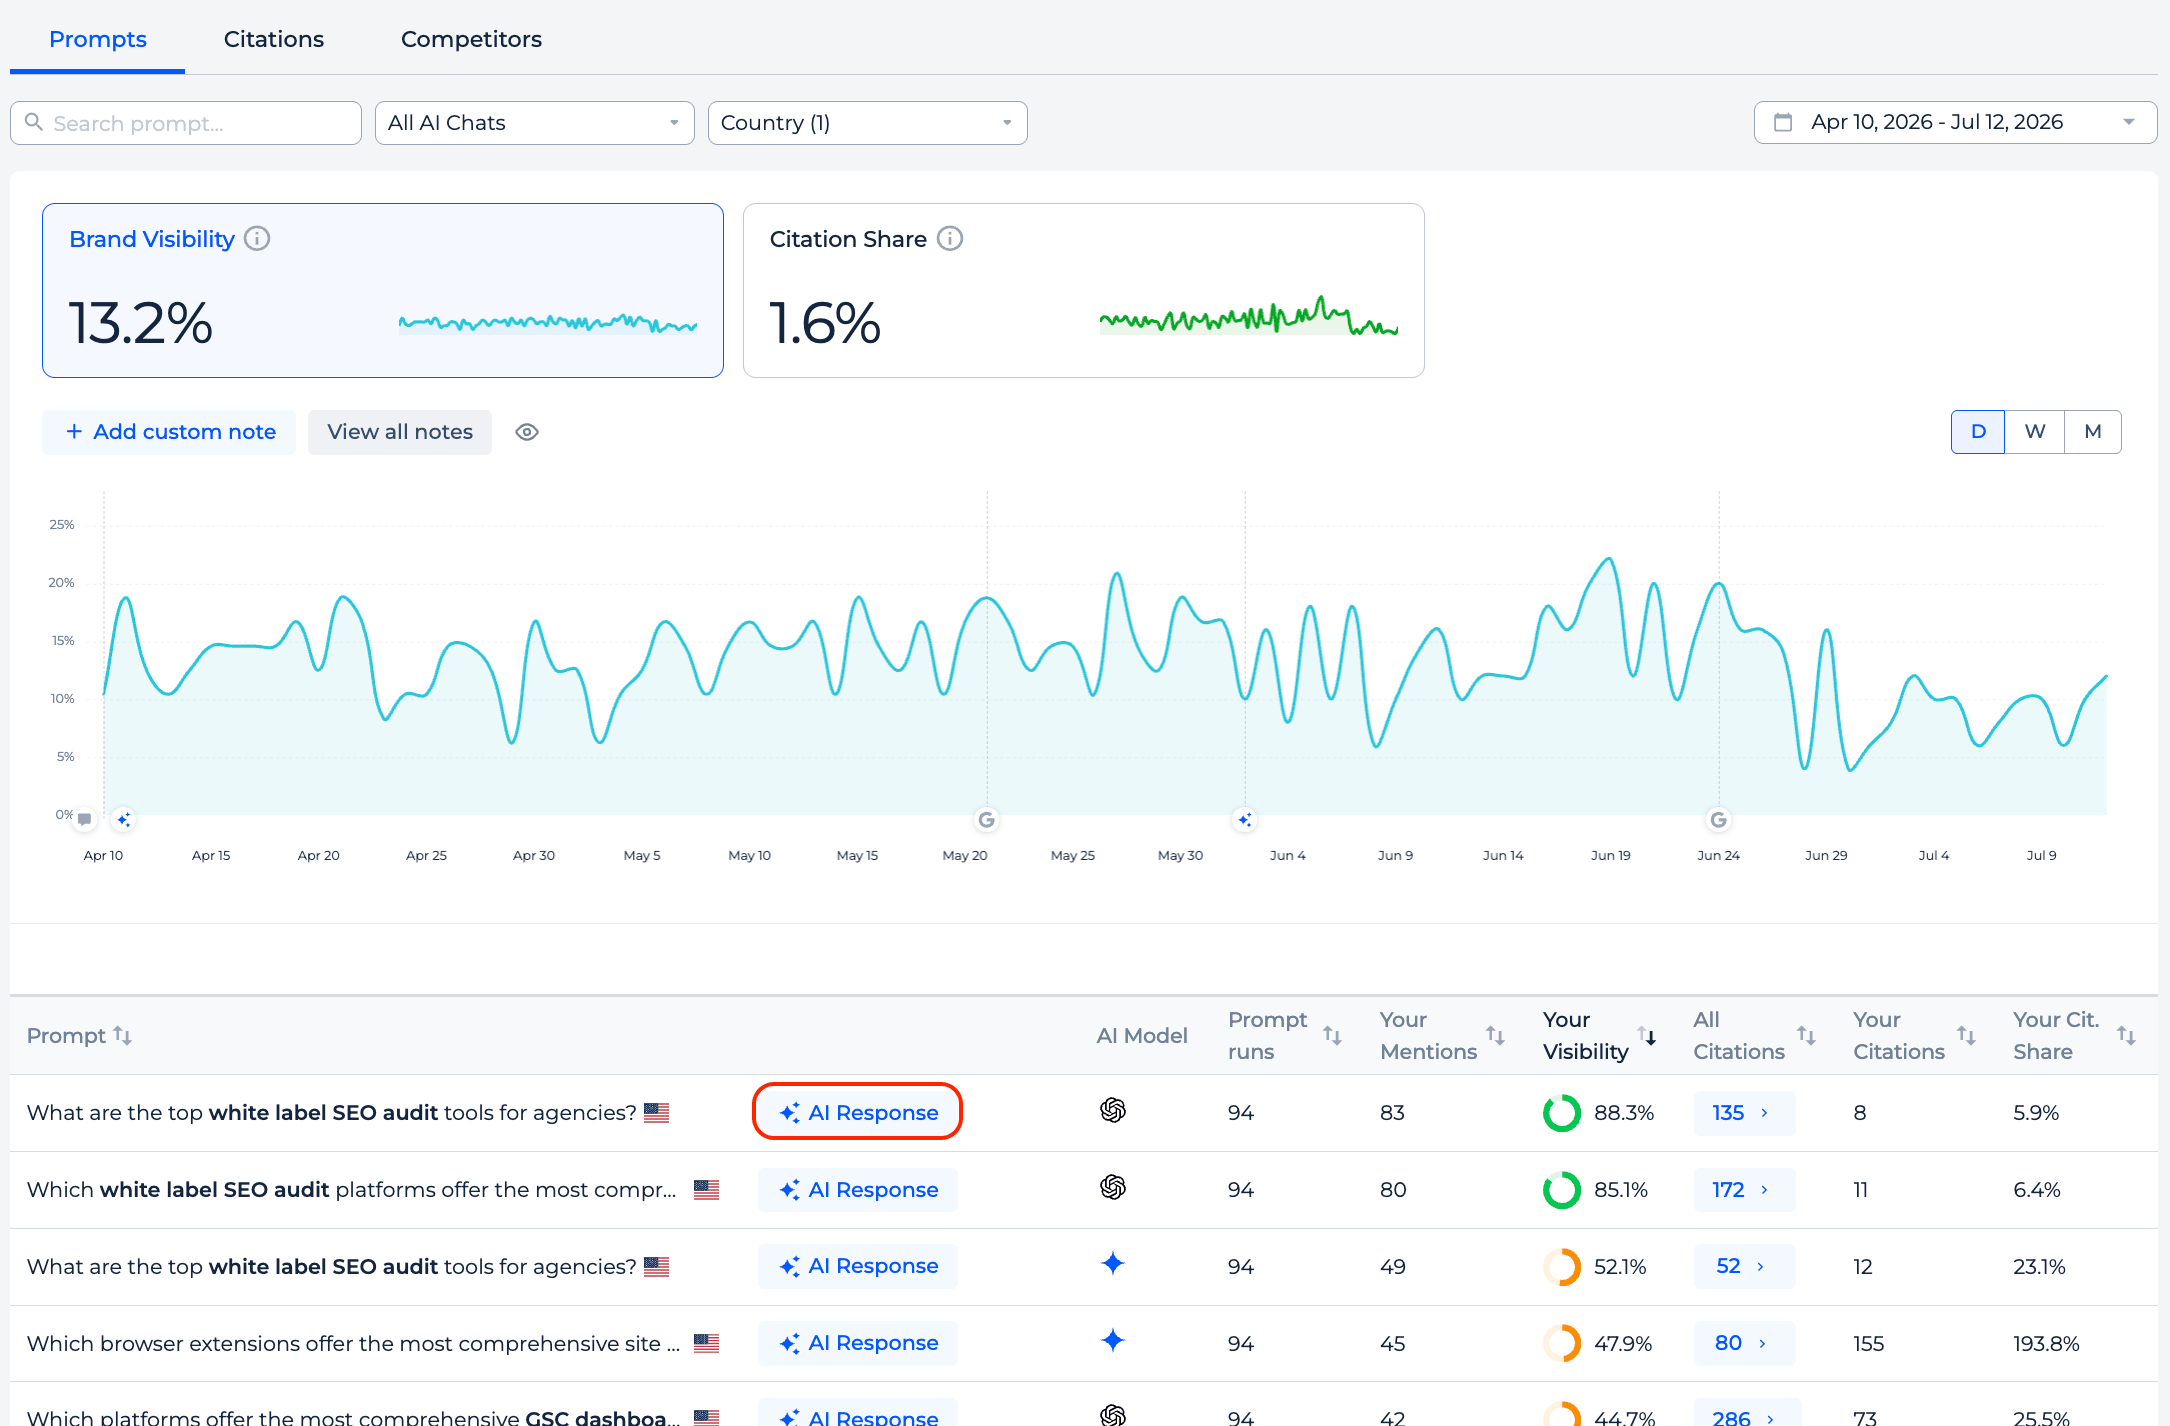
This is where you see every prompt you track: how many times it ran over the selected period, how many runs mentioned your brand, and your visibility.
For any prompt you can open the exact answer the AI gave, with the full citation list and a count of how many citations point to your domain.
Citations tab
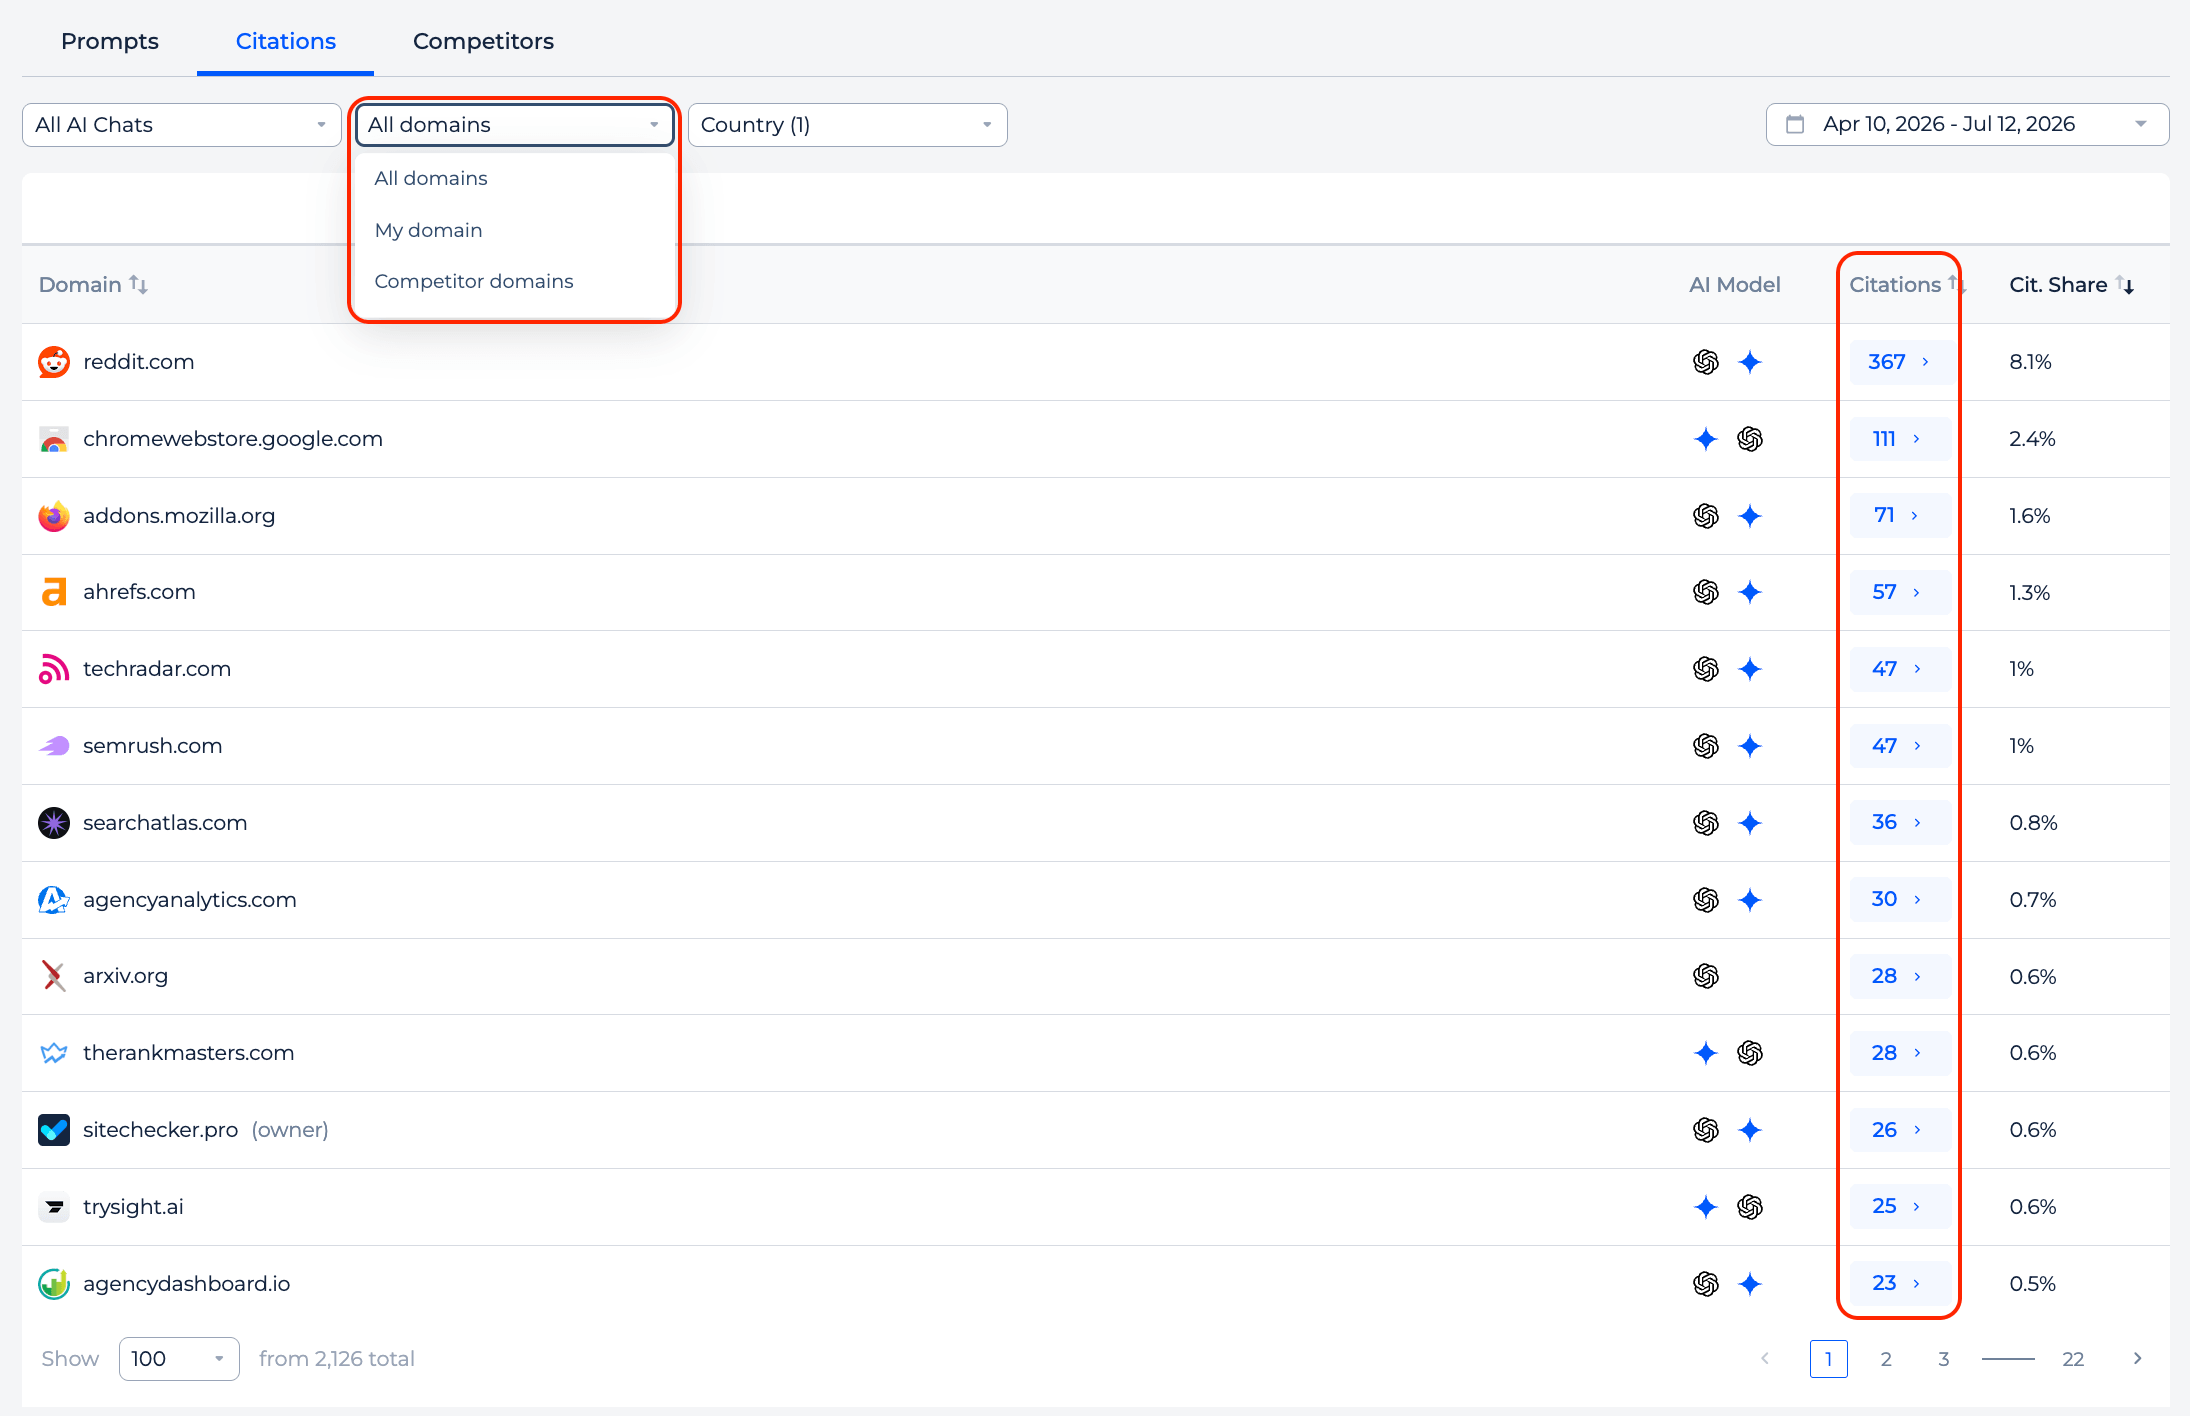
Every source cited across your AI answers, grouped by domain. For each domain you see total citations, how many belong to it, its share of all citations, and its average citation position.
Expand a domain to see which prompts those citations came from. You can filter the list to all domains, just yours, or just your competitors’.
Competitors tab
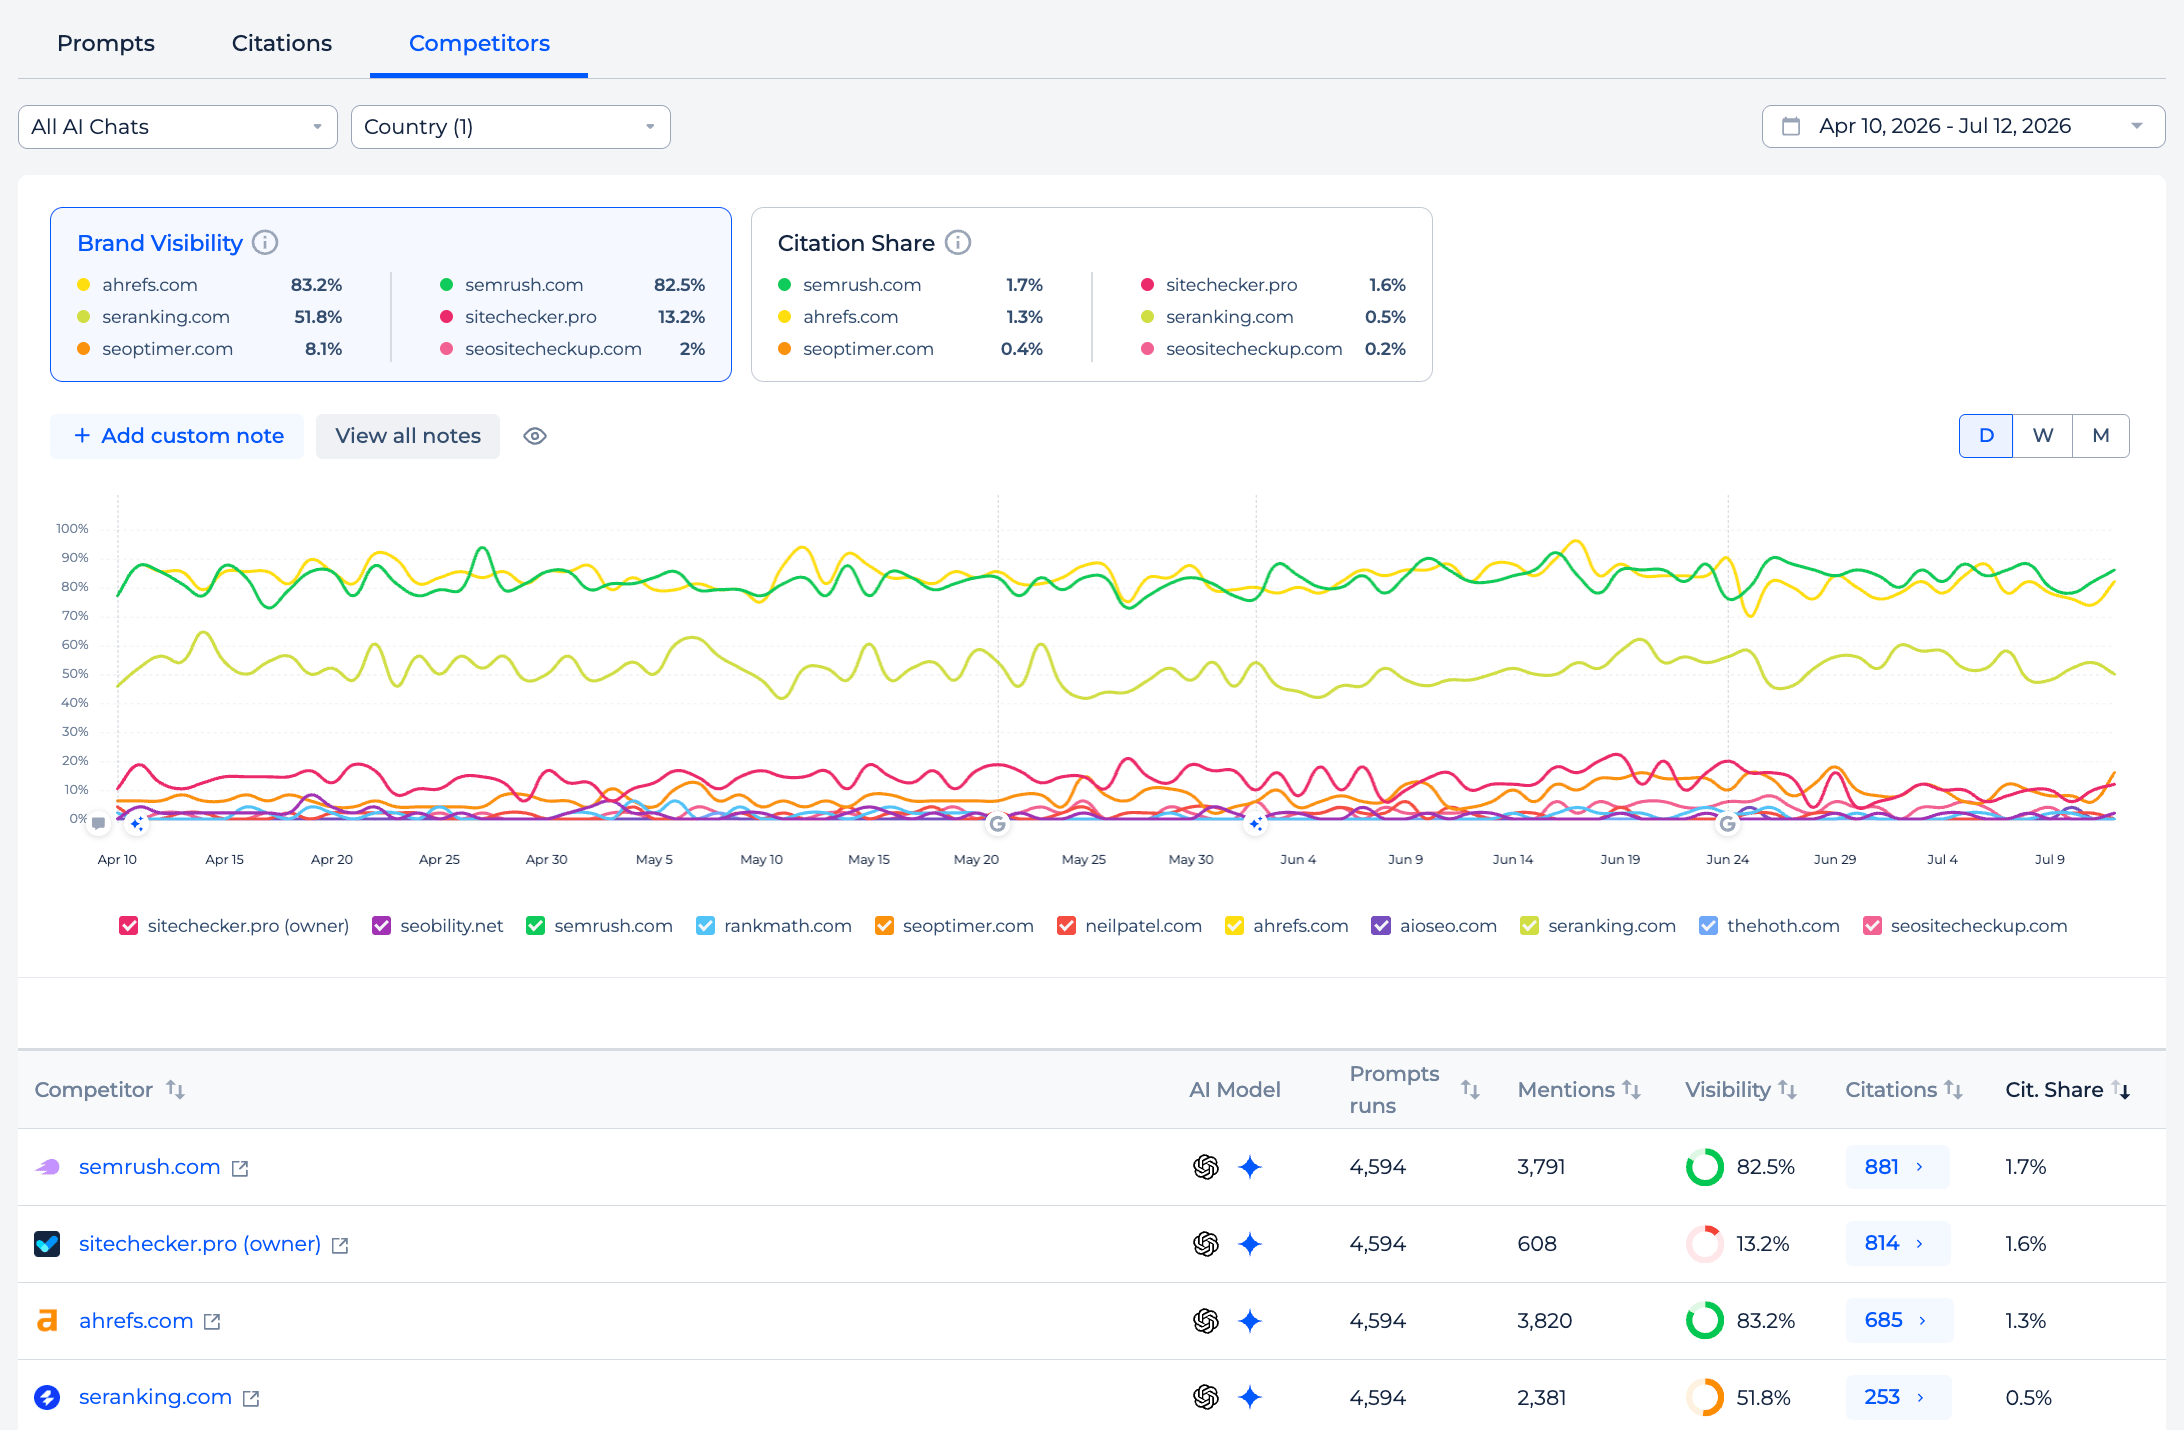
The same logic, grouped by competitor brand. For each competitor you see how often they were mentioned and how often you were mentioned within the same prompts, side by side. So you’re not just seeing that a competitor showed up, you see exactly where you stand in those conversations.
Dashboard widget
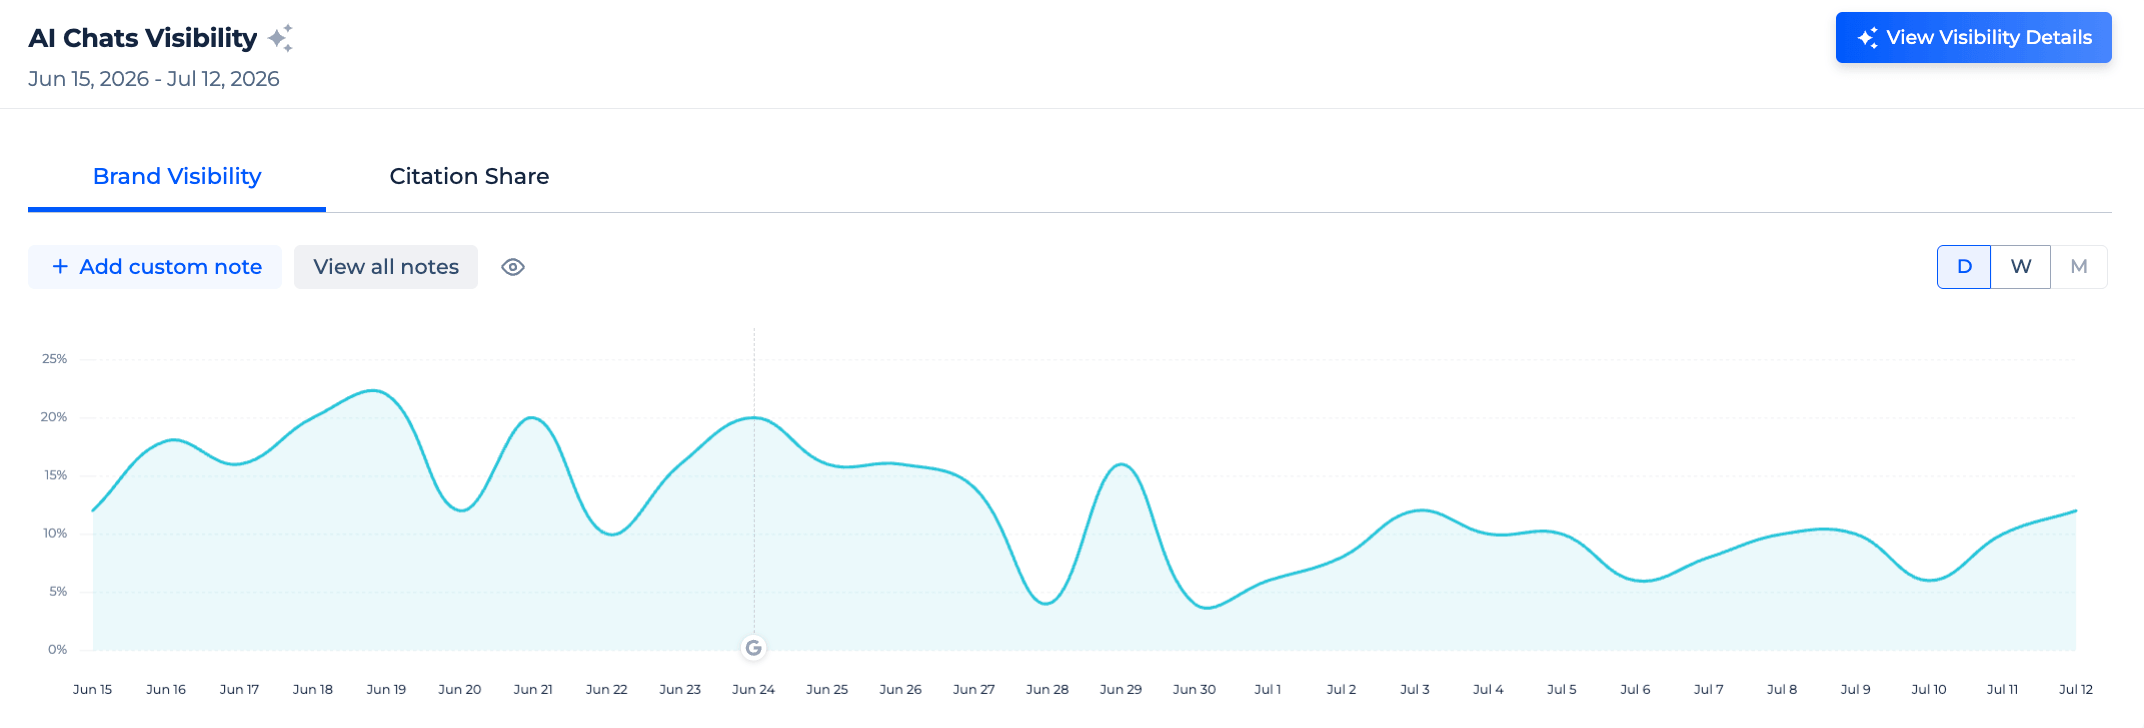
There’s also a new large widget on the Dashboard with brand visibility and citation share trends, switchable by day, week, or month, with custom notes. A quick health check without opening the full report.
2. SEO Tests
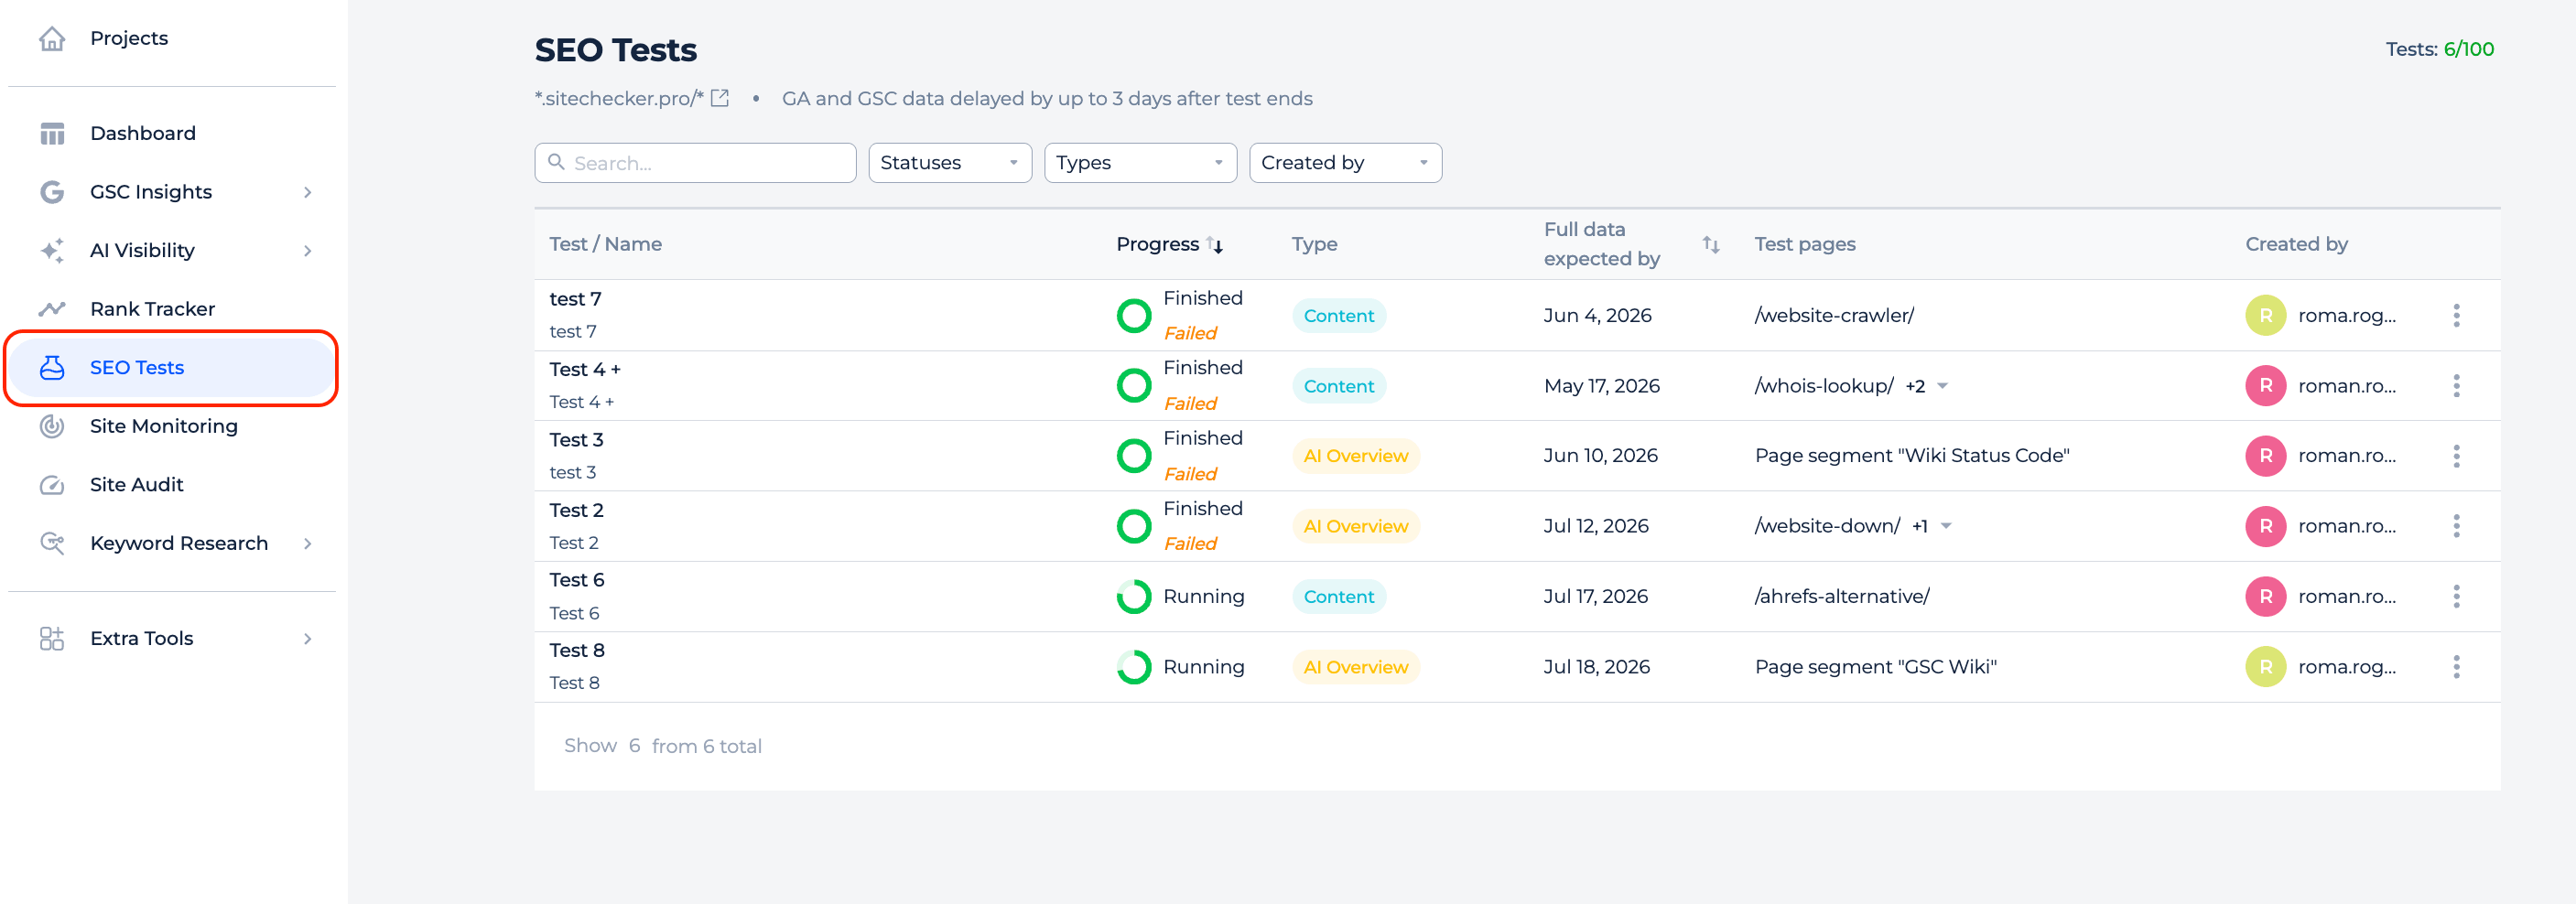
SEO Tests is a new tool that helps you measure the real impact of your SEO changes.
Instead of guessing whether a title rewrite, new internal links, or a technical fix actually helped, you set up a test and Sitechecker compares performance before and after the change.
All tests live in one shared log per project, so your whole team can see what’s being tested, who’s running it, and what the result was.
Two types of tests
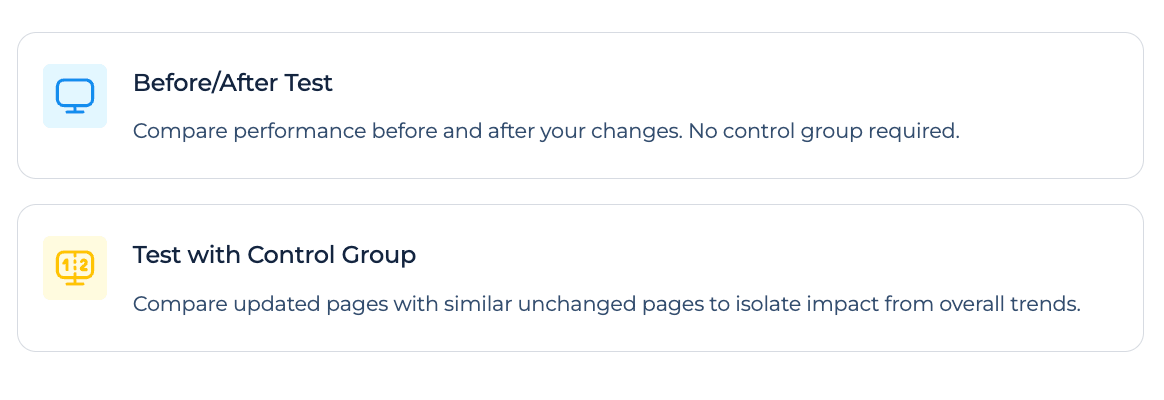
Before / After Test compares your pages during the test period against a matched period right before it. It’s the standard option and works for most changes.
Test with Control Group adds a second set of pages you didn’t touch. This is the better fit for bigger or longer tests, where seasonality or a Google update could skew your results.
For control group tests, success is measured against the net change, the real effect of your work once the background trend is removed.
Setup: scope, metrics, and goal
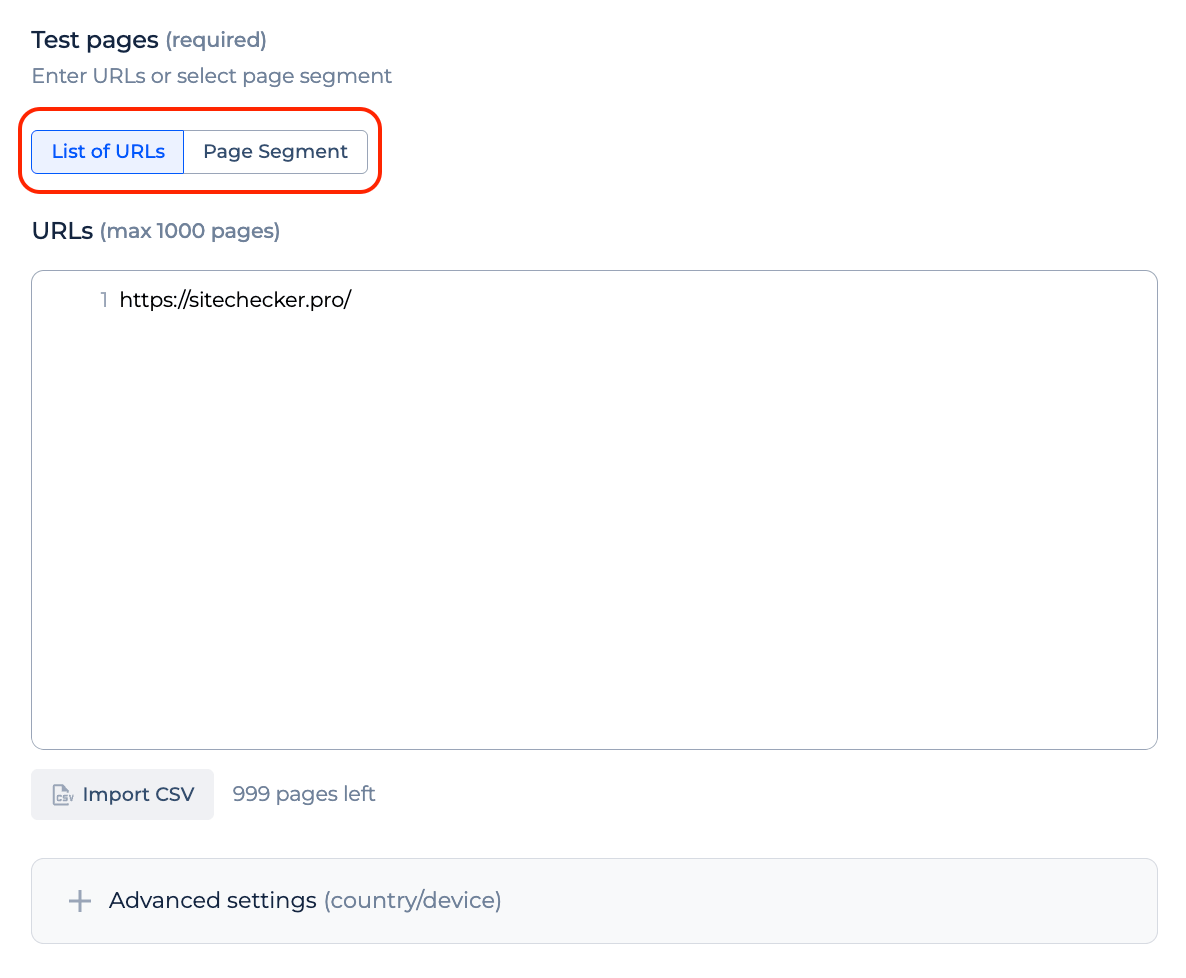
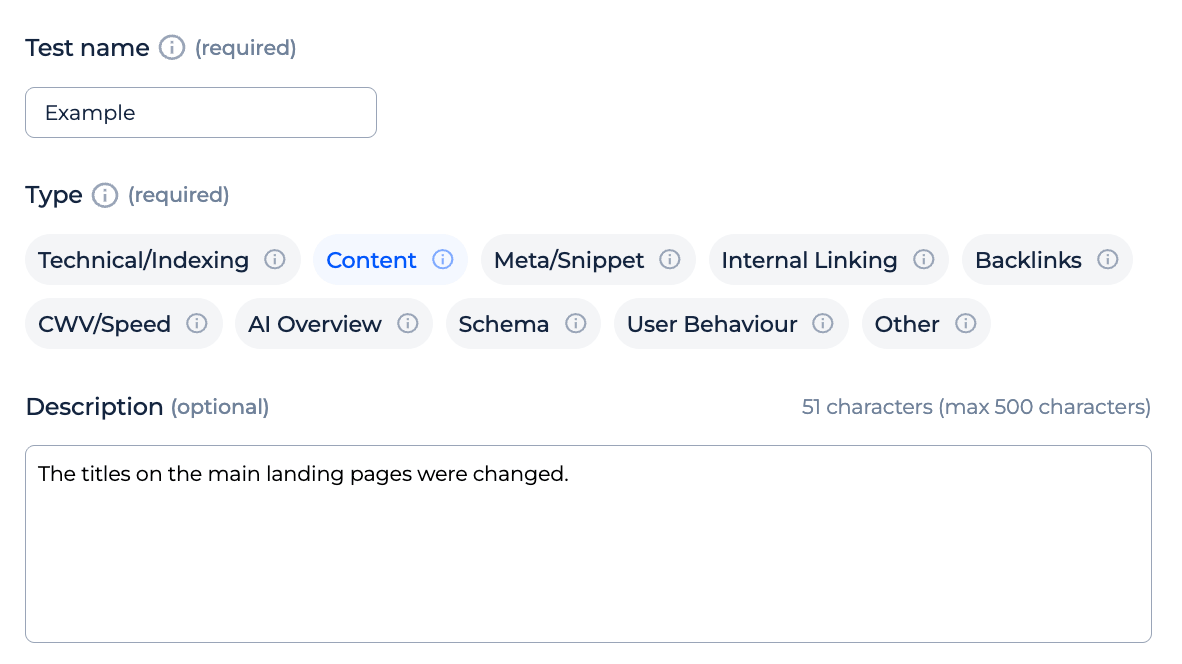
You choose the pages you changed, through a list of URLs or an existing segment, set the test period, and pick the metrics you care about.
Tests are built on your Google Search Console data, and you can add GA4 metrics like sessions and key events on top for a fuller picture.
Results page
Each test gets its own page with metric cards, a chart covering both periods on one timeline, and Pages and Keywords tables showing values for both periods and the difference.
The comparison period is matched automatically: same length as your test and aligned by day of the week, so weekends line up with weekends and the comparison stays fair.
For control group tests, you see the test group change, the control group change, and the net change side by side once the test is finished.
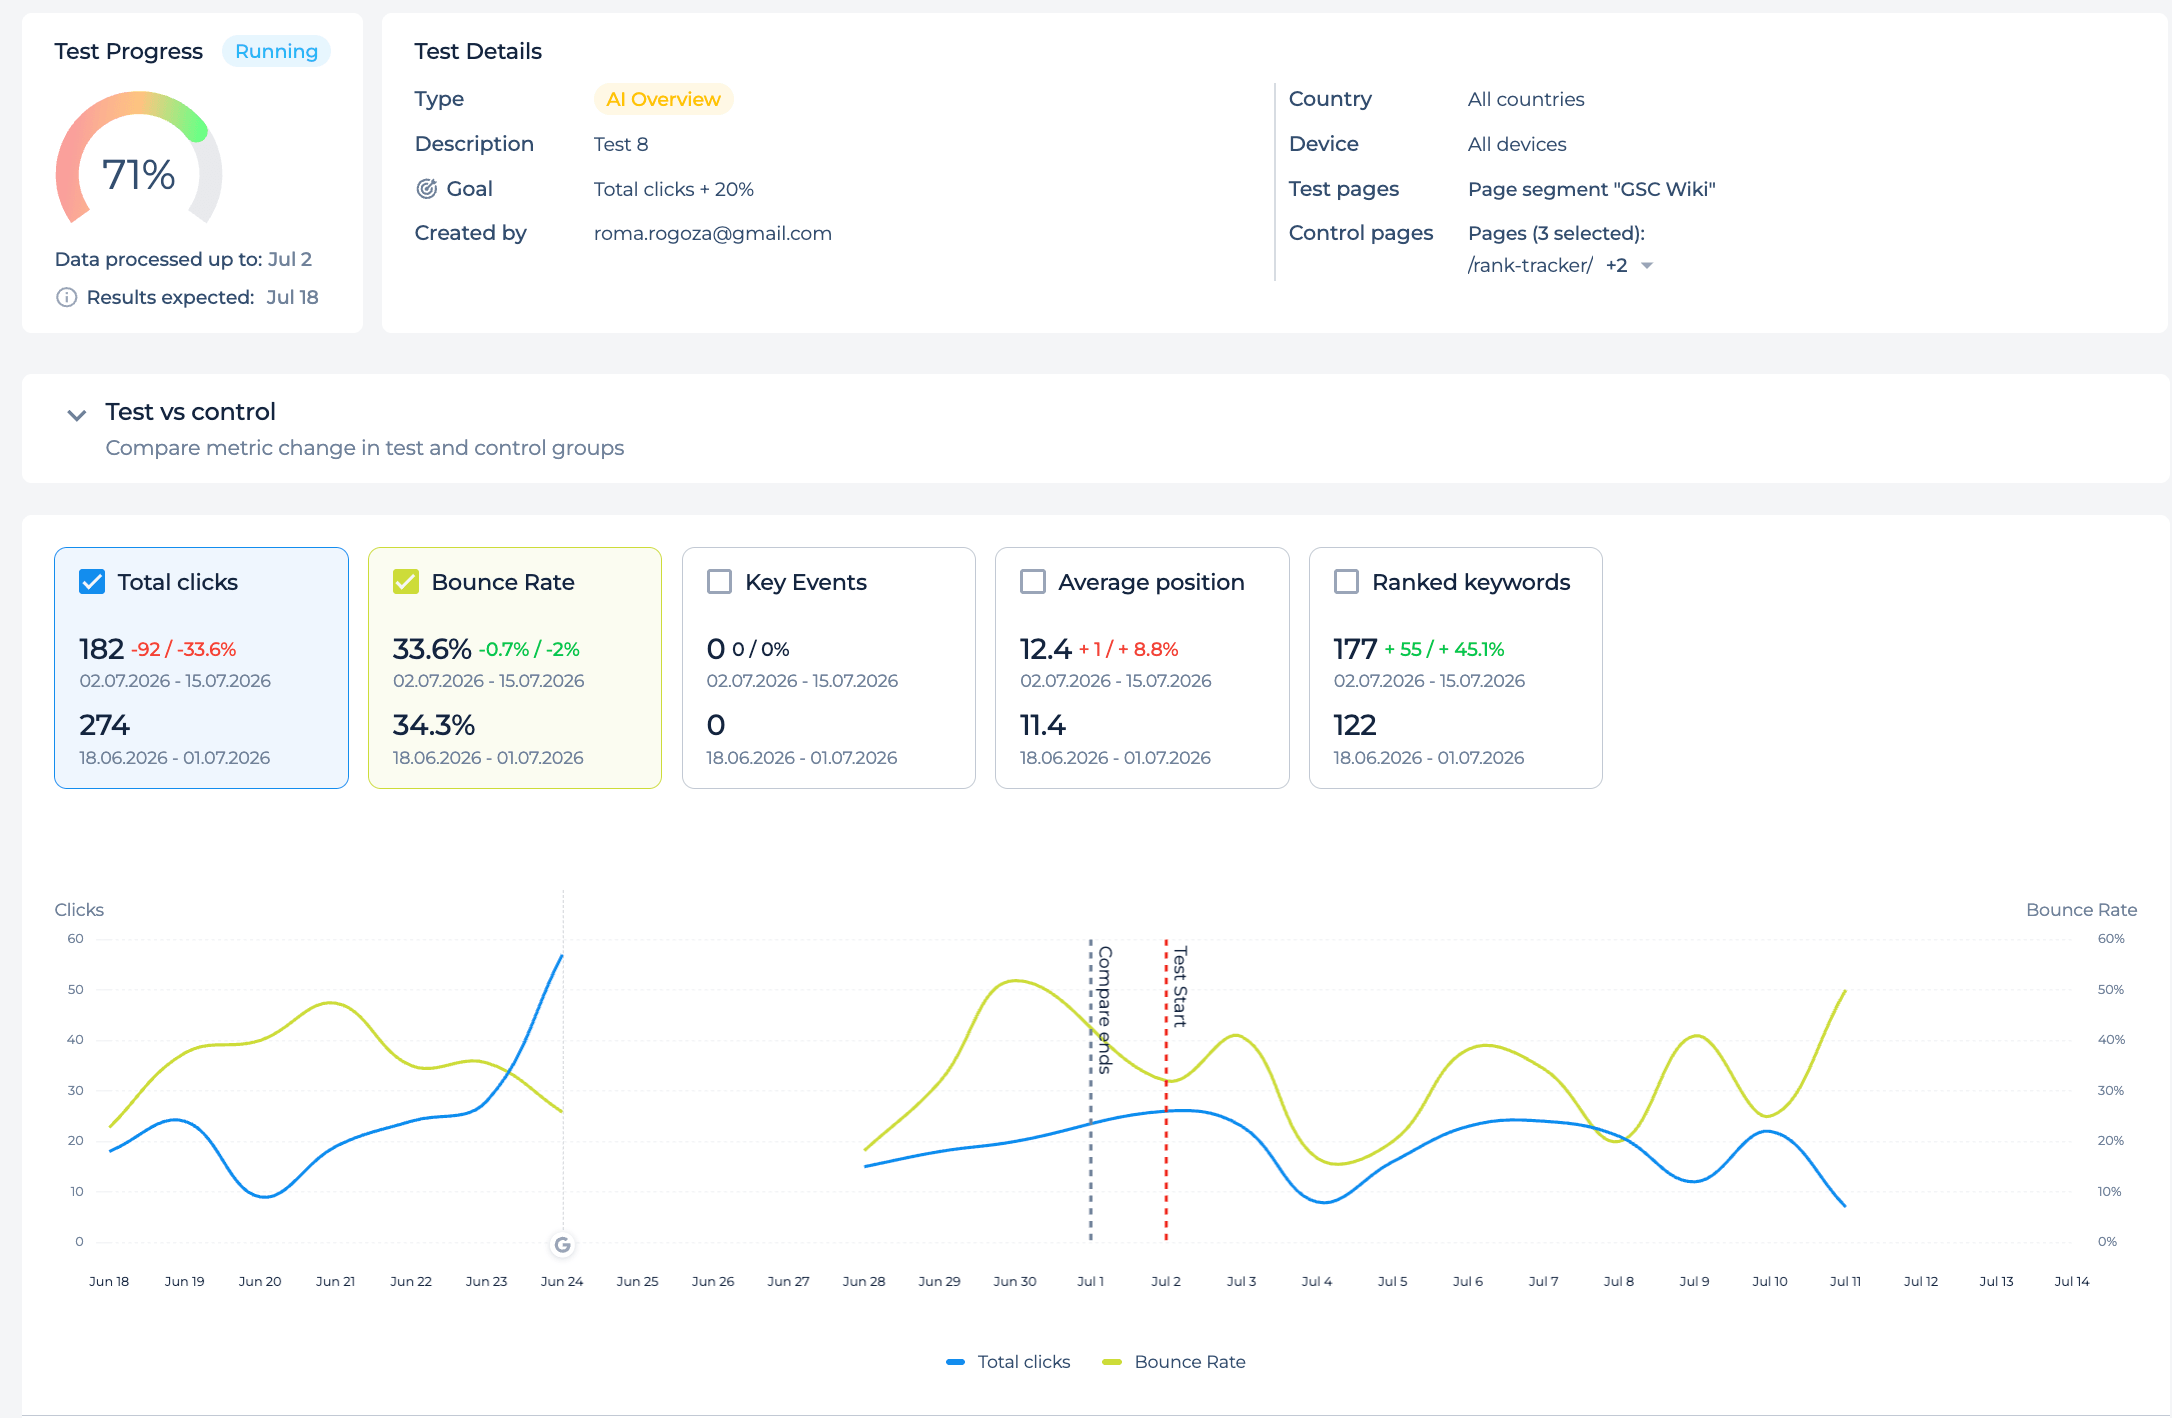
And when results are ready, you get an email with a link straight to the test page.
3. New dashboard widgets for GA4 and AI traffic
The project Dashboard got a batch of new widgets, so you can watch GA4 and AI performance without opening full reports.
Small widgets
Five new small widgets are available: AI Chats Sessions, Bounce Rate, Avg. Session Duration, Key Events, and Sess. Key Event Rate.

Large widgets
Channel Performance breaks down sessions and engagement across Organic Search, AI Chats, and everything else, so you see where your traffic actually comes from.
Organic Channels, the updated Google Analytics widget, charts All Sessions, google/organic sessions, and AI Chats sessions together over time.
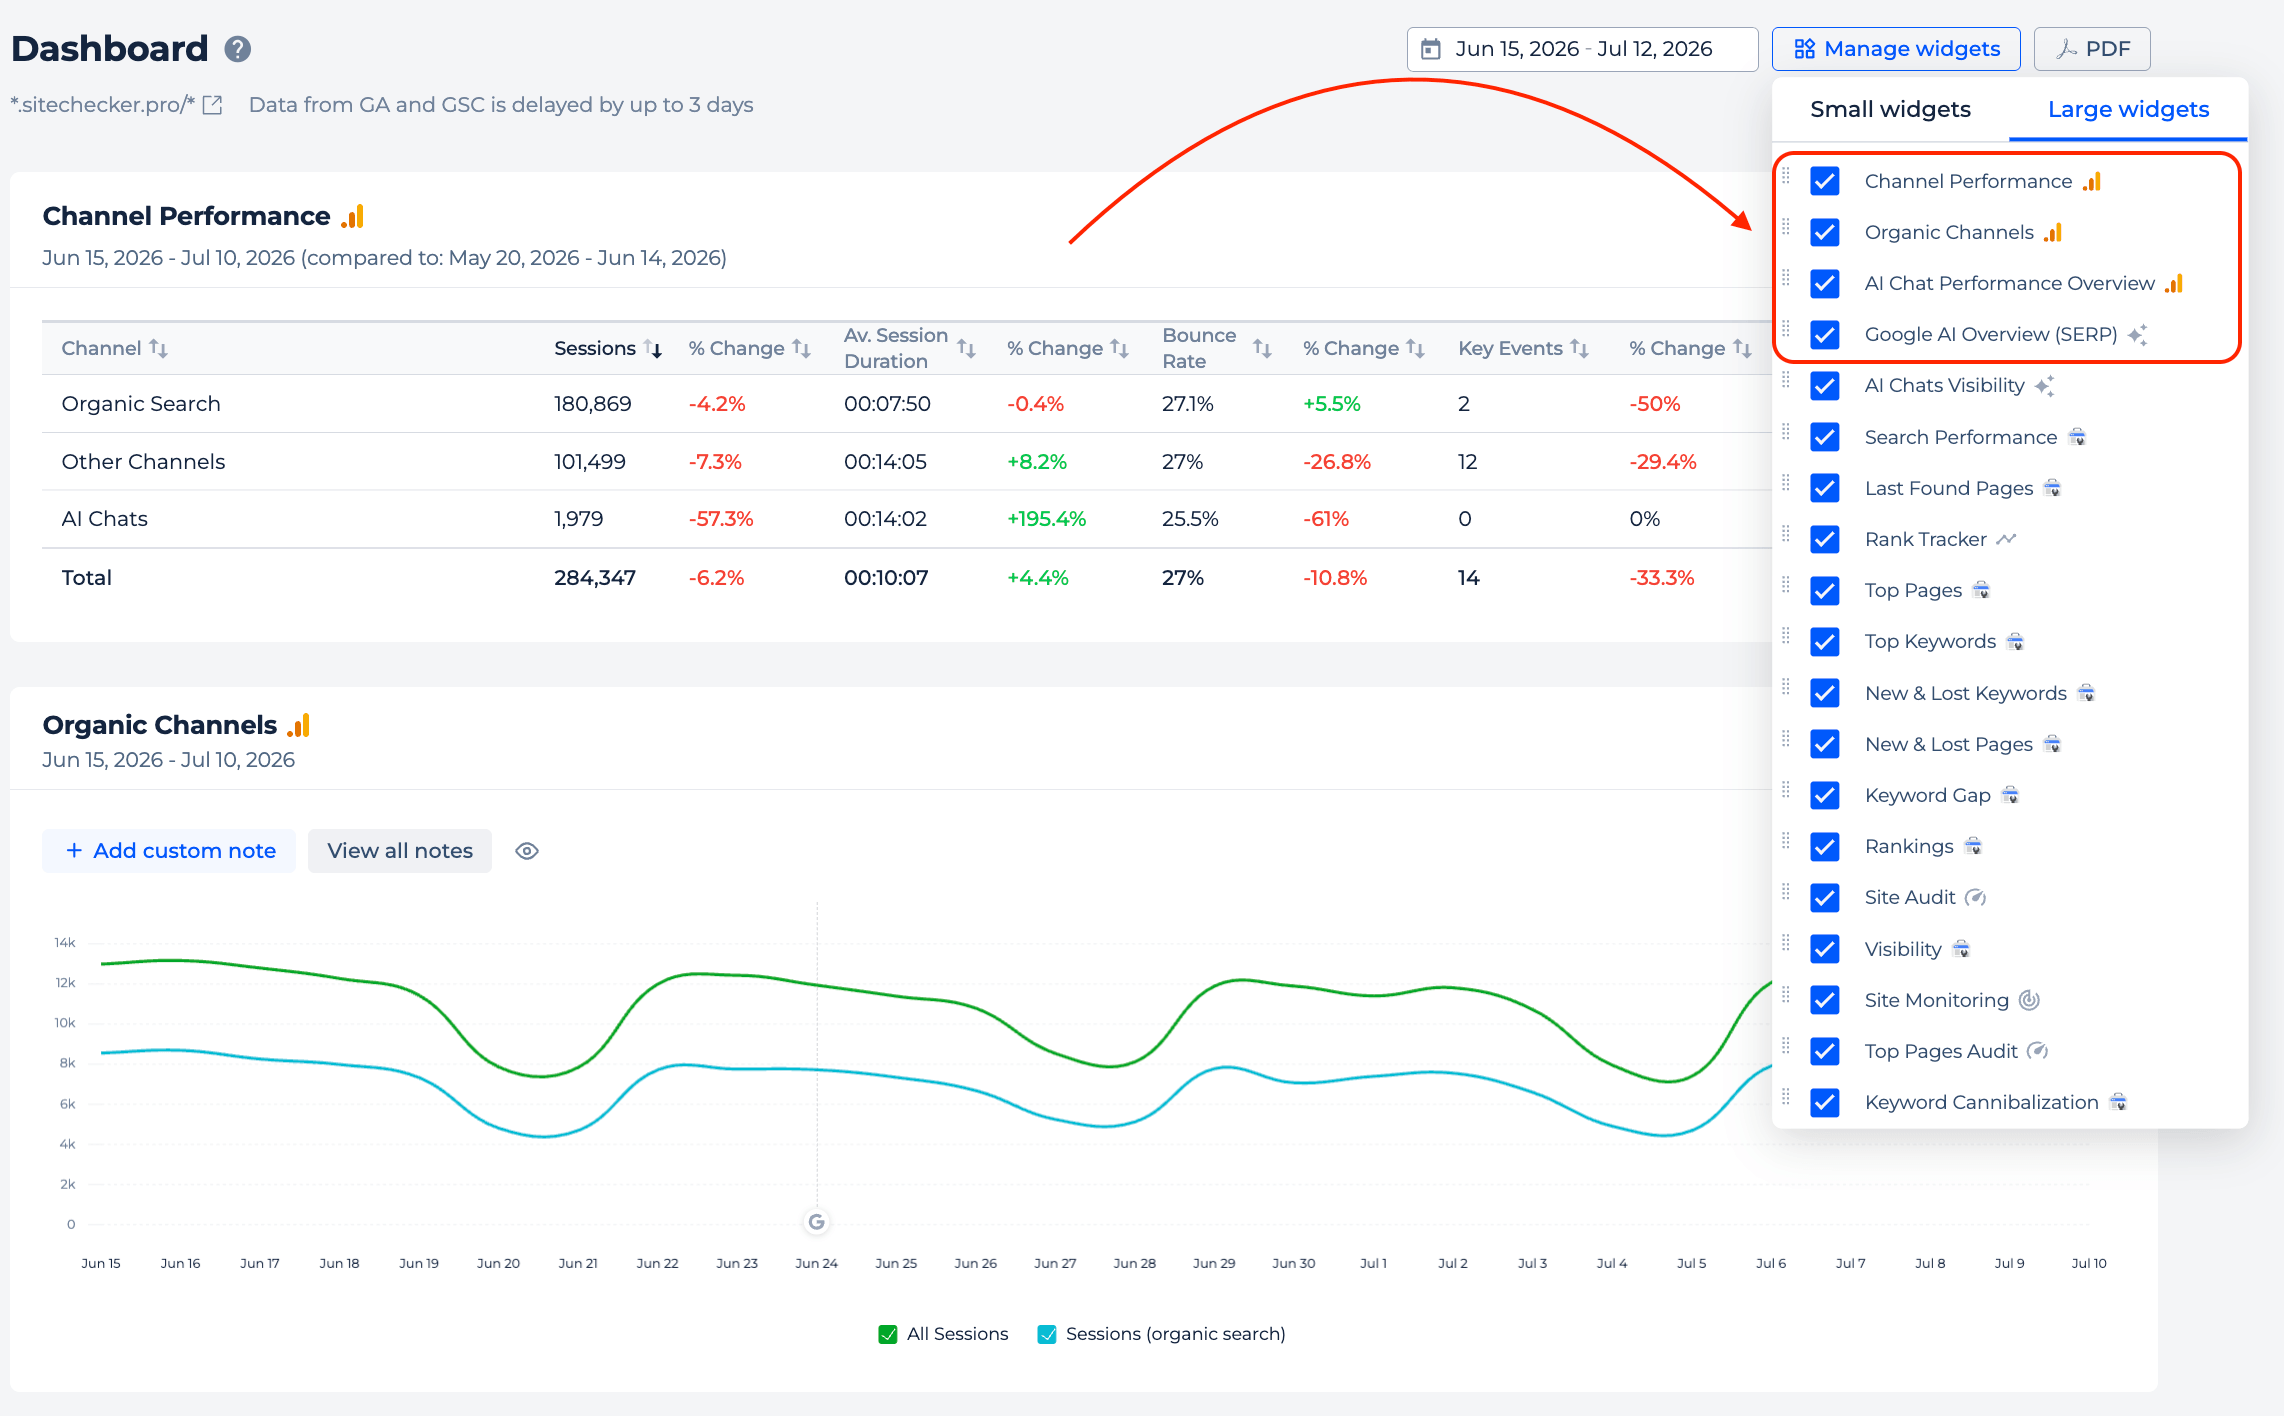
AI Chats Performance overview tracks sessions, bounce rate, key events, and more, for all AI chat sources or just the ones you pick.
Google AI Overview (SERP) gives you a quick read on your AI Overview share and visibility, with a shortcut into the full report.
4. Project List updates
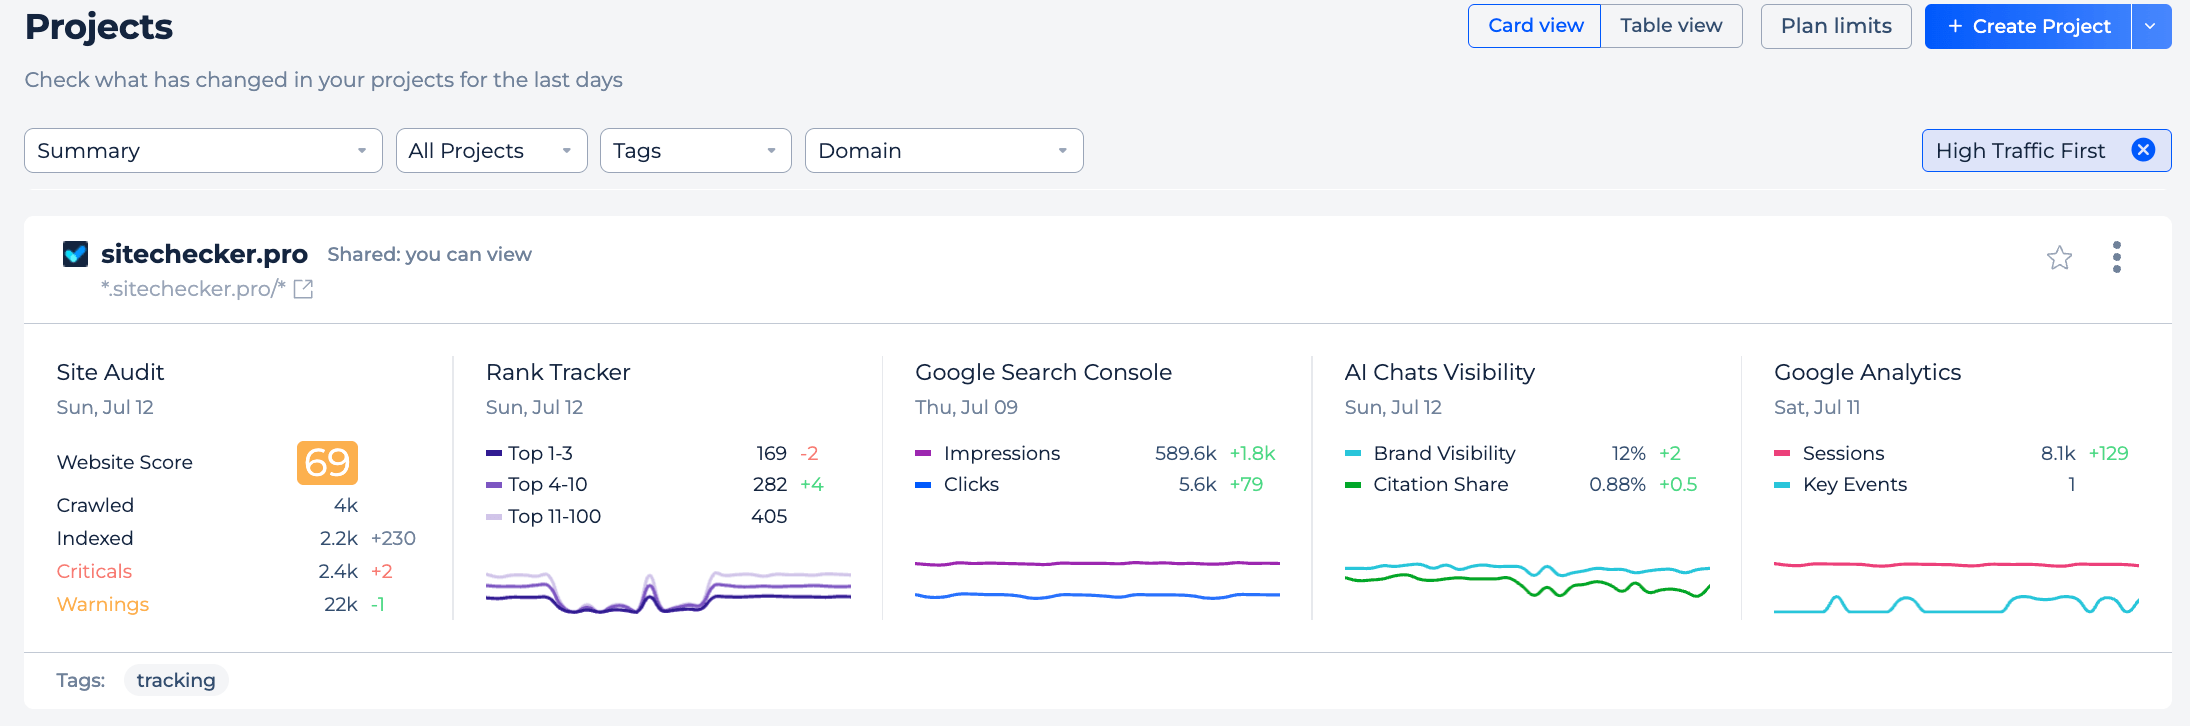
The Project List now surfaces more data per project, in both card and table view.
New and updated cards
Card view gets a new AI Chat Visibility card. It shows your brand visibility and citation share for the last available day, each with a day over day change and a 30 day trend.
The Google Analytics card was also updated and now shows Sessions and Key events instead of all traffic and organic traffic.
New table view columns
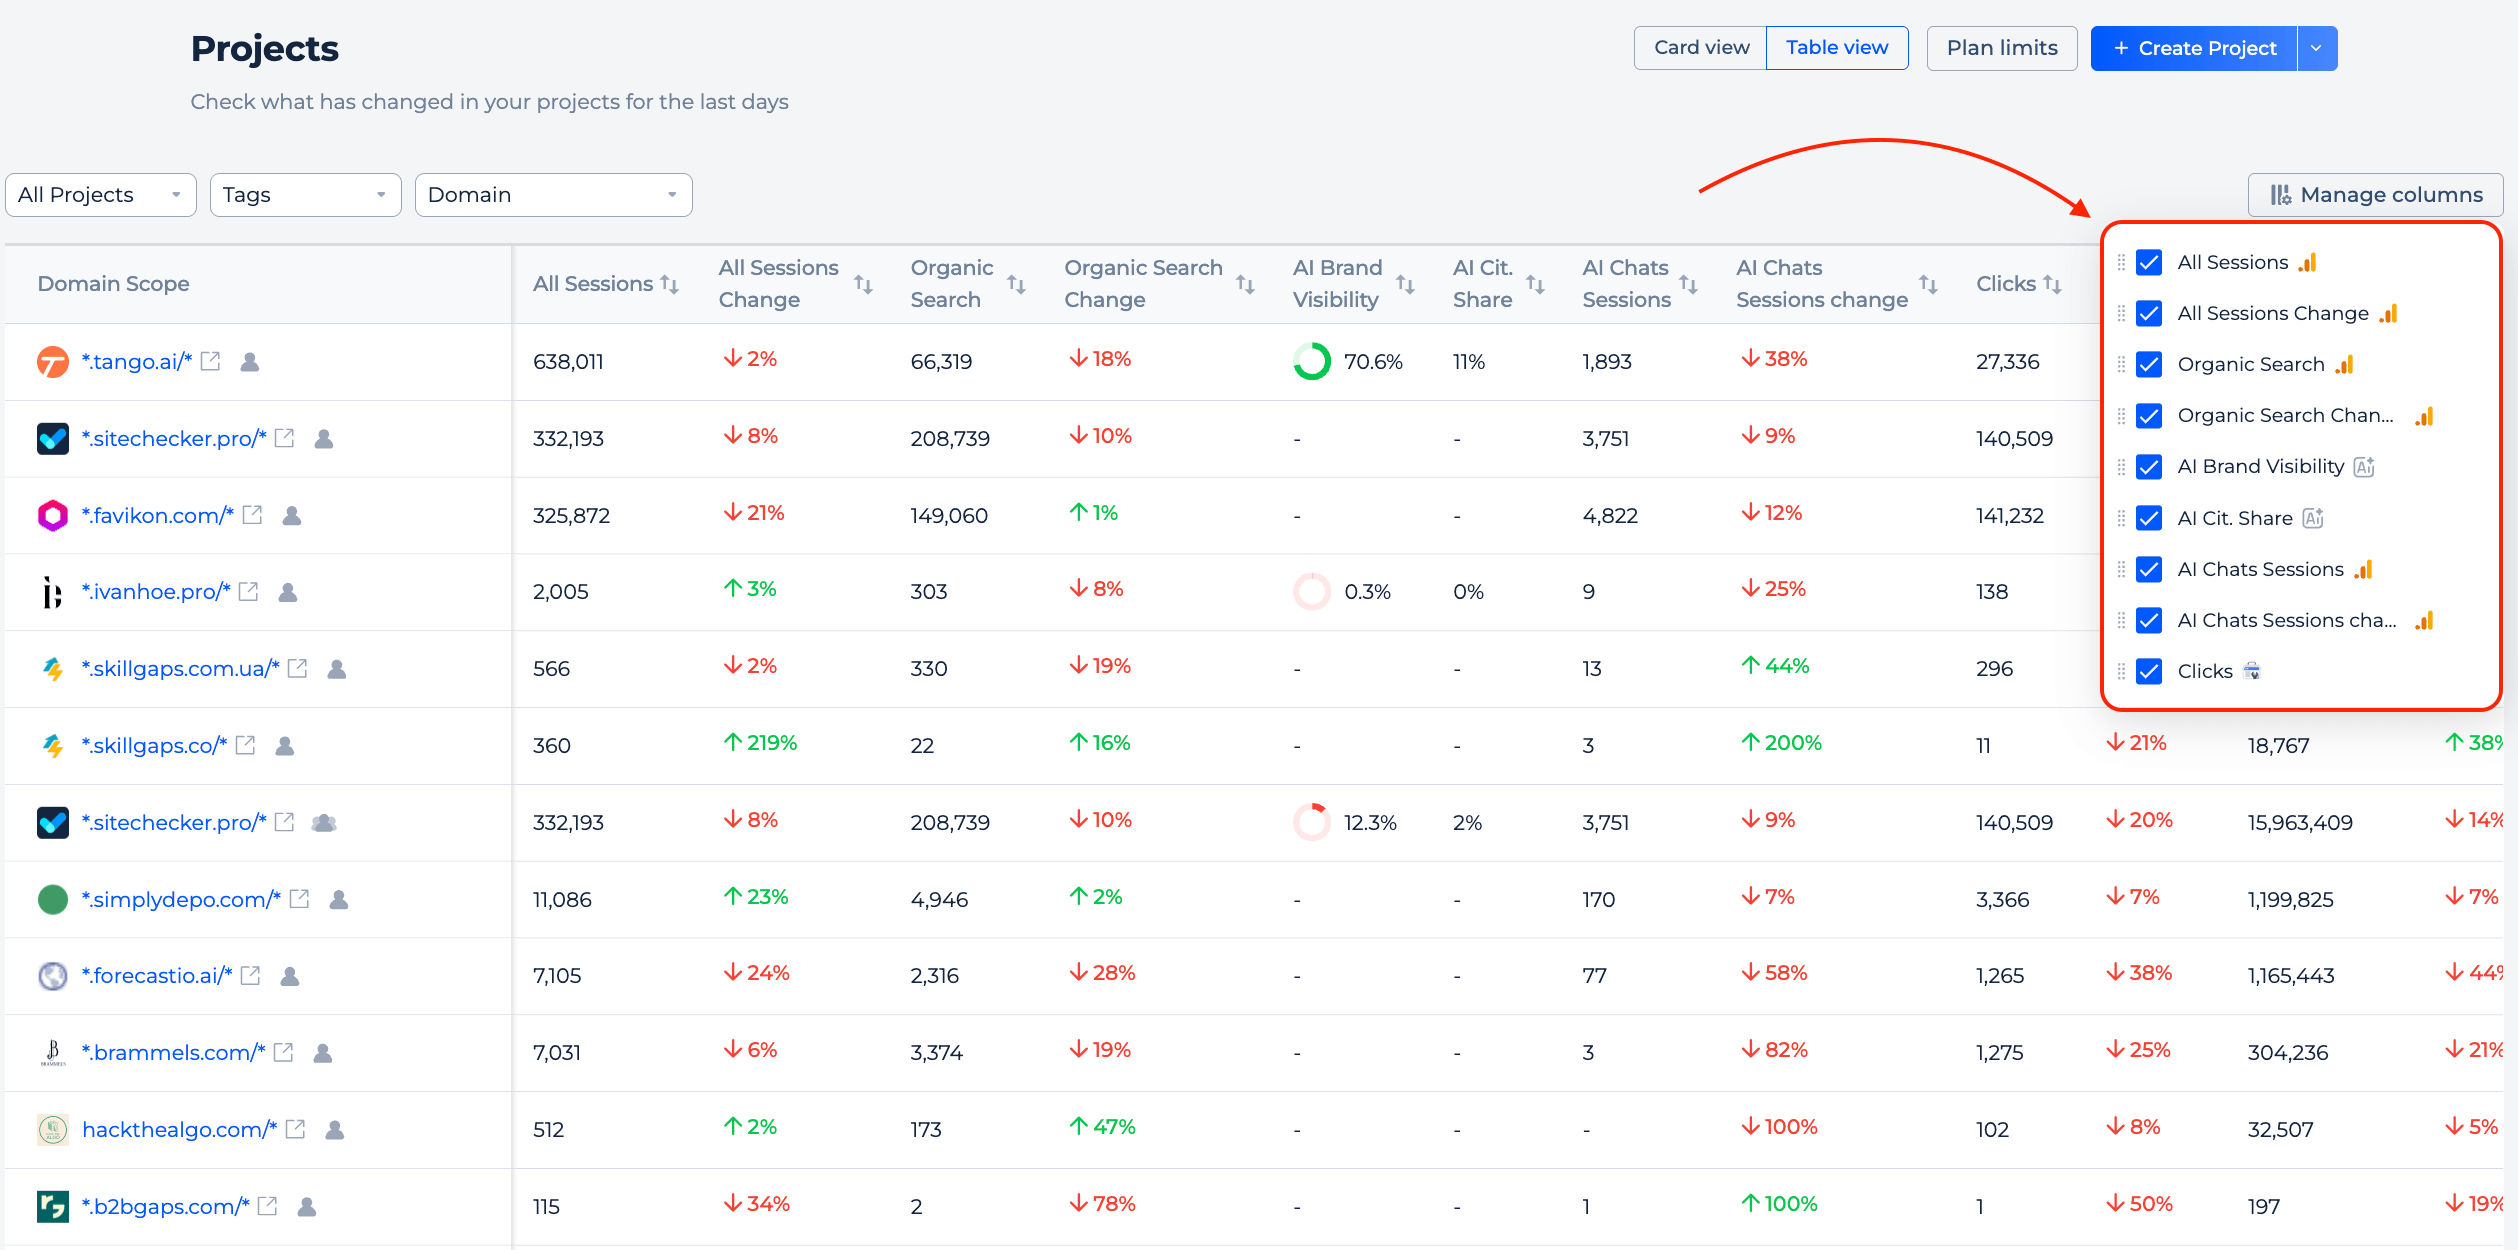
Table view gets five new columns: Sessions, Organic Search, and AI Chats Sessions with their changes, plus AI Brand Visibility and AI Citation Share.
So you can compare traffic sources and AI visibility across all your projects without opening each one.
5. Page Segments updates
GA4 data for every segment
Page Segments used to show only search metrics from GSC. Now, with GA4 connected, each segment also shows sessions, bounce rate, average session duration, key events, and session key event rate, in both Trend and Share views and in exports.
You can now judge a segment not just by clicks and impressions, but by how people behave after they land and whether they convert.
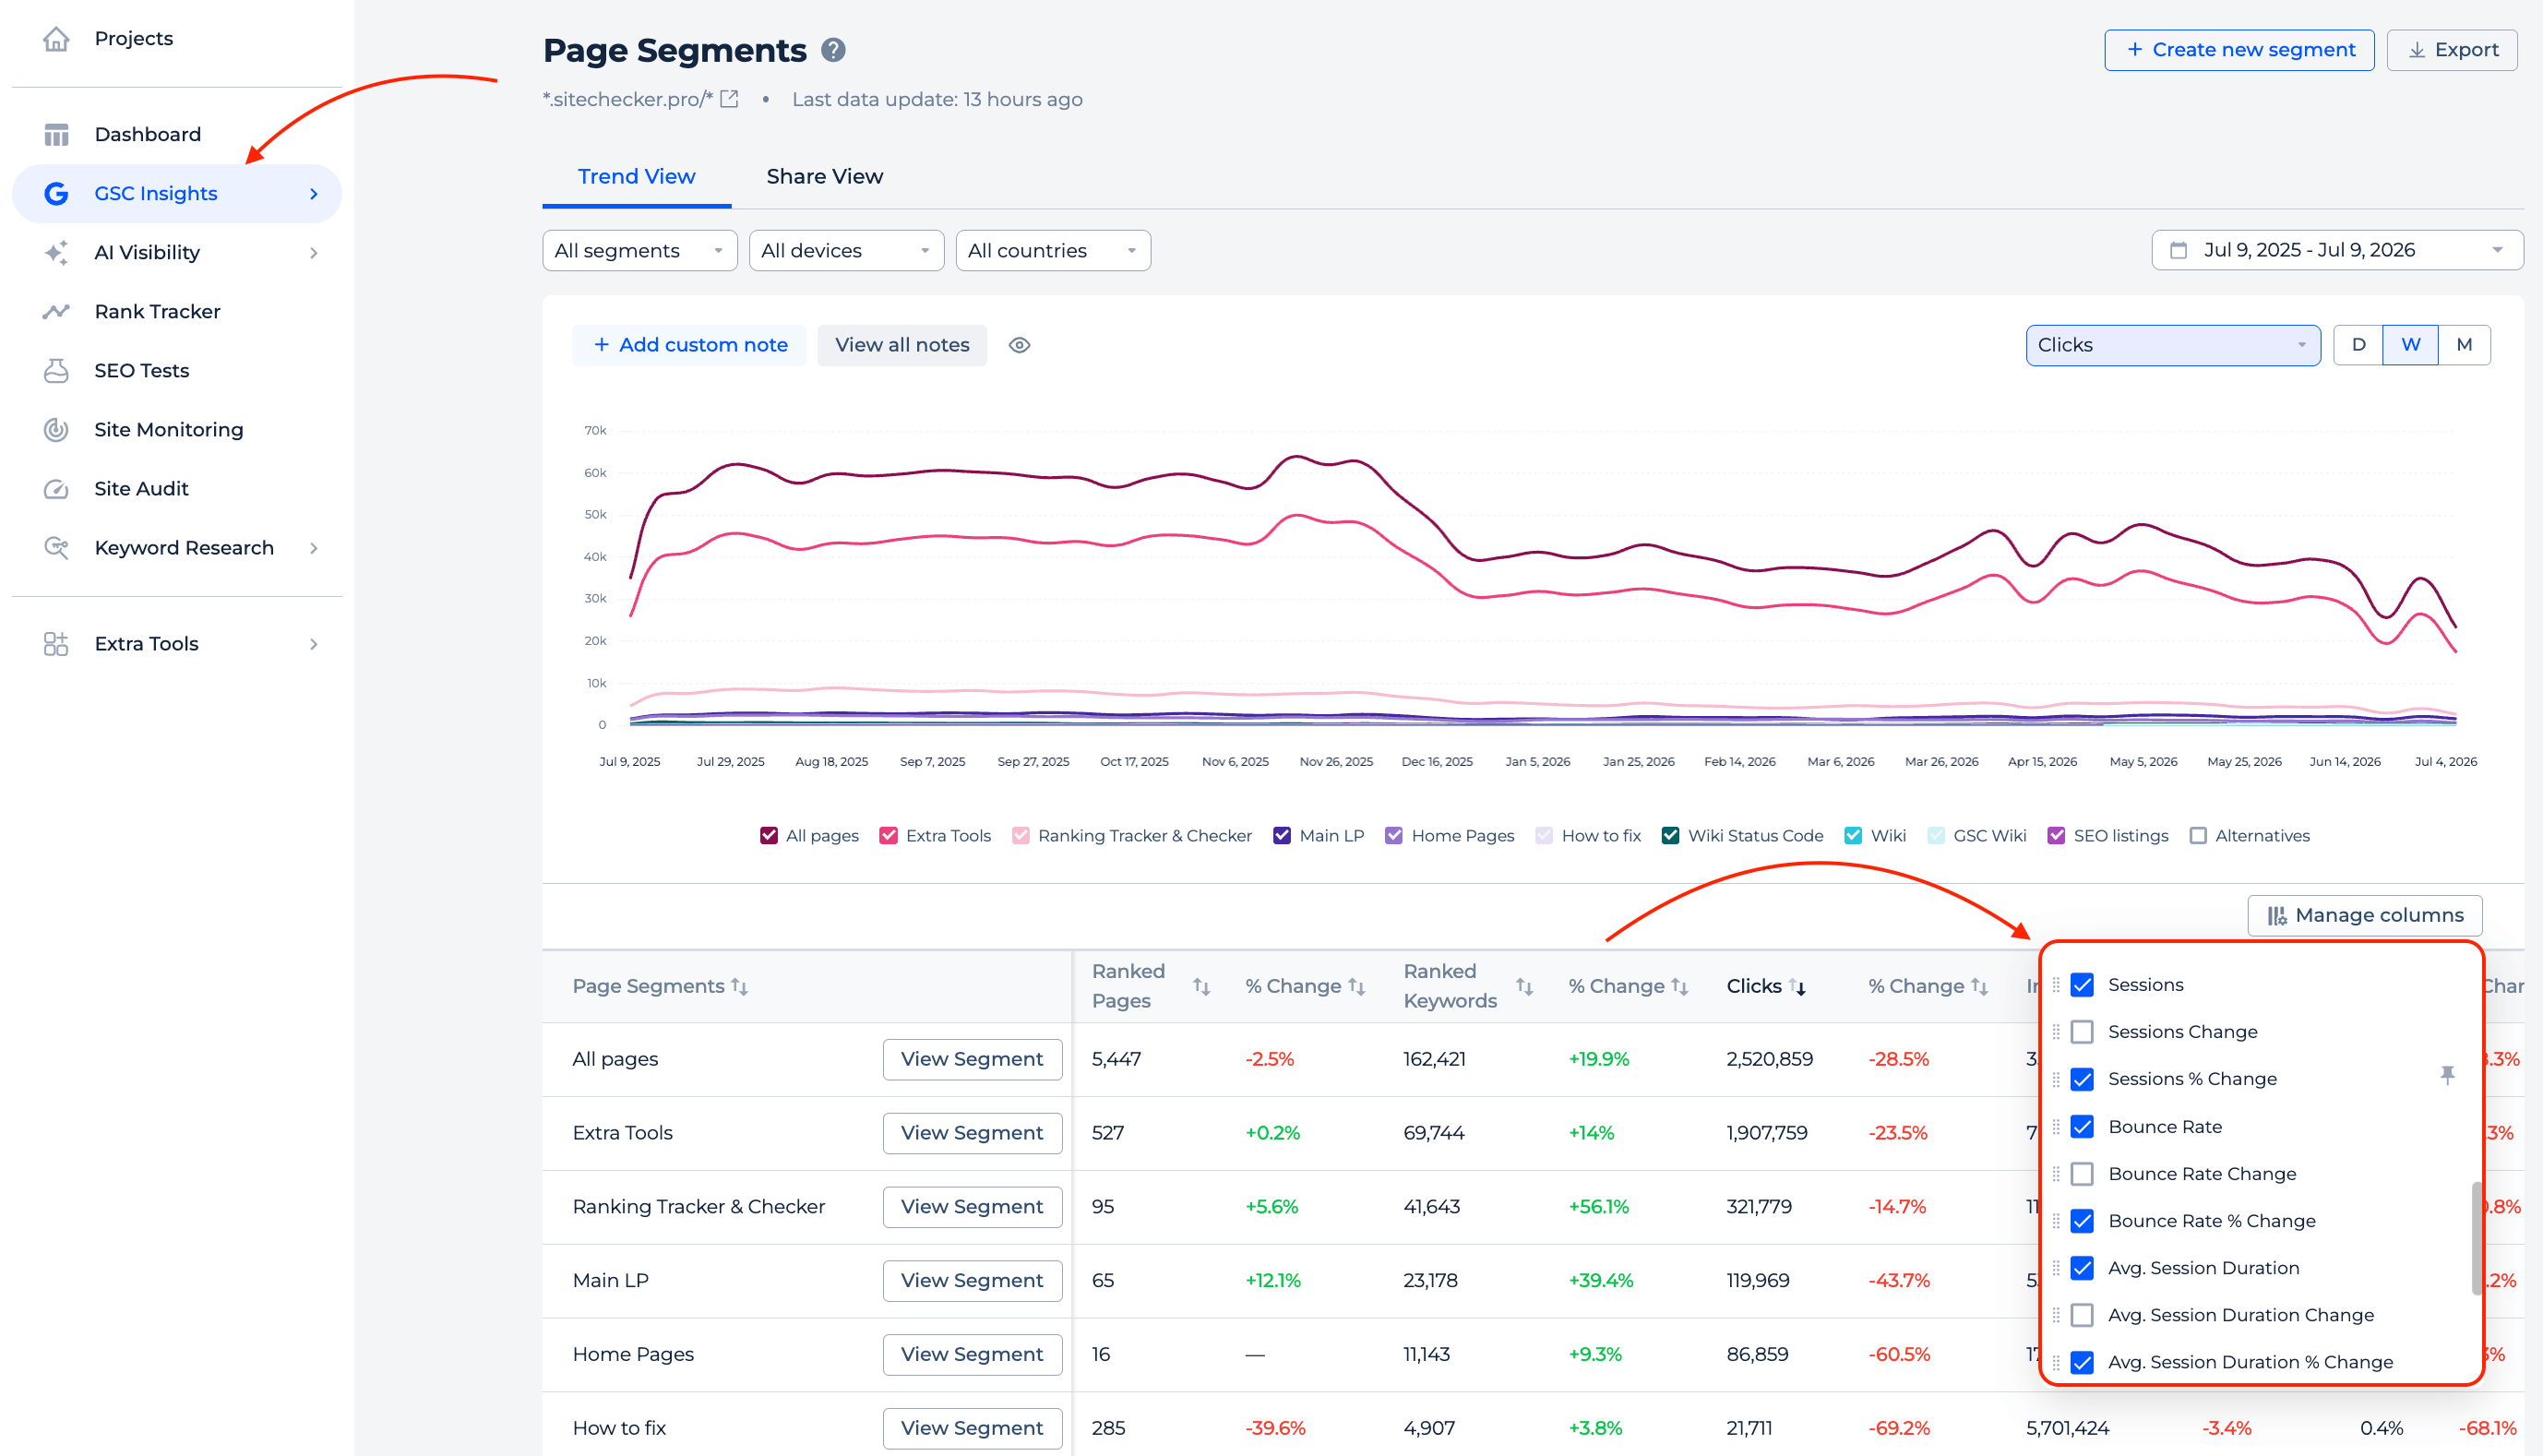
We also made the Trend View and Share View switcher more visible, since many of you were missing Share View.
Create segments with regex
There’s a third way to create segments now, next to filter by rules and list of URLs: Regex. It’s built for cases where you need to match a large number of path patterns at once, like grouping hundreds of folders that don’t follow one simple rule.
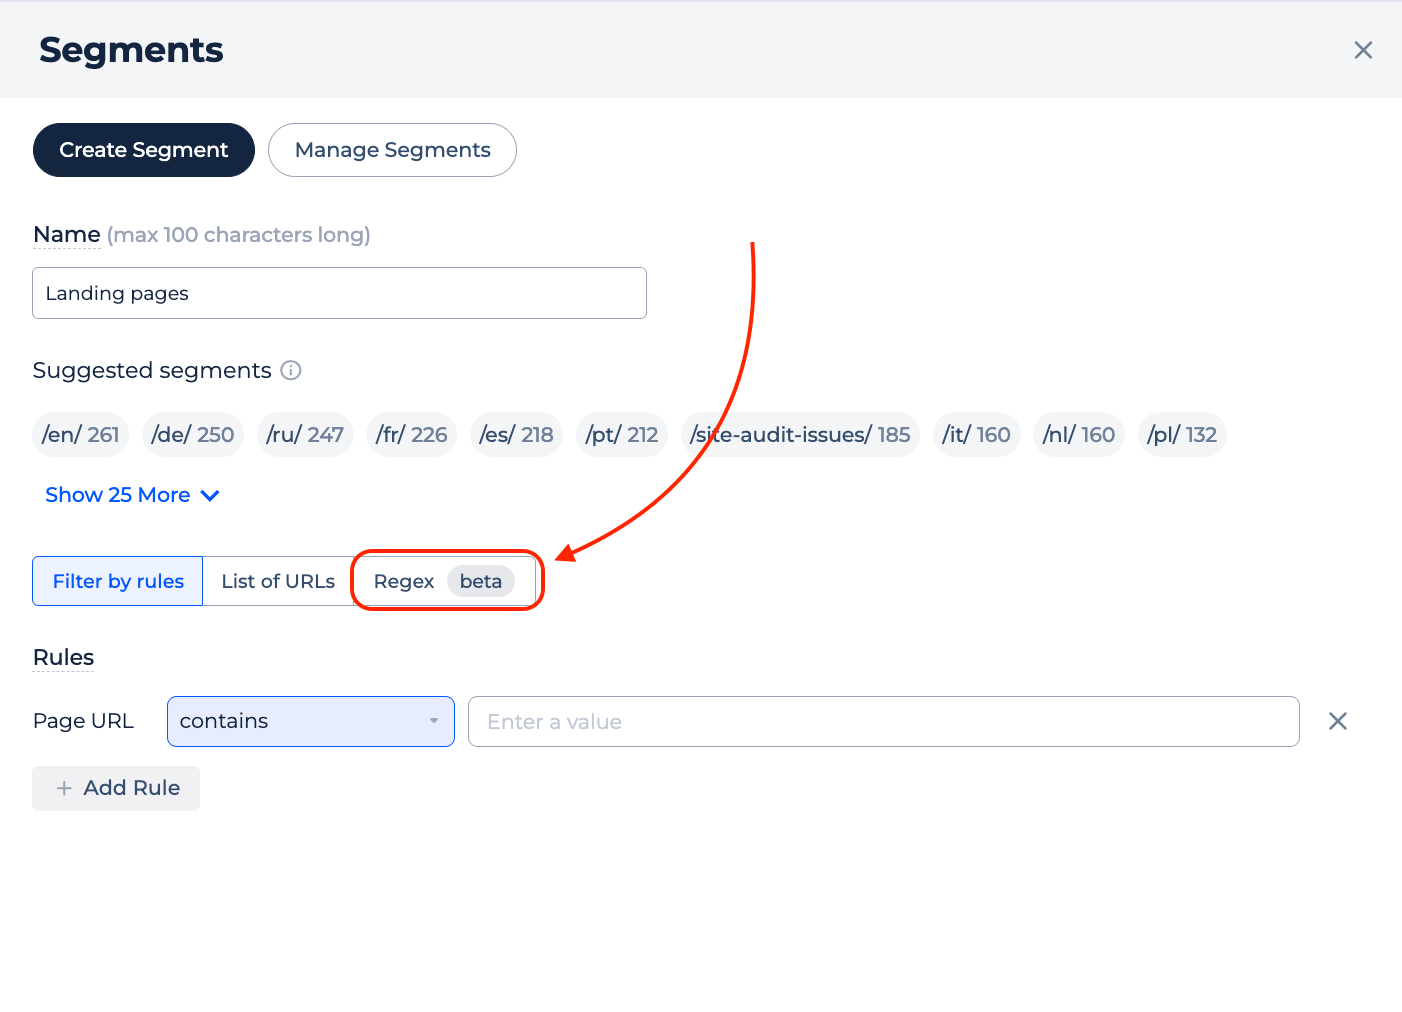
Regex segments support matches and doesn’t match logic and work everywhere segments do, from Site Audit to GSC reports.
6. Competitor data in the Rank Tracker Looker Studio connector
The Rank Tracker connector for Looker Studio now includes competitor data. Two new datasets are available next to the existing site-level and keyword-level ones: competitors-domains-level and competitors-keywords-level.
The domains dataset gives you one row per competitor per date, with visibility and keyword counts across ranking brackets from top 1 to no position, plus changes.
It includes historical dates, so you can build trend charts of how a competitor’s visibility moved over any range.
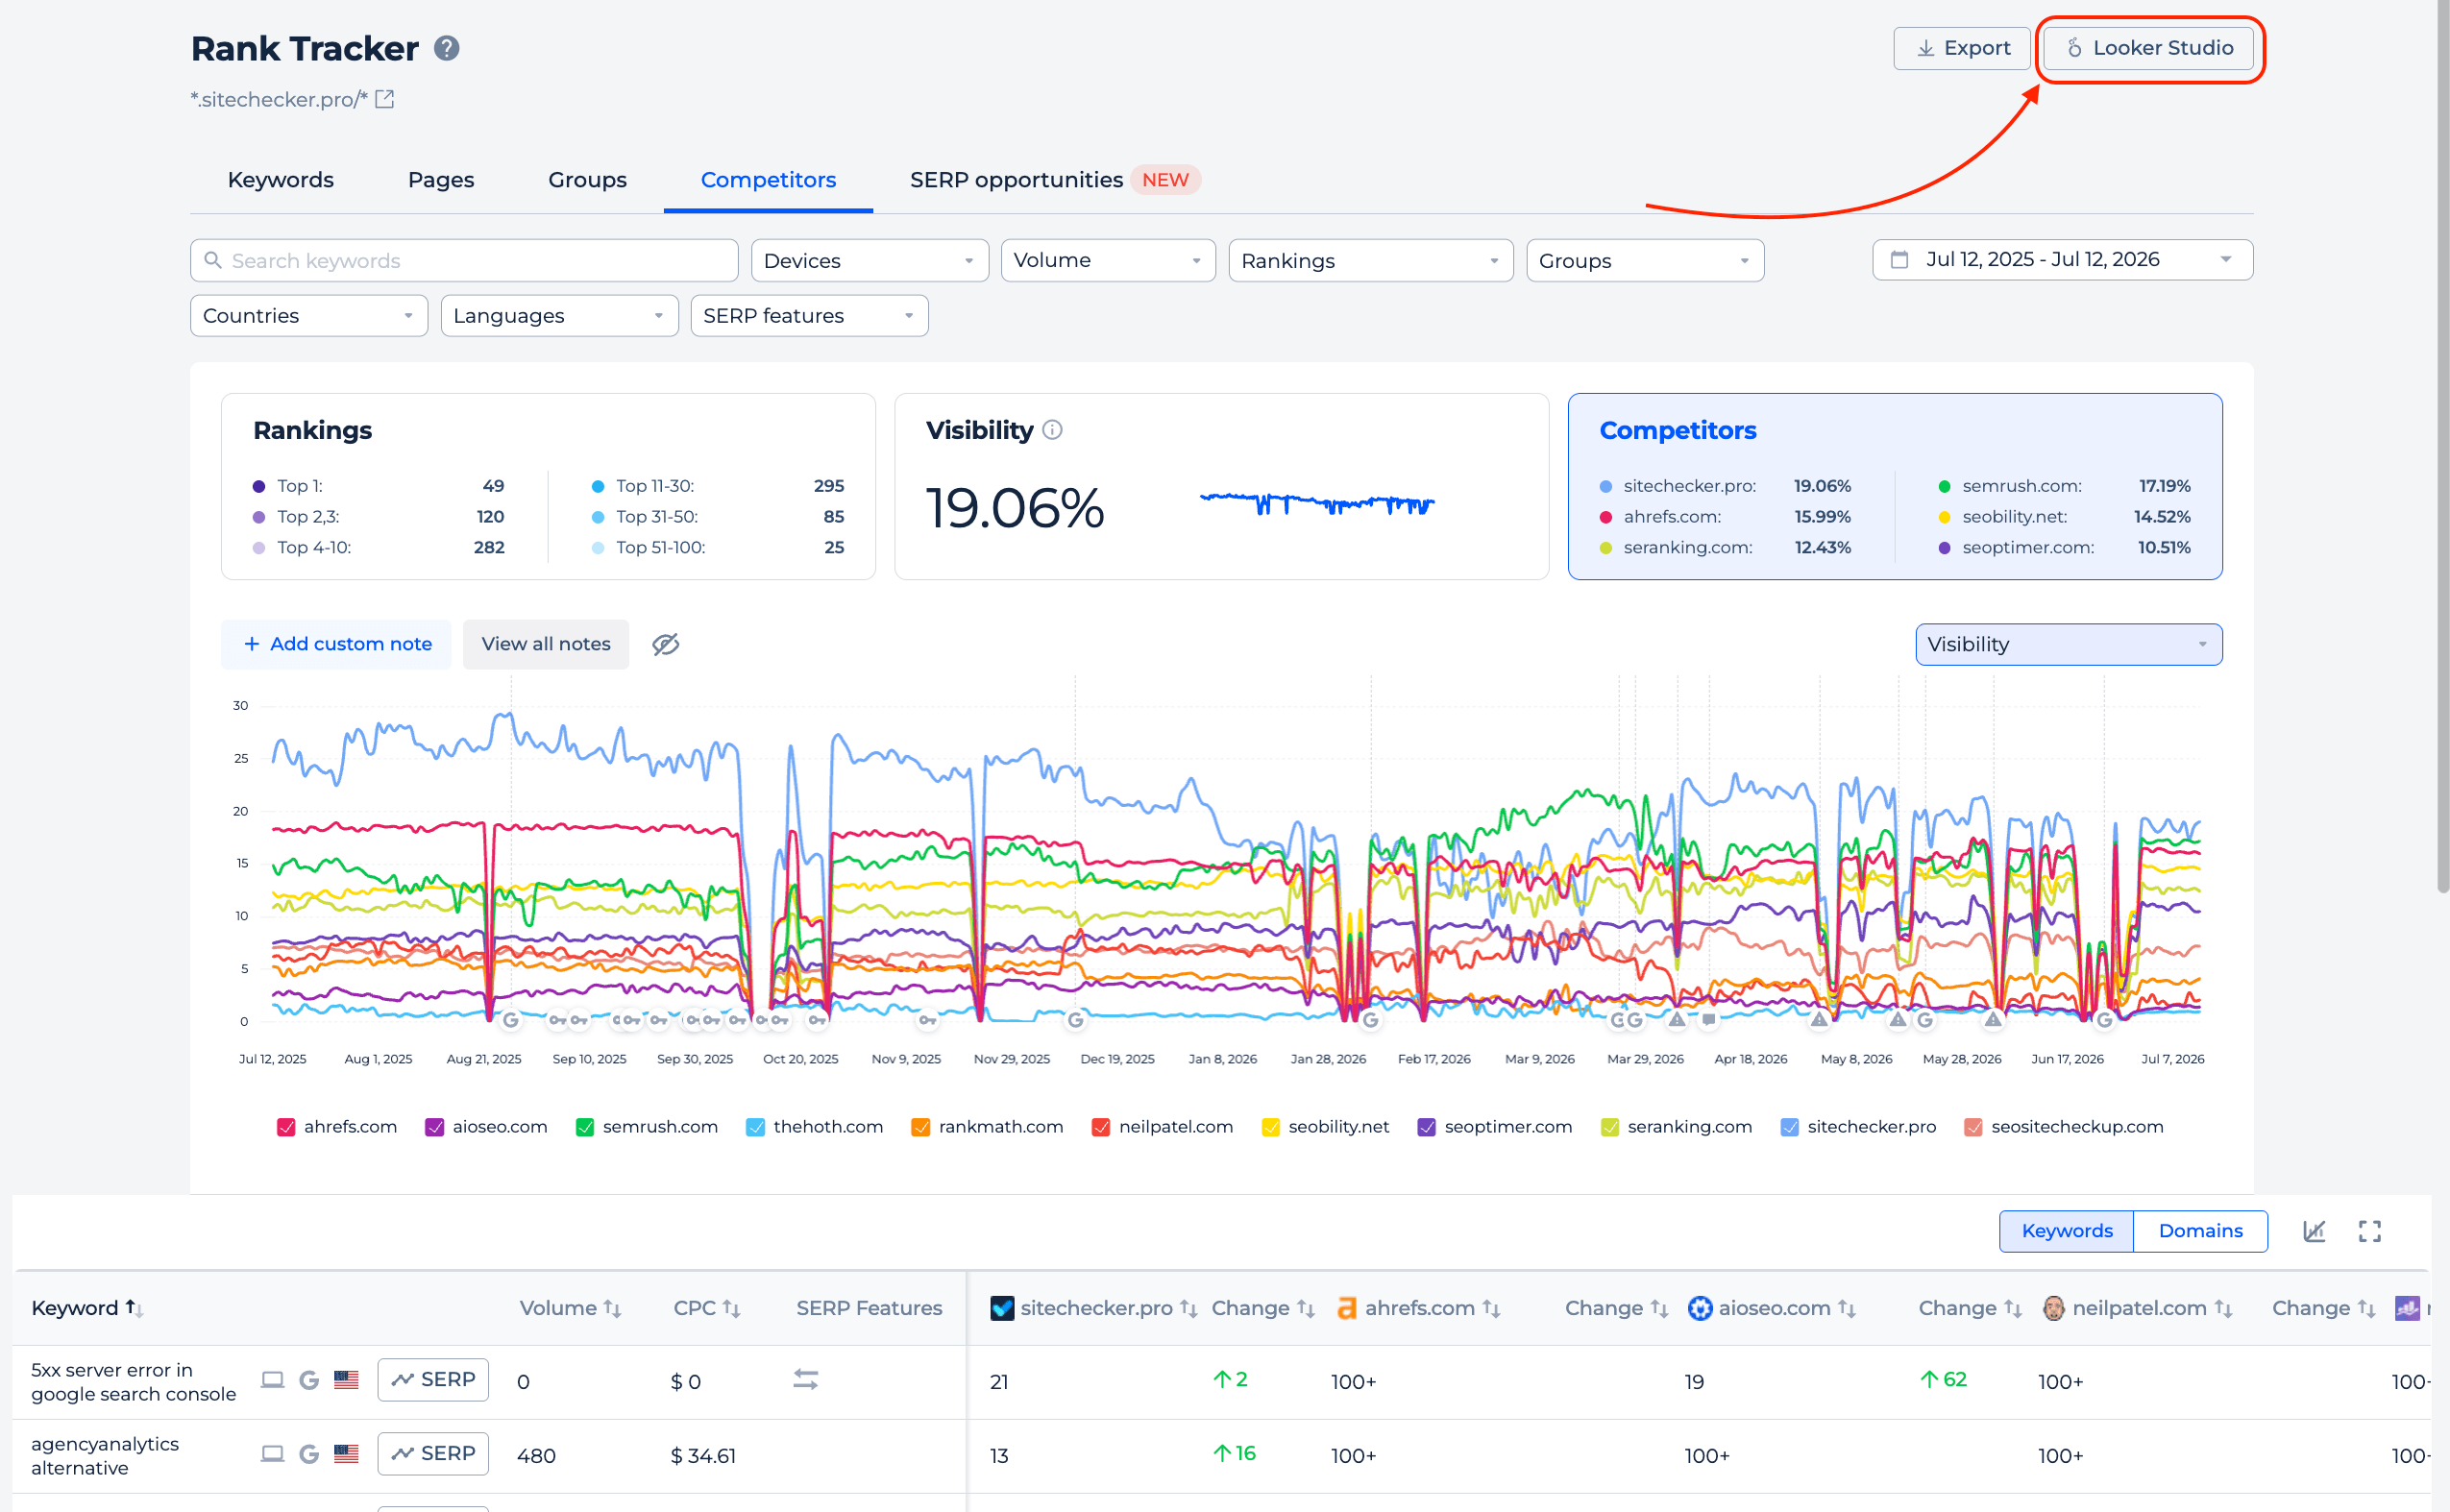
The keywords dataset goes deeper: one row per keyword, per competitor, per date, so you can filter and group it in Looker Studio however you need.
The numbers match what you see in Rank Tracker itself, so your client reports and the app always tell the same story.
7. Metric switcher on the Page Details keyword chart
The Position Dynamics by Top 15 Search Queries chart in Page Details is now Dynamics by Top 15 Search Keywords, and it shows more than positions. You can switch between Position, Impressions, and Clicks for the same set of top 15 keywords.
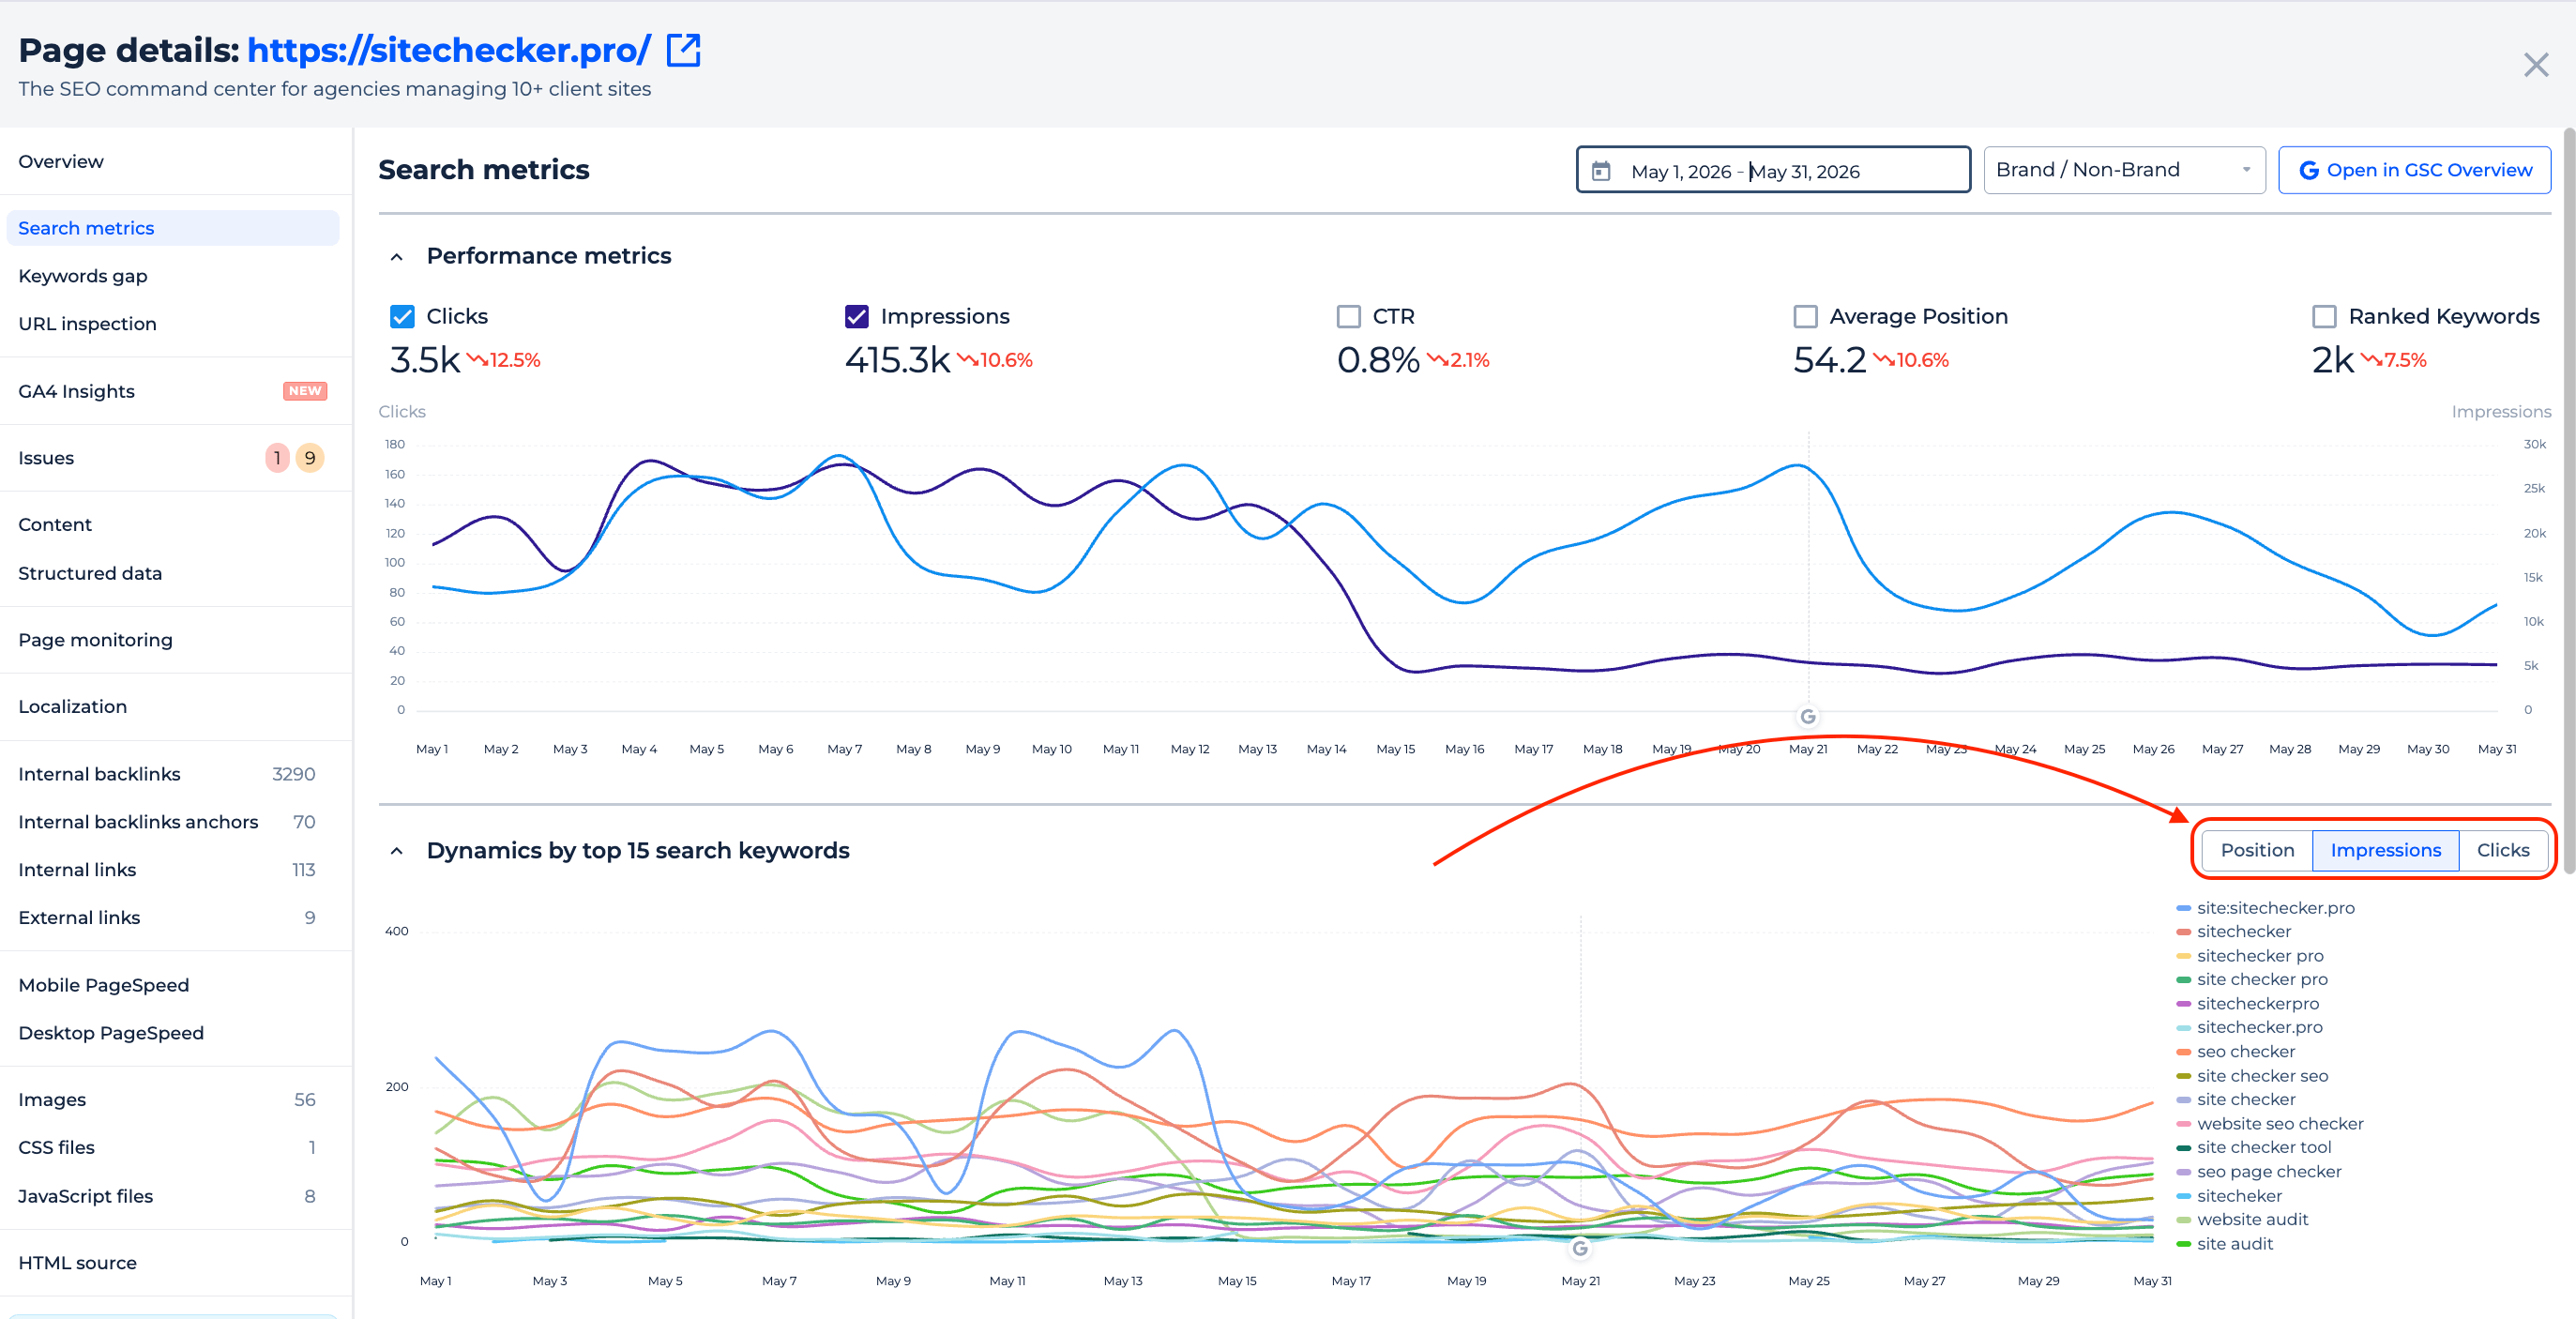
The keyword set stays the same across all three views, so you can see how a page’s rankings, exposure, and traffic move together over time.