GSC and GA4 report in one search engagement dashboard
Stop switching between Search Console and Analytics to understand your organic traffic.
Inside the search engagement report
Google organic traffic only
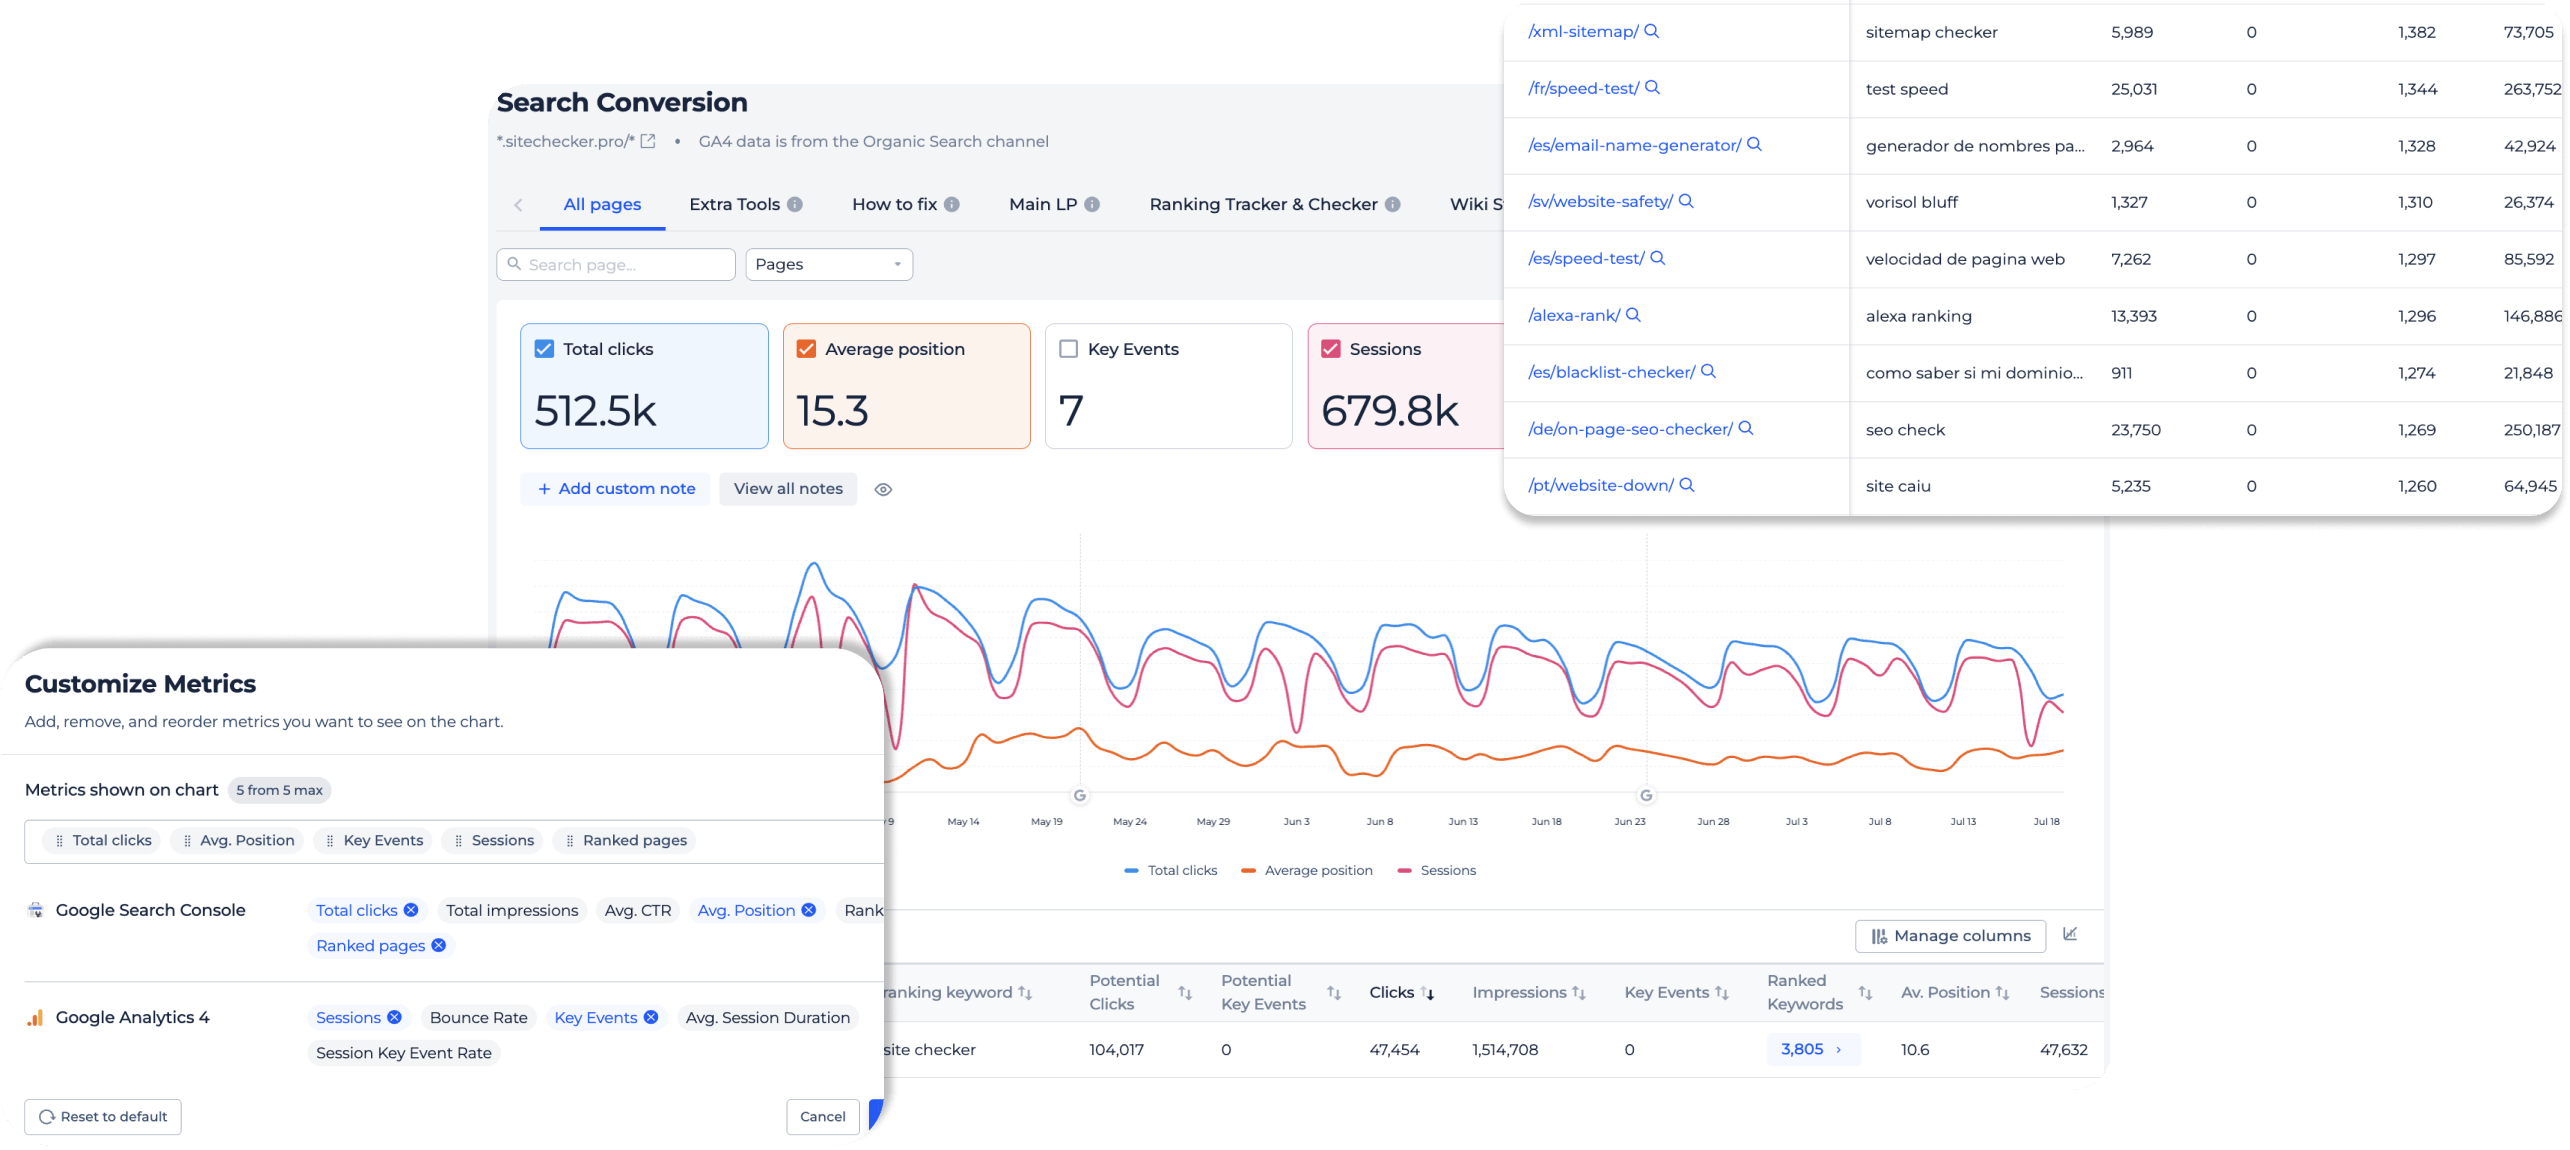
GA4 data in this report covers only google / organic sessions. That makes behavior and conversion numbers directly comparable with Search Console data.
No paid, referral, or direct traffic dilutes the picture.
No paid, referral, or direct traffic dilutes the picture.
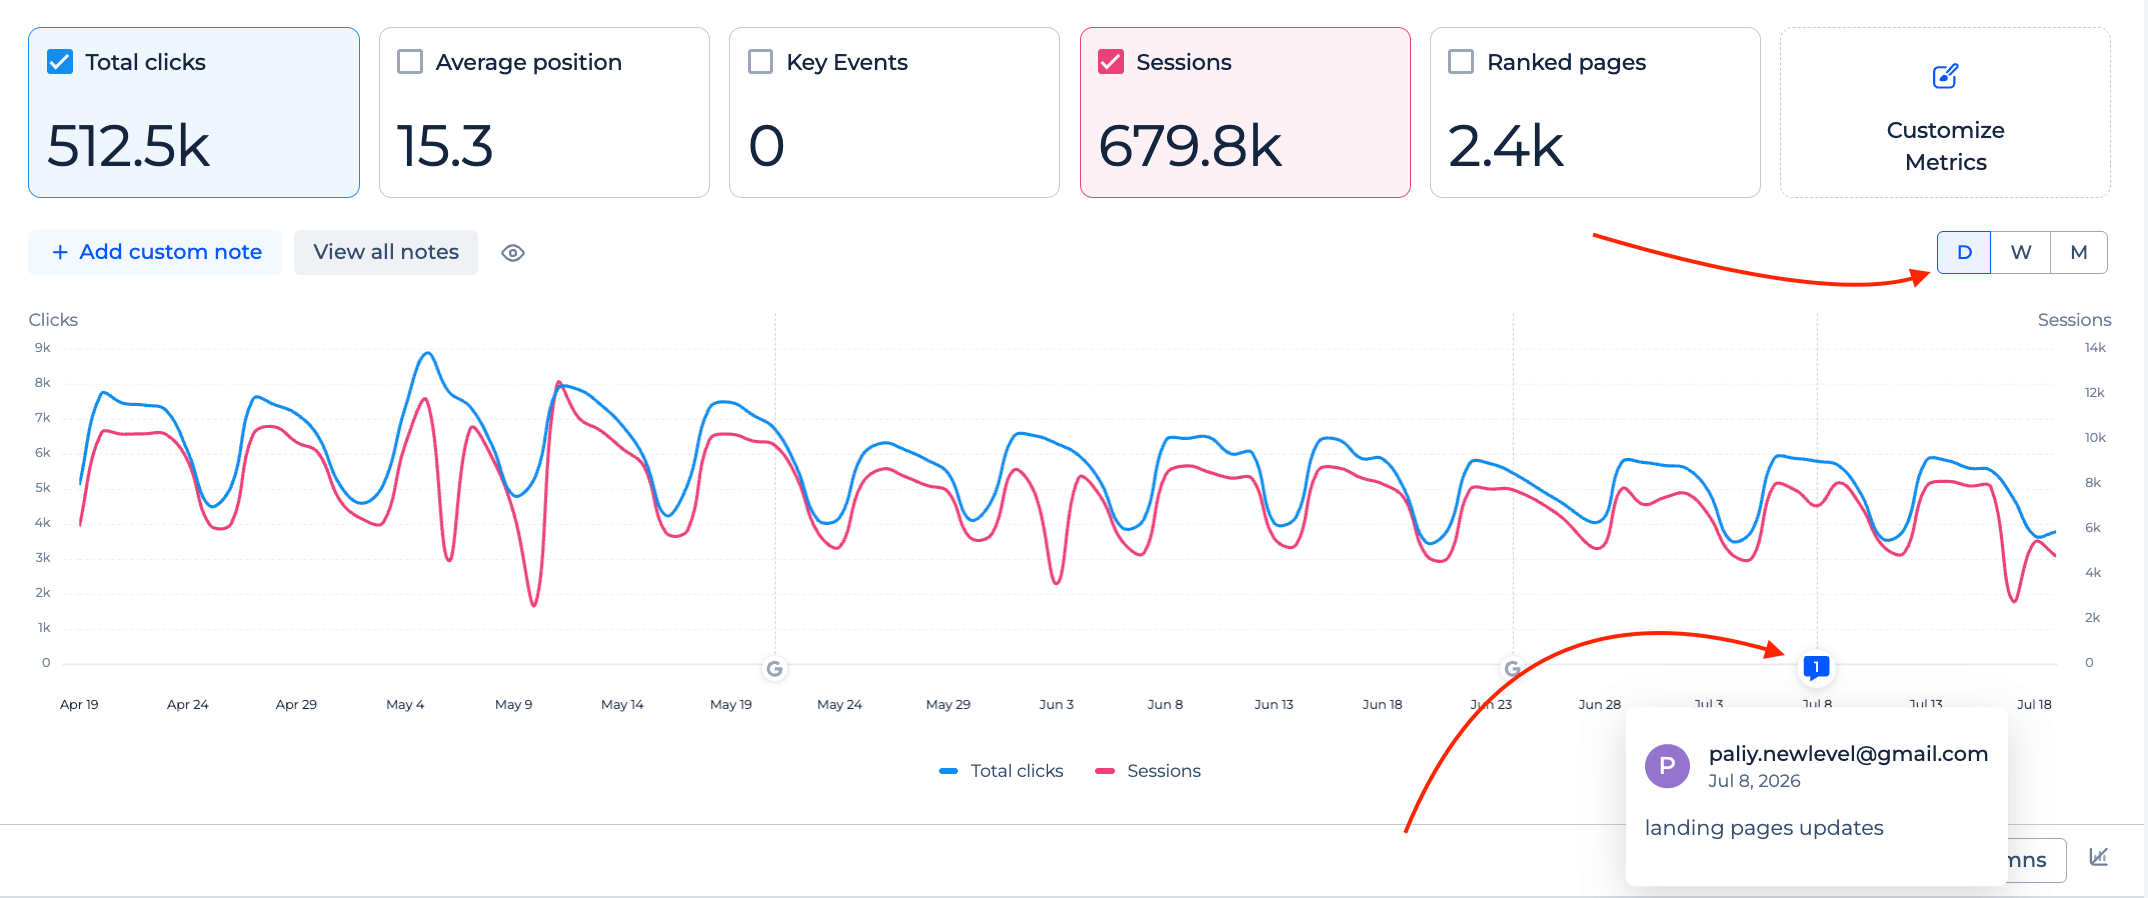
Daily chart with notes
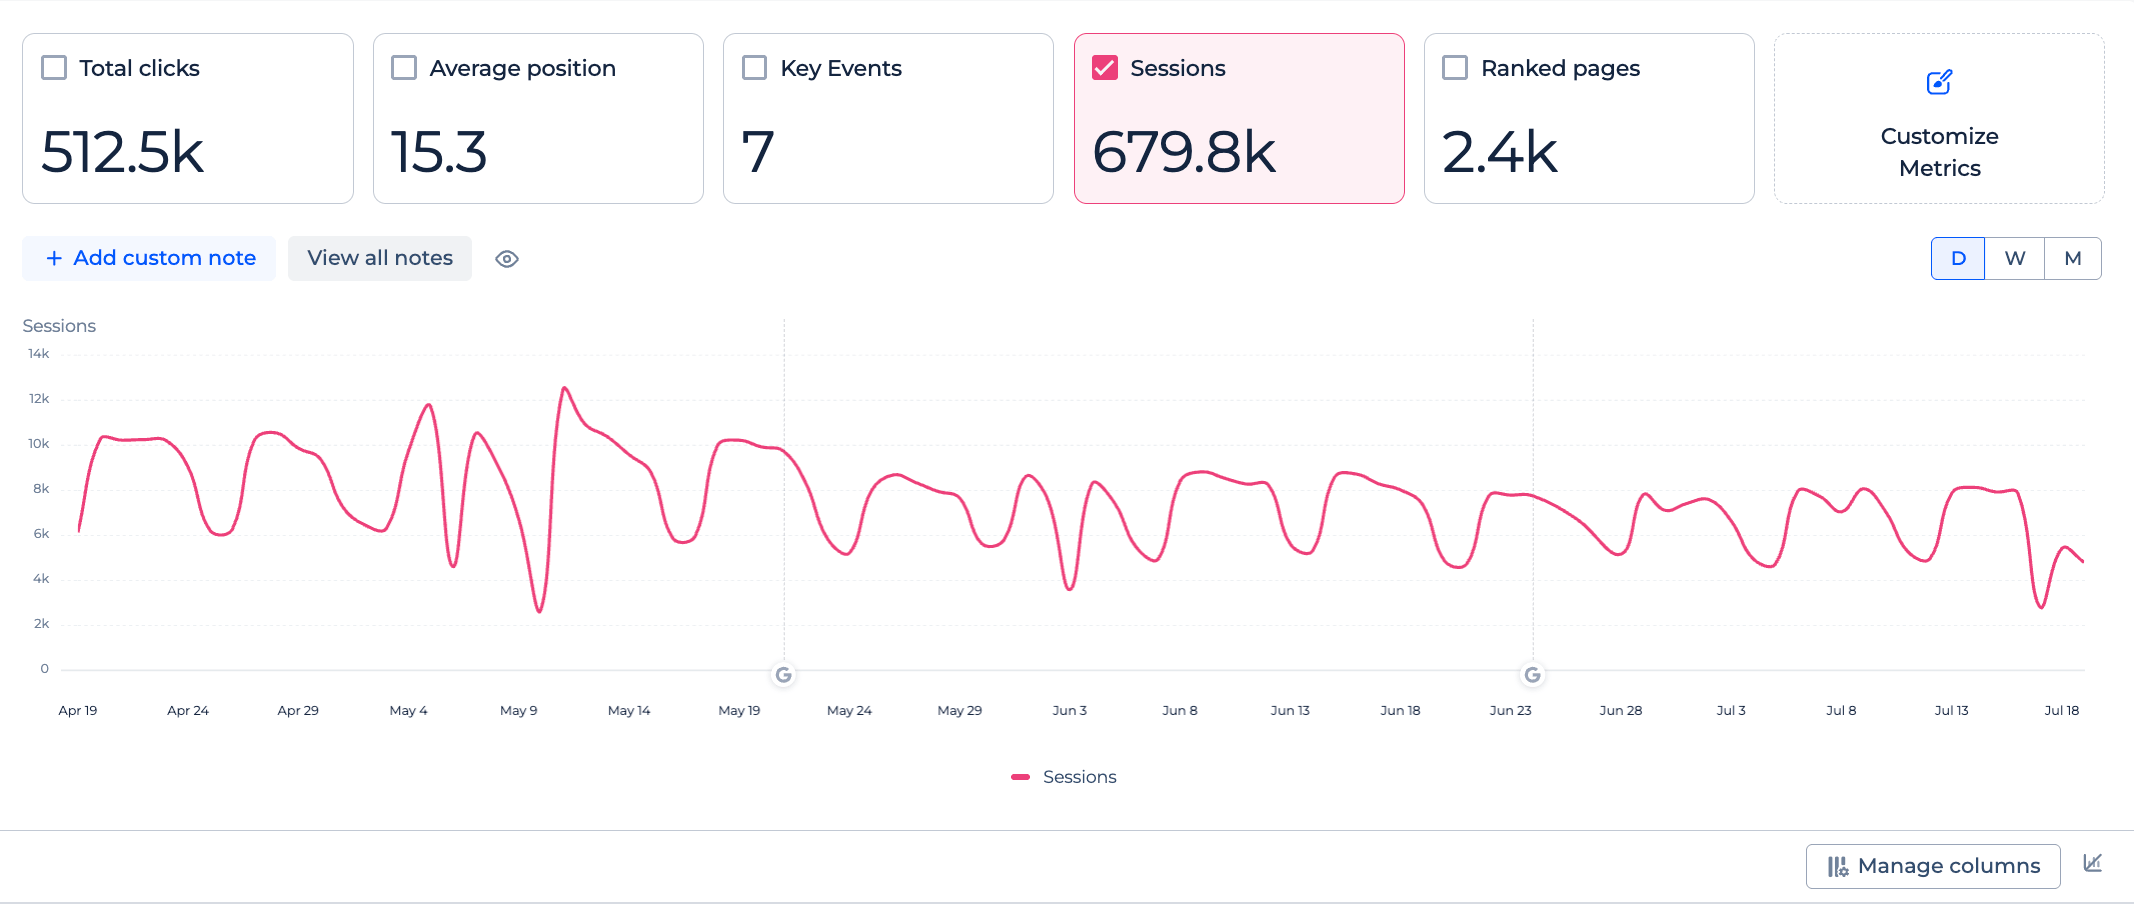
The chart works in daily, weekly, or monthly view.
Add custom notes to mark releases, redesigns, or algorithm updates and see how metrics reacted.
Add custom notes to mark releases, redesigns, or algorithm updates and see how metrics reacted.
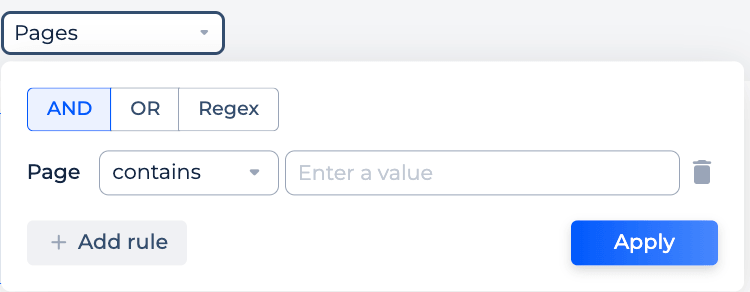
Page filters
Find any set of pages with quick URL search or flexible filter rules.
Combine AND / OR conditions or use regex, the same way filtering works in the Google Search Console dashboard. Filters apply to the cards, the chart, and the table at once.
Combine AND / OR conditions or use regex, the same way filtering works in the Google Search Console dashboard. Filters apply to the cards, the chart, and the table at once.
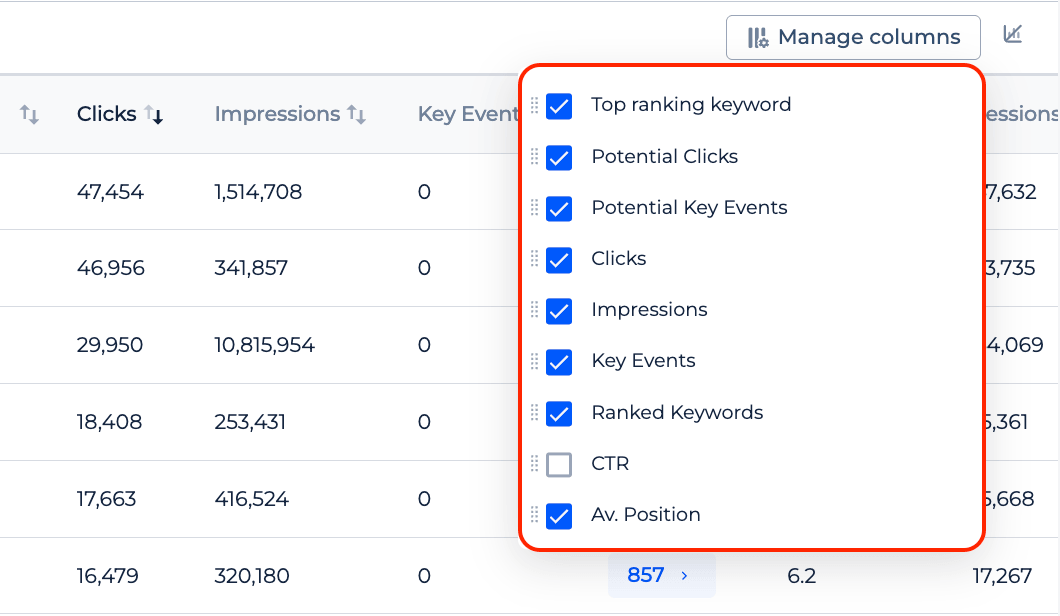
Manage columns
Turn table columns on and off, reorder them, and pin the ones you compare most.
With compare enabled, you can also show absolute changes next to percent change.
With compare enabled, you can also show absolute changes next to percent change.
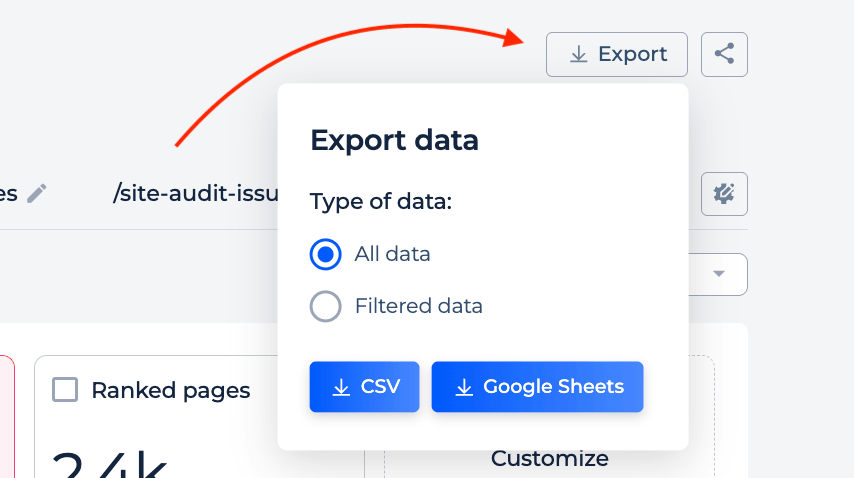
Export and share
Export the data or share the whole report by link.
Teammates and clients open the same view without access to your GSC or GA4 accounts.
Teammates and clients open the same view without access to your GSC or GA4 accounts.
FAQ
What is the search engagement report?
It is a report that merges Google Search Console and Google Analytics 4 data by landing page.
You see search metrics and behavior metrics for the same URLs and the same period in one dashboard, instead of switching between two tools or maintaining a Looker Studio template.
You see search metrics and behavior metrics for the same URLs and the same period in one dashboard, instead of switching between two tools or maintaining a Looker Studio template.
Which metrics does the report import?
From Google Search Console: clicks, impressions, average CTR, average position, ranking keywords, and ranking pages.
From Google Analytics 4: sessions, bounce rate, average session duration, key events, and session key event rate. GA4 metrics cover only google / organic traffic.
From Google Analytics 4: sessions, bounce rate, average session duration, key events, and session key event rate. GA4 metrics cover only google / organic traffic.
How does the GSC and GA4 merge work?
Search Console pages are the base, and GA4 metrics are joined to them by URL.
Even if GA4 tracks a page with extra URL parameters, its sessions and events are counted toward the main page. So the report always follows your real landing pages.
Even if GA4 tracks a page with extra URL parameters, its sessions and events are counted toward the main page. So the report always follows your real landing pages.
Why does the report use only google / organic traffic from GA4?
Because Search Console data covers Google organic search only.
Limiting GA4 to the same source makes both datasets describe the same visitors, so bounce rate, session duration, and key events are directly comparable with clicks and positions.
Limiting GA4 to the same source makes both datasets describe the same visitors, so bounce rate, session duration, and key events are directly comparable with clicks and positions.
How is clicks and key events potential calculated?
The report estimates how many clicks and key events a page can get if it ranks first for all the queries it already ranks for, keeping its current conversion rate.
It is an approximate number, but it helps you sort pages by upside and pick which ones are worth your attention.
It is an approximate number, but it helps you sort pages by upside and pick which ones are worth your attention.
How can this report explain an organic traffic drop?
On one chart you can see whether CTR fell while average position held, whether clicks dropped but key events grew, and how engagement changed on the same pages.
That is usually enough to show a client the real cause instead of a raw traffic number.
That is usually enough to show a client the real cause instead of a raw traffic number.